DOI:
10.1039/B9AY00112C
(Paper)
Anal. Methods, 2010,
2, 890-896
Received
16th July 2009
, Accepted 12th April 2010
First published on
19th May 2010
Abstract
Sildenafil and vardenafil are western drugs used in the treatment of male erectile dysfunction (ED). Prescription is required to use these drugs in many countries including Hong Kong. Recently, health supplements and Chinese herbal drugs claiming to have improvement in male potency were found to be adulterated with these drugs. Even worse, some of these products were found to contain analogues of ED drugs. For regulatory purposes, drug enforcement agencies often use analytical techniques such as HPLC-UV or LC-MS/MS in scheduled multiple reaction monitoring (MRM) mode for routine screening of western drug ingredients. However, drug analogues are expected to have different elution profiles and the ions produced by drug analogues would be different, making them transparent in scheduled MRM conditions. To tackle the problem, an acquisition method that combined precursor ion scan (PIS) with information dependent acquisition (IDA) followed by enhanced product ion (EPI) scan was developed. Results suggested that such an approach could provide a very powerful tool in the detection of analogues of sildenafil and vardenafil.
Introduction
Health supplements and Chinese herbal drugs have gained popularity in the health care business for the belief of their abilities in boosting individual's health condition and treating disease in an ‘all natural’ way without the side effects most western medicines would have. However, adulteration of these products with western medicines is a long existing problem.1,2 Sildenafil and vardenafil are western drugs belonging to the group of phosphodiesterase type 5 inhibitors used in the treatment of male erectile dysfunction. Their pharmaceutical properties and safety evaluation have been fully assessed in clinical studies before approval for treatment use.3 These ED drugs are the major ingredients used in the adulteration of health supplements and Chinese herbal drugs that advertised themselves as aphrodisiacs or having improvement in male potency.4 In recent years, reports in literature indicate that there is a trend in the increasing use of analogues of ED drugs in these so called ‘all natural’ products.5–10 These analogues mimic chemicals of the original drugs by modifying their molecular structures to varying degrees. Suppliers of these analogues often promote their ‘stuff’ as ‘substance not regulated by drug authority’ and ‘invisible in routine drug screening’. Without proper safety evaluation and clinical study data, it is viewed that preparations containing such drug analogues imposed a significant threat to the health of the general public and a major challenge to the drug regulatory authorities.
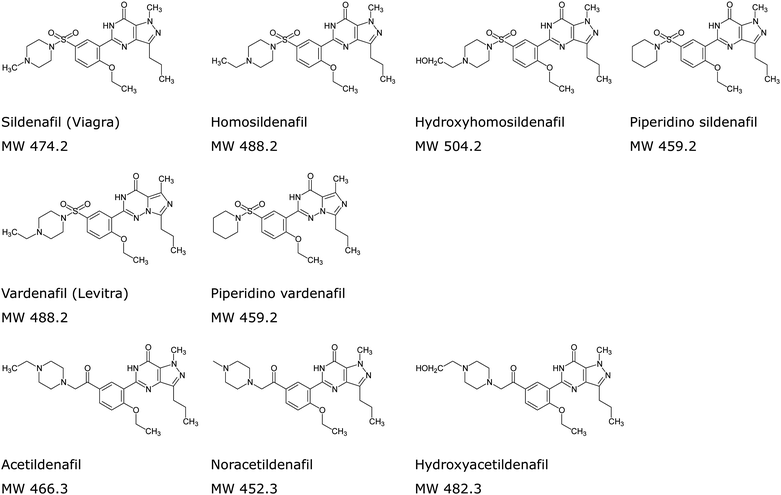
The drug analogues of sildenafil and vardenafil identified can be divided into different series according to their structures as shown in Fig. 1. It is reasonable to assume that by preserving the ‘core’ structure of the drug, the analogues would possess similar pharmacological effects. The analogues of sildenafil and vardenafil reported in literature often have their modification in the piperazinosulfonamide moiety in which it plays a role in improving physicochemical properties of the drugs by reducing lipophilicity and increasing solubility.11 For example in sildenafil, when the N-methyl group attached to the piperazine ring is replaced by an N-ethyl group or an N-hydroxyethyl group, it becomes homosildenafil and hydroxyhomosildenafil respectively. Acetildenafil, which originally emerged as an analogue of sildenafil by replacing the sulfonyl group with an acetyl group, has developed its own series with more than three variants reported.5,9,10
 |
| | Fig. 1 Structures of some of the analogues of sildenafil, vardenafil and acetildenafil. | |
Drug enforcement agencies often use analytical techniques such as chromatography and mass spectrometry in routine screening of western drug adulteration. However, analogues are expected to have different elution profiles and characteristic mass fragments and thus would not be detected in routine drug screening. To make the matter worse, manufacturers of these ‘all natural’ products could use herbal extract as an additive to intensify the ‘matrix’ seen by the above techniques and make result interpretation very complicated.
The present study is focused on the development of a standard screening LC-MS/MS method by exploring the common chemical behavior, based on the similarity in chemical structures of drugs and drug analogues that might be present under the same experimental conditions. The method developed for the screening of drug analogues is considered to be sensitive, selective, and easy to adopt in providing an additional line of defense for the battle against drug analogues of sildenafil, vardenafil and acetildenafil.
Results and discussion
Development of the MS/MS method
There is literature reporting the use of LC-MS/MS in scheduled MRM mode for the simultaneous determination of six known ED drugs and drug analogues.12 However, setting up a MRM experiment requires the identity of the chemical being determined, in particular the information on m/z of its parent ion and fragmented daughter ions. It is therefore unlikely to rely on scheduled MRM in the detection of unknown chemical species. On the other hand, when the unknown species are known to have a common ‘core’, a precursor ion scan could be used to search for the presence of any molecule that would dissociate to give a common fragment ion and produce a positive response. The idea was tested with the analogues available in our laboratory. As ESI in +ve mode was often used in the routine analysis of these analogues and was thus used at the beginning of the present study. Experiments were conducted by obtaining the MS2 spectra of the [M + H]+ ions of sildenafil, vardenafil and acetildenafil at ramping collision energy. Preliminary results, as illustrated in the corresponding MS2 spectra (Fig. S1 in Electronic Supplementary Information (ESI)),† showed that no common fragment can be detected from these drugs. Similar work has been carried out by other research group recently to develop strategies for characterizing sildenafil, vardenafil, tadalafil and their analogues in herbal remedies. Due to the fact that no common fragment was found, a comprehensive network of scheduled MRM was suggested.13 However, we found that by switching to ESI in −ve mode, a common fragment ion of m/z 282 was present in all the drugs and drug analogues of sildenafil, vardenafil and acetildenafil being tested, as illustrated in the MS2 spectra obtained from the corresponding [M − H]− ions (Fig. S2 in ESI).†
An attempt was then made to optimize the tuning parameters for each of the nine drugs and drug analogues in −ve mode and the results were shown in Table 1. The figures indicated that the optimized conditions for all molecules under test are similar and hence all later LC-MS/MS experiments were conducted using the same set of tuning parameters. Based on the above finding, a MS/MS method was set up by using a combination of precursor ion scan (PIS) with information dependent acquisition (IDA) which would trigger an enhanced product ion (EPI) scan for the detection and identification of analogues of sildenafil, vardenafil and acetildenafil. The idea of IDA is to trigger one event by the result of another event and the whole process is illustrated schematically in Fig. 2. In the MS/MS method developed, the instrument first locates any pseudo-molecular ions that generate a daughter ion of m/z 282 in the survey scan (the PIS). Once such event is registered, the data system will then compare the value (e.g. peak intensity) of the event to a pre-defined criteria set in the IDA experiment (e.g. >10,000 cps). When this condition is fulfilled, the system proceeds to a second event of dependent scan (the EPI scan) by fixing the transmission of the detected precursor ion (the pseudo-molecular ion) in the first quadrupole (Q1) and trapping its fragmented ions in the linear ion trap (Q3) followed by scanning and detection of the fragment ions.
Table 1 Optimised instrument parameters for the analogues
| Compound |
Precursor ion (m/z) |
Product ion (m/z) |
Declustering potential/V |
Entrance potential/V |
Collision energy/eV |
Collision cell exit potential/V |
| Sildenafil |
473.3 |
282.0 |
−110 |
−10 |
−54 |
−5 |
| Homosildenafil |
487.3 |
282.0 |
−110 |
−10 |
−52 |
−5 |
| Hydroxyhomosildenafil |
503.3 |
282.0 |
−110 |
−10 |
−58 |
−5 |
| Piperidino sildenafil |
458.2 |
282.0 |
−110 |
−10 |
−52 |
−5 |
| Acetildenafil |
465.6 |
282.0 |
−110 |
−10 |
−56 |
−5 |
| Noracetildenafil |
451.4 |
282.0 |
−110 |
−10 |
−56 |
−5 |
| Hydroxyacetildenafil |
481.3 |
282.0 |
−110 |
−10 |
−58 |
−5 |
| Vardenafil |
487.3 |
282.0 |
−110 |
−10 |
−52 |
−5 |
| Piperidino vardenafil |
458.2 |
282.0 |
−110 |
−10 |
−52 |
−5 |
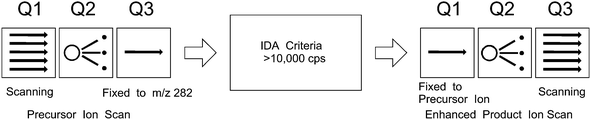 |
| | Fig. 2 The process of the IDA experiment. The precursor ion scan will survey the presence of −ve ion with m/z 282. Once such event is registered, the system proceeds to a second event of enhanced product ion scan by fixing the transmission of the detected precursor ion (the pseudo-molecular ion) in the first quadrupole (Q1) and scanning its fragment ions in the third quadrupole (Q3). | |
Method performance evaluation
The performance of the method, in terms of its detection limit and detection capability in sample with herbal matrix, was evaluated. Standard deviation (SD) of area responses of seven replicate analyses of 50 ppb standard solution and slope (S) of a calibration graph constructed from 50, 100 and 150 ppb standard solutions were determined. The detection limit, expressed as 3.3 times the SD and divided by S, was less than 50 ppb for all the nine drugs and drug analogues being investigated. To demonstrate the detection capability of the method with herbal matrix, diluted herbal extract was spiked separately with standard mixture 1 and 2 containing the nine drugs and drug analogues at 50 ppb level. The results of the analysis are shown in Fig. 3 and 4. The presence of peaks in the total ion chromatogram (TIC) of the precursor ion scan indicates that all the spiked drugs and drug analogues are detected. Based on the usual dosage recommended for sildenafil and vardenafil (50 and 10 mg respectively),3 the present method could detect as little as 0.15 mg of the drug in a tablet, assuming an average tablet weight of 0.3 g, which is considered to be sufficient for routine screening purpose.
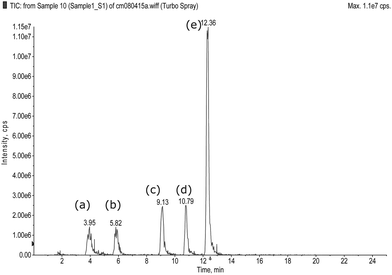 |
| | Fig. 3 TIC for sample spiked with mixture 1 (a) Noracetildenafil, (b) Hydroxyhomosildenafil, (c) Sildenafil, (d) Homosildenafil and (e) Piperidino vardenafil. | |
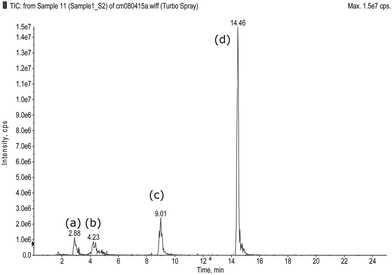 |
| | Fig. 4 TIC for sample spiked with mixture 2 (a) Hydroxyacetildenafil, (b) Acetildenafil, (c) Vardenafil and (d) Piperidino sildenafil. | |
Application of the LC-MS/MS method to commercial products
More than 100 samples of health supplements and Chinese herbal drugs, collected from the local market in a routine drug surveillance program, were examined by the LC-MS/MS method developed. Drug analogues of sildenafil, and vardenafil were detected in some of these products. To illustrate how to interpret the detection and identification from data, the result for a sample with a positive finding of piperidino vardenafil is shown in Fig. 5A. In Fig. 5A (i), a peak is detected at 12.31 min of the TIC of the precursor ion scan and this indicates the presence of either a drug or a drug analogue in the sample. Fig. 5A (ii) is the MS2 spectrum obtained from the precursor ion detected (with m/z 458) and it could be either piperidino vardenafil or piperidino sildenafil (both with MW 459). The substance was identified as piperidino vardenafil by matching the retention time of the peak with that of the standard (Fig. 3, peak (e)). All the positive findings in the samples were later confirmed with LC-MS/MS using scheduled MRM and standards solution of the drugs and drug analogues. No false positive was encountered in the study.
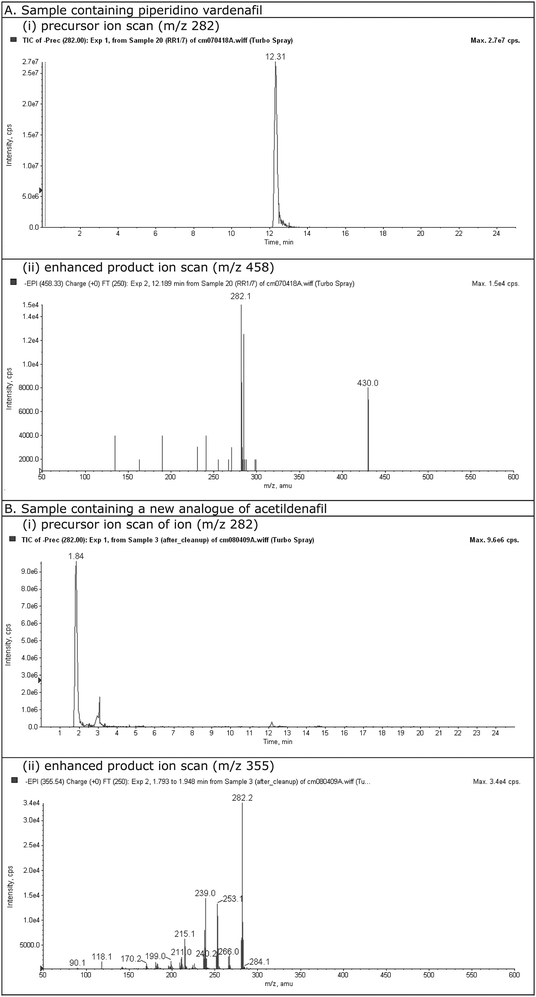 |
| | Fig. 5 Samples containing drug analogues. A. Piperidino vardenafil and B. New analogue of acetildenafil, (i) TIC of precursor ion scan, (ii) Mass spectrum of enhanced product ion scan. | |
![Proposed structure of compound X and acetildenafil (numbering from ref. [5]).](/image/article/2010/AY/b9ay00112c/b9ay00112c-f6.gif) |
| | Fig. 6 Proposed structure of compound X and acetildenafil (numbering from ref. [5]). | |
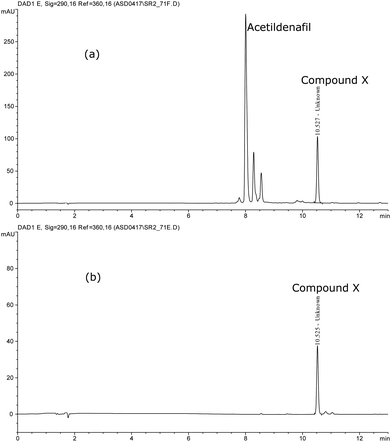 |
| | Fig. 7 HPLC-DAD Chromatogram (a) Cleavage products of acetildenafil, (b) Compound X. | |
Table 2 Nuclear magnetic resonance data for compound X and acetildenafil from ref. [5] (numbering refers to Fig. 6)
| Position No. |
Compound X Proton (ppm) |
Acetildenafil Proton (ppm) |
| 1 |
— |
— |
| 2 |
— |
— |
| 3 |
— |
— |
| 4 |
— |
— |
| 5 |
12.13 (1H, s) |
10.8 (1H, br, s) |
| 6 |
— |
— |
| 7 |
— |
— |
| 8 |
— |
— |
| 9 |
— |
— |
| 10 |
4.16 (3H, s) |
4.27 (3H, s) |
| 11 |
2.78 (2H, t, J = 7.5 Hz) |
2.94 (2H, t, J = 7.5 Hz) |
| 12 |
1.65–1.78 (2H, m, J = 7.4 Hz) |
1.87 (2H, m, J = 7.5 Hz) |
| 13 |
0.93 (3H, t, J = 7.4 Hz) |
1.08 (3H, t, J = 7.4 Hz) |
| 14 |
— |
— |
| 15 |
8.12 (1H, d, J = 2.3 Hz) |
9.14 (1H, d, J = 2.2 Hz) |
| 16 |
— |
— |
| 17 |
8.04 (1H, dd, J = 8.7, 2.3 Hz) |
8.15 (1H, dd, J = 8.8, 2.4 Hz) |
| 18 |
7.24 (1H, d, J = 8.8 Hz) |
7.09 (1H, d, J = 9.0 Hz) |
| 19 |
— |
— |
| 20 |
4.17 (2H, q, J = 6.9 Hz) |
4.36 (2H, q, J = 7.0 Hz) |
| 21 |
1.33 (3H, t, J = 7.1 Hz) |
1.63 (3H, t, J = 7.0 Hz) |
| 22 |
— |
— |
| 31 |
12.89 (1H, br, s) |
3.82 (2H, s) |
| 24, 28 |
— |
2.68 (4H, br, m) |
| 25,27 |
— |
2.54 (4H, br, m) |
| 29 |
— |
2.41 (2H, q, J = 7.3 Hz) |
| 30 |
— |
1.05 (3H, t, J = 7.0 Hz) |
Proposed fragmentation scheme of sildenafil, vardenafil and acetildenafil in ESI −ve mode
The proposed fragmentation scheme of sildenafil, vardenafil and acetildenafil under the experimental conditions are illustrated in Fig. 8. The common fragments with m/z 282 are thought to have a general elemental formula of [C15H14N4O2]−. The formation is assumed to be resulted from a neutral loss of ethylene (−28) from the [M − H]− pseudomolecular ion followed by an radical fragmentation of the even electron ion. Such homolytic bond cleavage and formation of radical fragment ions have been reported15 and studied16 in detail for compounds with sulfonamide moiety. To verify the molecular formula of the fragments resulting from the proposed fragmentation scheme, UPLC-TOF with in-source collision induced dissociation was used to measure the accurate mass of the fragment ions produced by sildenafil, vardenafil and acetildenafil under ESI −ve mode and the results are shown in Fig. S3 (ESI).† With the aperture voltage of 75 V to promote in-source CID, fragmentation of the drugs are similar to those observed in the MS2 spectra produced by quadruple tandem mass spectrometer. As shown Table 3, the accurate mass determined experimentally agreed with the accurate mass calculated from the molecular formula of the ions produced under the proposed fragmentation scheme.
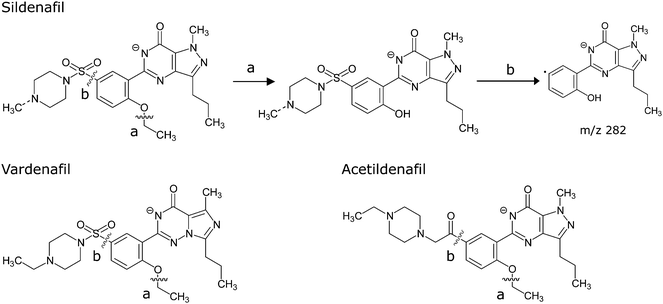 |
| | Fig. 8 Proposed fragmentation of sildenafil, vardenafil and acetildenafil. (a) Neutral loss of ethylene. (b) Homolytic bond cleavage and formation of radical fragment ions. | |
Table 3 Summary of accurate mass information of sildenafil, vardenafil, acetildenafil and their fragment ions
| Drugs |
Elemental composition |
Calculated monoisotopic mass |
Measured mass |
Mass accuracy (ppm) |
| Sildenafil |
C22H30N6O4S |
474.2049 |
|
|
| [M − H]− |
C22H29N6O4S |
473.1971 |
473.1958 |
−2.75 |
| [M − H]− after loss of C2H4 |
C20H25N6O4S |
445.1658 |
445.1654 |
−0.90 |
| [M − H]− after homolytic cleavage |
C15H14N4O2 |
282.1117 |
282.1108 |
−3.11 |
| Vardenafil |
C23H32N6O4S |
488.2206 |
|
|
| [M − H]− |
C23H31N6O4S |
487.2127 |
487.2100 |
−5.64 |
| [M − H]− after loss of C2H4 |
C21H27N6O4S |
459.1814 |
459.1797 |
−3.81 |
| [M − H]− after homolytic cleavage |
C15H14N4O2 |
282.1117 |
282.1103 |
−4.88 |
| Acetildenafil |
C25H34N6O3 |
466.2692 |
|
|
| [M − H]− |
C25H33N6O3 |
465.2614 |
465.2621 |
1.47 |
| [M − H]− after loss of C2H4 |
C23H29N6O3 |
437.2301 |
437.2316 |
3.40 |
| [M − H]− after homolytic cleavage |
C15H14N4O2 |
282.1117 |
282.1111 |
−2.04 |
Experimental
Materials
Standards - Sildenafil citrate and vardenafil hydrochloride reference standard were obtained from Pfizer and Bayer respectively. Samples of noracetildenafil, homosildenafil, hydroxyacetildenafil, hydroxyhomosildenafil, piperidino sildenafil and piperidino vardenafil were obtained from supplier on the internet whereas samples of acetildenafil were isolated and purified in our laboratory from adulterated product. All analogues were characterized by LC-MS/MS and IR and compared with literature data. NMR was used to verify the identity of the analogue purified from sample.
Reagents – Acetonitrile, HPLC grade, was purchased from Lab-Scan. Deionised water was prepared by Millipore system. 10 mM ammonium formate solution was prepared by dissolving 630 mg of ammonium formate (Alfa Aesar) in 1 L of deionised water. Diluent was prepared by mixing 500 mL of 10 mM ammonium formate solution with 500 mL acetonitrile.
Standard preparation
Stock standard solution of sildenafil, vardenafil and their analogues were prepared by dissolving about 10 mg of individual reference material in 10 mL diluent to obtain 1000 mg L−1 standard stock solutions. Individual stock standard solutions were further diluted to obtain standard solutions for the optimization of the tandem mass spectrometer and for accurate mass measurement in UPLC-TOF analysis. Two working standard mixtures were prepared for method performance evaluation and for routine analysis. Working standard mixture 1 contained sildenafil, homosildenafil, hydroxyhomosildenafil, noracetildenafil and piperidino vardenafil. Working standard mixture 2 contained vardenafil, piperidino sildenafil, acetildenafil and hydroxyacetildenafil. Acetildenafil and its analogues should be protected from light.
0.1 g sample was extracted (vortex and sonication) in 10 mL diluent and was further diluted 100 to 1000 times. The resulting sample solution was filtered through 0.45 μm Teflon filter before LC-MS/MS analysis.
Instrumentation
HPLC-MS/MS (Agilent 1100 series HPLC connected to Applied Biosystems 4000 Qtrap™ Triple Quadrupole Linear Ion Trap mass spectrometer operated in electrospray −ve mode) was used for the development of the screening method for the detection of drugs and drug analogues. Separation was carried out with Phenomenex Luna 5 μm C18 reversed-phase column (150 mm × 2 mm I.D). Column temperature was set at 25 °C throughout all runs. Gradient elution was performed by the use of 10 mM ammonium formate (Solvent A) and acetonitrile (Solvent B), ramped linearly from 40 to 80% of solvent B in 20 min and then back to 40% of solvent B in 5 min. The system was equilibrated for 5 min before each injection. Flow rate of the mobile phase was set at 200 μL min−1. The injection volume was 10 μL. The MS parameters were: declustering potential, −110 V; entrance potential, −10 V; curtain gas, 10 psi; ion spray voltage, −4.5 kV; source temperature, 500 °C; ion source gas 1, 50 psi; ion source gas 2, 50 psi. Precursor ion scan mode: Q1 (300 to 600)/Q3 (282.0); enhanced product ion scan mode: Q1 (fixied)/Q3 (50 to 600); collision energy 50 eV; collision gas medium; collision cell exit potential −5 V.
UPLC-TOFMS (Water Aquity UPLC connected to Waters LCT Premier orthogonal accelerated time of flight mass spectrometer operated in electrospray −ve mode) was used to verify the proposed fragmentation by measuring the accurate mass of the MS2 fragments produced by in-source collision induced dissociation. Isocratic elution was performed by the use of 50% acetonitrile and 50% water at 200 μL min−1 on a Waters 1.7 μm BEH C18 Column (100 mm × 2.1 mm). The MS parameters were: scan range 100 to 1000 Da; capillary voltage, 2600 V; cone voltage, 50 V; aperture voltage, 75 V; source temperature, 120 °C; desolvation temperature, 250 °C; cone gas flow, 10 L h−1; and desolvation gas flow, 750 L h−1. The instrument was tuned to provide a resolution of 10,000 FWHM and mass accuracy was maintained by using infusion of lock mass reference solution.
NMR data of compound X dissolved in CHCl3-d1 and DMSO-d6 were recorded on a Bruker Advance III 400 MHz instrument.
Conclusion
A LC-MS/MS method for the detection of unknown drug analogues of sildenafil, vardenafil and acetildenafil was developed and has been successfully adopted for the screening of these drugs and their analogues presented in health supplements and Chinese herbal drugs. The precursor scan will detect the presence of drugs and drug analogues and the enhanced product ion scan will reveal the m/z of the parent ions and theirs fragment ions which will gave some insight into the unknown compound for further structure elucidation.
Acknowledgements
The authors are grateful to Dr T.L. Ting, the Government Chemist of the HKSAR, for his encouragement and kind support of this work.
References
- Q. Liang, J. Qu, G. Luo and Y. Wang, J. Pharm. Biomed. Anal., 2006, 40, 305–311 CrossRef CAS.
- M. J. Bogusz, H. Hassan, E. Al-Enazi, Z. Ibrahim and M. Al-Tufail, J. Pharm. Biomed. Anal., 2006, 41, 554–564 CrossRef.
-
Drug Monographs for sildenafil, vardenafil and tadalafil, Martindale, The Complete Drug Reference, 35th edition, Pharmaceutical Press Search PubMed.
- S. R. Gratz, C. L. Flurer and K. A. Wolnik, J. Pharm. Biomed. Anal., 2004, 36, 525–533 CrossRef CAS.
- P. Blok-Tip, B. Zomer, F. Bakker, K. D. Hartog, M. Hamzink, J. T. Hove, M. Vredenbregt and D. de Kaste, Food Addit. Contam., Part A, 2004, 21, 737–748 Search PubMed.
- C. Shin, M. Hong, D. Kim and Y. Lim, Magn. Reson. Chem., 2004, 42, 1060–1062 CrossRef CAS.
- P. Zou, P. Hou, M. Y. Low and H. L. Koh, Food Addit. Contam., Part A, 2006, 23, 446–451 Search PubMed.
- J. C. Reepmeyer and J. T. Woodruff, J. Chromatogr., A, 2006, 1125, 67–75 CrossRef CAS.
- P. Hou, P. Zou, M. Y. Low, E. Chan and H. L. Koh, Food Addit. Contam., Part A, 2006, 23, 870–875 Search PubMed.
- R. G. Samuel, M. G. Bryan and A. F. Rick, Rapid Commun. Mass Spectrom., 2006, 20, 3317–3327.
- S. F. Campbell, Clin. Sci., 2000, 99, 255–260 Search PubMed.
- P. Zou, S. S. Y. Oh, P. Hou, M. Y. Low and H. L. Koh, J. Chromatogr., A, 2006, 1104, 113–122 CrossRef CAS.
- S. Singh, B. Prasad, A. A. Savaliya, R. P. Shah, V. M. Gohil and A. Kaur, TrAC, 2009, 28, 13–28 Search PubMed.
- J. C. Reepmeyer and J. T. Woodruff, J. Pharm. Biomed. Anal., 2007, 44, 887–893 CrossRef CAS.
- G. Hopfgartner, W. Vetter, W. Meister and H. Ramuz, J. Mass Spectrom., 1996, 31, 69–76 CrossRef CAS.
-
mailto:http://www.thermo.com/eThermo/CMA/PDFs/Articles/articlesFile_3142.pdf (accessed on 6/7/2009).
Footnote |
| † Electronic supplementary information (ESI) available: Fig. S1–S3. See DOI: 10.1039/b9ay00112c |
|
| This journal is © The Royal Society of Chemistry 2010 |
Click here to see how this site uses Cookies. View our privacy policy here.