DOI:
10.1039/B915622D
(Paper)
Analyst, 2010,
135, 111-115
BSA activated CdTe quantum dot nanosensor for antimony ion detection
Received
30th July 2009
, Accepted 28th October 2009
First published on
6th November 2009
Abstract
A novel fluorescent nanosensor for Sb3+ determination was reported based on thioglycolic acid (TGA)-capped CdTe quantum dot (QD) nanoparticles. It was the first antimony ion sensor using QD nanoparticles in a receptor-fluorophore system. The water-soluable TGA-capped CdTe QDs were prepared through a hydrothermal route, NaHTe was used as the Te precursor for CdTe QDs synthesis. Bovine serum albumin (BSA) conjugated to TGA-capped CdTe via an amide link interacting with carboxyl of the TGA-capped CdTe. When antimony ion enters the BSA, the lone pair electrons of the nitrogen and oxygen atom become involved in the coordination, switching off the QD emission and a dramatic quenching of the fluorescence intensity results, allowing the detection of low concentrations of antimony ions. Using the operating principle, the antimony ion sensor based on QD nanoparticles showed a very good linearity in the range 0.10–22.0 μg L−1, with the detection limit lower than 2.94 × 10⁻⁸ g L−1 and the relative standard deviation (RSD) 2.54% (n = 6). In a study of interferences, the antimony-sensitive TGA-QD-BSA sensor showed good selectivity. Therefore, a simple, fast, sensitive, and highly selective assay for antimony has been built. The presented method has been applied successfully to the determination of antimony in real water samples (n = 6) with satisfactory results.
Introduction
Antimony is a naturally occurring element. The upper limit1 of antimony in domestic water is 0.005 mg L−1, and heavy metal poisoning may be caused if excess amounts of antimony are inhaled. Therefore, it is necessary to establish sensitive and accurate analytical methods for quantitative determination of antimony. Various methods have been reported for the determination of antimony in water. These methods include hydride/vapor generation atomic fluorescence spectrometry,1–3 inductively coupled plasma atomic emission spectrometry,4 polarography,5 anodic stripping voltammetry,6,7 inductively coupled plasma mass spectrometry (ICP-MS),8 and spectrophotometry.9 However, they often suffer from a variety of limitations: spectrophotometry has low sensitivity; interference by coexisting ions could only be eliminated by controlling sample number in polarography and the other methods call for expensive instruments and long analysis times.
Compared with traditional fluorogenic dyes, quantum dots (QDs) have unique optical properties such as photostability, broad excitation spectra, and narrow, symmetric and tunable emission spectra.10–14 In the past 2 decades, QDs have emerged as an important photonic tool in various fluorescent probes for biomolecule detection.15–20 In addition, significant progress has been made recently on the synthesis of high-quality water-soluble QDs by either refluxing or the hydrothermal route, which further expands their application scope in sensor development.21–24
Many of the fluorescent ions-sensors that have been reported in the past are based on the linking of a receptor or ligand to a fluorophore with quenching of the fluorophore by photoinduced electron transfer (PET).25,26 Although some chemical sensing systems based on semiconductor nanoparticle, quantum dots have been conceived, based on direct adsorption of metal on the surface of QDs or the interactions of metal with capped QDs to form complex,27–30 the direct analogy with the classical PET fluorophore-ligand has not been reported for antimony. Molecular and ion recognition has been combined very recently with the unique optical properties of QDs to begin building a new generation of QD-based sensors where induced interactions with the QD surface, which can influence the core electron-hole recombination, can alter the luminescence properties of QD nanoparticles.
We set out to design a novel sensor of antimony selective nanosensors based on BSA, which also might have relevance in conjunction with drug therapy in the future designs for theranostics. The antimony nanosensor discussed herein is thus based on a BSA-fluorophore system, where the fluorophore is a TGA-capped CdTe nanoparticle.
Experimental section
Apparatus
Fluorescence measurements were performed on a LS-55 spectrofluorimeter with 1.0 cm quartz cell (Perkin-Elmer, USA). The pH measurements were made by using a PT-10 digital pH-meter (sartorius, Germany) with a combined glass-calomel electrode. Doubly distilled water was obtained by SYZ-550 quartz sub-boil high-purified water distiller (Jiang Su Jin Tan, Jiang Su, China).
Materials and reagents
All experiments were performed with reagents of analytical reagent grade, pure solvents and doubly distilled water (used for the dilution of samples and reagents). Tellurium (reagent powder, 99.999%), thioglycolic acid (TGA), bovine serum albumin (BSA) were purchased from Kemiou (Tianjin, China); CdCl2·2H2O and sodium borohydride were purchased from Shanghai Chemical Reagent Company (Shanghai, China); HCl, NaOH, potassium hydrogen phthalate and citric acid was obtained from Aladdin (Shanghai, China); stock solutions of BSA were prepared by directly dissolving commercial BSA in double distilled water at 0–4 °C. A 1.0 mg mL−1 stock solution of antimony was prepared by dissolving accurately 1.0000 g of antimony (Aladdin, Shang Hai, China) with 20 mL of sulfuric acid (Vsulfuric acid: Vwater = 1![[thin space (1/6-em)]](https://www.rsc.org/images/entities/char_2009.gif) :
:![[thin space (1/6-em)]](https://www.rsc.org/images/entities/char_2009.gif) 4) and then diluting to 1000 mL with water, 1-ethyl-3-(3-(dimethylaminp)propyl)carbodiimide hydrochloride (EDC) and N-hydroxysuccinimide (NHS) were purchased from Sigma-Aldrich.
NaHTe was used as the Te precursor for CdTe QD synthesis. It was prepared on the basis of a procedure described elsewhere31 with slight modifications. Briefly, 0.0287 g of Te powder was mixed with 0.0170 g of NaBH4 in a round bottle fitted with a septum and connected to the vacuum line. The molar ratio of NaBH4/Te was 2
4) and then diluting to 1000 mL with water, 1-ethyl-3-(3-(dimethylaminp)propyl)carbodiimide hydrochloride (EDC) and N-hydroxysuccinimide (NHS) were purchased from Sigma-Aldrich.
NaHTe was used as the Te precursor for CdTe QD synthesis. It was prepared on the basis of a procedure described elsewhere31 with slight modifications. Briefly, 0.0287 g of Te powder was mixed with 0.0170 g of NaBH4 in a round bottle fitted with a septum and connected to the vacuum line. The molar ratio of NaBH4/Te was 2![[thin space (1/6-em)]](https://www.rsc.org/images/entities/char_2009.gif) :
:![[thin space (1/6-em)]](https://www.rsc.org/images/entities/char_2009.gif) 1. The reaction was operated under nitrogen flow at 60 °C water bathing with magnetic stirring for about 20 min. The reaction was completed when the black Te powder was transformed to white sodium tetraborate precipitation. A total of 22.5 mL of N2-saturated water was added to form a clear 0.01 mol L−1 NaHTe solution.
1. The reaction was operated under nitrogen flow at 60 °C water bathing with magnetic stirring for about 20 min. The reaction was completed when the black Te powder was transformed to white sodium tetraborate precipitation. A total of 22.5 mL of N2-saturated water was added to form a clear 0.01 mol L−1 NaHTe solution.
Preparation of TGA-coated CdTe QDs
We synthesized water-soluble TGA-capped CdTe QDs via the hydrothermal route. The CdTe QDs prepared through the reaction between Cd and NaHTe solution according to the literature.32 Briefly, freshly prepared NaHTe solution was added into the N2-saturated CdCl2 solution (pH = 11) in the presence of TGA as the stabilizing agent. The molar ratio of Cd/Te/TGA was fixed at 1![[thin space (1/6-em)]](https://www.rsc.org/images/entities/char_2009.gif) :
:![[thin space (1/6-em)]](https://www.rsc.org/images/entities/char_2009.gif) 0.5
0.5![[thin space (1/6-em)]](https://www.rsc.org/images/entities/char_2009.gif) :
:![[thin space (1/6-em)]](https://www.rsc.org/images/entities/char_2009.gif) 2.4. Finally, the solution was then heated and refluxed under nitrogen flow at 100 °C. Sample was collected at 1 h. Fig. 1 shows the TEM image (The TEM images were recorded by a scanning electron microscope (TEM-2010, Japan)) of TGA-capped CdTe QDs, and TGA-capped CdTe is monodisperse and well-isolated.
2.4. Finally, the solution was then heated and refluxed under nitrogen flow at 100 °C. Sample was collected at 1 h. Fig. 1 shows the TEM image (The TEM images were recorded by a scanning electron microscope (TEM-2010, Japan)) of TGA-capped CdTe QDs, and TGA-capped CdTe is monodisperse and well-isolated.
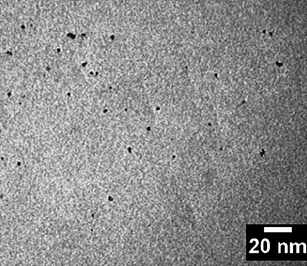 |
| | Fig. 1 TEM of TGA-capped CdTe. | |
Results and discussions
BSA as a luminescent strengthening agent to CdTe QDs
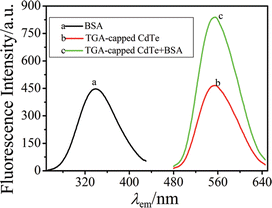
BSA was used as a luminescent strengthening agent to CdTe QDs, CdTe cannot directly connect with BSA, TGA-capped CdTe may connect with BSA via covalent bond interaction. In PBS of pH 7.0, TGA-capped CdTe formed a stable linkage with BSA. Excitation wavelength and mission wavelength of this system was λex/λem = 336 nm/555 nm. It was observed that the fluorescence intensity increased with increasing the amount of BSA (Fig. 2). Under the optimum experimental conditions, a good linear relationship between the fluorescence intensity and BSA concentration was found.
Preparation of TGA-QD- BSA nanosensor
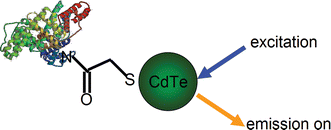
BSA has amino groups available for the conjugation with carboxylic acid group capping QD nanoparticles (Fig. 3) via amide formation, using the EDC/NHS coupling reaction.33 The method has been used previously for QD modification,34 achieving stable and water-soluble conjugates. The emission was “switched on” when the excitation light irradiated the TGA-QD-BSA conjugates (Fig. 3).
The QD-TGA-BSA conjugate was prepared by mixing 1.0 mL of TGA-capped QDs, 0.5 mL of EDC solution in PBS pH 6.5, and 0.5 mL of NHS solution in PBS pH 6.5. After 5 min, 4.0 mL of a BSA solution of 20.0 μg mL−1 in PBS pH 6.5 was added. The mixture was stirred for 30 min at room temperature.
Stability of TGA-QD-BSA sensor
To study the stability of the sensor, the TGA-QD-BSA sensors were monitored using repeated measurements for shelf life by keeping the sensor solution at 4 °C. The results were shown in Fig. 4. The sensor response was fairly stable even after 80 days with a low deviation of 5%, which indicated that TGA-QD-BSA sensor did not self-aggregate. TGA-QD-BSA sensors were found to maintain 70–80% activity even after 100 days. The TGA-QD-BSA sensor was found to retain 54% of their activity after storing the solution for 150 days.
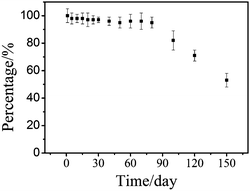 |
| | Fig. 4 Stability of TGA-QD-BSA sensor. | |
Repeatability of different fabrication series
To examine the repeatability of the formation of different fabrication series TGA-QD-BSA nanosensor, repeatability of the TGA-QD-BSA was checked and established for 11 independent analyses (Fig. 5). The 1.0 mL aliquots of TGA-QD-BSA solution (1.0 × 10⁻⁴ mol L−1) conjugate, acting as Sb3+ nanosensor, was exposed to 11 aliquots of 0 μg L−1 and 22.0 μg L−1 Sb3+ solutions buffered with 50.0 mmol L−1 PBS buffer solution at pH 6.5. The relative standard deviation of the response of the QD-based nanosensors was 4.51% and 3.28% respectively, indicating very good repeatability.
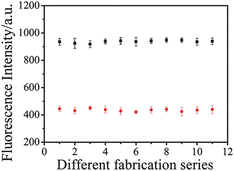 |
| | Fig. 5 Repeatability of different fabrication series. TGA-QD-BSA-antimony (0 μg L−1) (■), TGA-QD-BSA-antimony (22.0 μg L−1) (●). | |
Spectrofluoremetric measurement of QD-BSA/Sb3+ conjugates
Emission spectrum was measured using a LS-55 fluorescence spectrofluorometer (American). Instrument excitation and emission slits were set both at 10, and the scan rate of monochromators was 1000 nm min−1. All samples were illuminated at an excitation wavelength of 336 nm and the emission spectrum was scanned from 480 nm to 640 nm.
Metal complexes have long been used as an effective quencher for luminescent organic and polymeric materials. For the determination of antimony ions, 1.0 mL of prepared TGA-QD-BSA solution (1.0 × 10⁻⁴ mol L−1) was put into a 10 mL colour comparison tube, followed by 1.50 mL PBS buffer solution (pH 6.5) and sets of standard antimony solution or the sample solution were put into a 10 mL colour comparison tube, diluted to the scale. Solutions were placed for 5 min again, then it were placed in a quartz microcell, emission intensity was measured as a function of antimony concentration at the λex/λem = 336 nm/555 nm. Spectrum was recorded in Fig. 6.
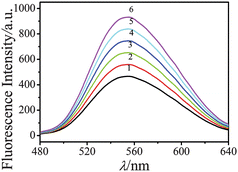 |
| | Fig. 6 Emission spectra after addition of different concentration of antimony. 1. 22.0 μg L−1, 2. 18.0 μg L−1, 3. 14.0 μg L−1, 4. 10.0 μg L−1, 5. 6.0 μg L−1, 6. 2.0 μg L−1. | |
The Spectrum of the TGA-QD-BSA nanosensor emission after adding antimony was presented in Fig. 6. A quenching at the 555 nm peak can be observed after adding antimony. The kinetics of emission in the presence of varying concentrations of antimony was also monitored (Fig. 7). Antimony was added the time point of 180 s, and immediate emission quenching was observed. Higher antimony concentration induced faster emission quenching, and the emission intensity at 5 min after adding antimony was used for quantification.
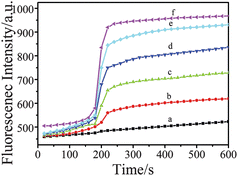 |
| | Fig. 7 Kinetics of fluorescence quenching at 555 nm with varying antimony concentration. a. 22.0 μg L−1, b. 18.0 μg L−1, c. 14.0 μg L−1, d. 10.0 μg L−1, e. 6.0 μg L−1, f. 2.0 μg L−1. | |
Effect of pH and buffer medium
The buffer solution could have great effects on the fluorescence intensity. The experimental results showed that the optimal pH which led to high fluorescence intensities was 6.5. Effect of buffer solutions, such as KH2PO4–Na2HPO4 (PBS), potassium hydrogen phthalate–sodium hydroxide, acetic acid–sodium acetate, disodium hydrogen phosphate–citric acid and tartaric acid–sodium tartrate were studied. KH2PO4–Na2HPO4 (PBS) was found to be the best buffer solution medium. In addition, it was observed that the fluorescence intensity increased with increasing the amount of the buffer solution. All measurements should be conducted in PBS buffer solution of pH 6.5 buffer in order to obtain stable and strong fluorescence from QDs. This is predicted: at low pH, H+ could protonate the amine nitrogen atoms of the BSA covalently linked to the QDs. The response toward antimony at pH higher than 7.2 was not tested, since antimony formed a precipitate under these conditions in buffer solution.
TGA-QD/BSA/antimony interaction
The proposed antimony ion sensing QDs were based on TGA-capped CdTe QDs with BSA as antimony conjugates. BSA had amino groups available for the conjugation with carboxylic acid group capping QD nanoparticles. BSA can be coupled to TGA-capped QDs through an amide linkage and offers opportunity for N to QD charger-transfer. If in the absence of antimony, the valence band of the QD is at higher energy than a molecular orbital on the ligand, the rich electron of BSA would transfer to the QDs, resulted to the enhancement intensity of QD. If the molecular orbital implicated is also involved in antimony binding, then in presence of antimony, the energy level is no longer available and electron migration cannot occur. The implications of this are that the QD fluorescence is quenched in the presence of antimony (Fig. 8).
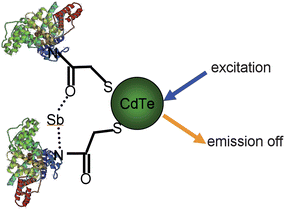 |
| | Fig. 8 TGA-CdTe-BSA-Sb quenching mechanism. | |
Analytical performance
According to the discussion above, we can know a response for the TGA-QD-BSA in the presence of antimony. Under the optimized options and procedure described above, the sensitivity and precision were evaluated for the determination of antimony by the TGA-QD-BSA nanosensor. A good linearity (Fig. 9) between the ΔI and the concentration of antimony was observed in the range of 0.10∼22.0 μg L−1 with a correlation coefficient of 0.9984. The linear regression equation was ΔI = 11.08 + 16.88 × ρ(μg L−1). The relative standard deviation (RSD) of the response of these TGA-QD-BSA nanosensor (1.0 × 10⁻⁵ mol L−1 TGA-QD-BSA and 0 μg L−1 Sb3+ solution buffered with 50.0 mmol L−1 PBS buffer solution at pH 6.5) was 2.54% (n = 6) indicating very good repeatability. The detection limit was 2.94 × 10⁻⁸ g L−1, estimated as the concentration of analyte that produced an analytical signal equal to three times the standard deviation of the background fluorescence.
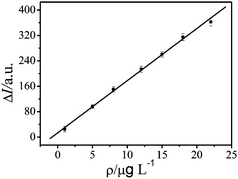 |
| | Fig. 9 Calibration line towards antimony ions. | |
Selectivity of the proposed TGA-QD-BSA sensor
The fluorescent response of TGA-QD-BSA conjugate in the presence of various metal cations was evaluated in order to check the selectivity of the proposed antimony nanosensors. The interference effect of foreign ions was investigated. It was decided not to interfere if a foreign species caused a relative error of less than ±5% during the determination standard antimony sample with a theoretical concentration of 12.0 μg L−1. It was observed that SO42−, NO3−, Cl−, F−, K+, Na+ and NH4+ did not give rise to any changes in the emission of the TGA-QD-BSA conjugates even at quite high concentrations. These results are presumably due to poor complexation of these ions with BSA that do not change the quenching of the QD. The selectivity of the TGA-QD-BSA conjugates towards antimony ions depends on the charge and radius of the metal cation. Table 1 shows a summary of the highest metal cation concentration tested with no effect in the emission of QDs.
Table 1 Study of interferences for TGA-QD-BSA sensora
| Foreign species |
Concentration/× 103μg L−1 |
Foreign species |
Concentration/× 103μg L−1 |
|
Highest concentration of metal tested without effect in TGA-QD-BSA-Sb3+ luminescence (PBS 6.5).
|
| Fe3+ |
1.2 |
Sn4+ |
1.2 |
| Ca2+ |
6.0 |
Co2+ |
2.4 |
| Al3+ |
6.0 |
Cu2+ |
2.4 |
| Ba2+ |
2.4 |
Ni2+ |
0.6 |
| Zn2+ |
6.0 |
Mn2+ |
6.0 |
| Hg2+ |
3.6 |
Pb2+ |
0.6 |
| Ag+ |
6.0 |
V5+ |
2.4 |
| As3+ |
1.2 |
Bi3+ |
1.2 |
| Cd2+ |
1.2 |
Zr4+ |
6.0 |
| Cr3+ |
6.0 |
TI3+ |
1.2 |
Applications in real samples
To assess the utility of the antimony-sensitive TGA-QD-BSA nanoparticles, they were applied to the determination of antimony in real samples.
10 mL of water from artificial pond, spring water and sewage in residential area in university of Jinan was taken respectively, then 2.0 mL of aluminium hydroxide suspension was added into it. 1.0 mL of 6.0 mol L−1 sulfuric acid and 1.5 mL of 10% sodium sulfite were added into the filtrate, after that the solution was placed in boiling water bath for 18 min, by which way the Sb5+ can be reduced to Sb3+ for determination. This intermixture was mixed well and then filtrated. The solution was diluted to 100 mL with water after it was cooled down. Solution above was regarded as the water sample solution. Atomic fluorescence spectrometry was taken to determine the arsenic ion and mercury ion and the determination result showed that in the water sample the two kinds of ions did not exist.
In order to evaluate the applicability and reliability of the proposed method, antimony in three samples was determined. The results obtained were in agreement with that obtained by the official method3—atomic fluorescence spectrometry (Table 2). The determination results and recovery tests were shown in Table 2. As we can conclude from Table 2 that the recoveries of added antimony can be quantitative and t-tests assumes there was no significant differences between this proposed method and official method at confidence level of 95%.
Table 2 Determination of samples and result of recovery
| Water sample |
Found ± SDa/μg L−1 |
RSD (%) |
Added/μg L−1 |
Recovered/μg L−1 |
Recovery (%) |
Official method ± SDa/μg L−1 |
|
Average of six determinations ± standard deviation.
|
| artificial pond |
0.315 ± 0.013 |
4.12 |
3.00 |
3.13 |
104.3 |
0.308 ± 0.010 |
| spring water |
0.219 ± 0.007 |
3.20 |
5.00 |
5.17 |
103.4 |
0.224 ± 0.005 |
| sewage |
0.648 ± 0.018 |
2.63 |
10.00 |
9.76 |
97.6 |
0.685 ± 0.015 |
Conclusions
A simple, sensitive, selective and fast QD-based BSA sensing ensemble was developed for the detection of antimony. To the best of our knowledge, this was the first report of QD assisted detection of antimony. We have demonstrated that a novel type antimony ion nanosensor can be prepared by the covalent linking of BSA on the surface of TGA-capped QD nanoparticles by EDC/NHS coupling reaction. The system showed very high sensitivity and also high selectivity towards antimony ions. Interferences caused by metal ions to the detection were minimal. Furthermore, the present sensor was highly photostable compared to traditional fluorescent organic dye-based sensor.
Acknowledgements
This work was financially supported by Natural Science Research Foundation of China (No. 50972050), Science Research Foundation of University of Jinan, China (XKY0817), Science Research Foundation of Shandong Province, China (Y2007B07), National Eleventh Five-Year Plan, China (2006BAJ03A09) and Postgraduate Innovation Program of Shandong Province (SDYY08030).
References
- Z. Li, X. Yang, Y. Guo, H. Li and Y. Feng, Talanta, 2008, 74, 915 CAS.
- M. Chen, A. Zou, Y. Yu and R. He, Talanta, 2007, 73, 599 CrossRef CAS.
- P. Cava-Montesinos, M. Luisa Cervera, A. Pastor and M. de la Guardia, Talanta, 2003, 60, 787 CrossRef CAS.
- A. Lopez-Molinero, Y. Echegoyen, D. Sipiera and J. R. Castillo, Talanta, 2005, 66, 863 CrossRef CAS.
- Z. He, Chin. J. Anal. Lab., 2003, 22, 70 Search PubMed.
- J. Xia and G. Yan, Chin. J. Anal. Lab., 2004, 23, 13 Search PubMed.
- O. Domìnguezi Renedo and M. Julia Arcos Martìnez, Electrochem. Commun., 2007, 9, 820 CrossRef.
- X. Wen, J. Song, Y. Tan, B. Zhang and J. Deng, Chin. J. Environ. Monit. China., 2005, 21, 22 Search PubMed.
- A. Abbaspour and L. Baramakeh, Talanta, 2005, 65, 692 CrossRef CAS.
- X. Michalet, F. F. Pinaud, L. A. Bentolila, J. M. Tsay, S. Doose, J. J. Li, G. Sundaresan, A. M. Wu, S. S. Gambhir and S. Weiss, Science, 2005, 307, 538 CrossRef CAS.
- P. Davide Cozzoli, Andreas Kornowski and Horst Weller, J. Am. Chem. Soc., 2003, 125, 14539 CrossRef CAS.
- S. Pathak, M. C. Davidson and G. A. Silva, Nano Lett., 2007, 7, 1839 CrossRef CAS.
- W. Yu William, C. Emmanuel, C. Falkner Joshua, Z. Junyan, M. Ali, A. Somali, M. Christie Sayes, J. Judah, D. Rebekah and L. Vicki Colvin, J. Am. Chem. Soc., 2007, 129, 2871 CrossRef CAS.
- S. Sapra, S. Mayilo, T. A. Klar, A. L. Rogach and J. Feldmann, Adv. Mater., 2007, 19, 569 CrossRef CAS.
- S. Emir Diltemiz, R. Say, S. Büyüktiryaki, D. Hür, A. Denizli and A. Ersoz, Talanta, 2008, 75, 890 CrossRef.
- G. H. Yu, J. G. Liang, Z. K. He and M. X. Sun, Chem. Biol., 2006, 13, 723 CrossRef CAS.
- Q. Lu, S. S. Hu, D. W. Pang and Z. K. He, Chem. Commun., 2005,(20), 2584 RSC.
- Y. X. Xu, J. G. Liang, C. G. Hu, W. Fang, S. S. Hu and Z. K. He, JBIC, J. Biol. Inorg. Chem., 2007, 12, 421 CrossRef CAS.
- V. Biju, D. Muraleedharan, K. Nakayama, Y. Shinohara, T. Itoh, Y. Baba and M. Ishikawa, Langmuir, 2007, 23, 10254 CrossRef CAS.
- J. Liu, J. Lee and Y. Lu, Anal. Chem., 2007, 79, 4120 CrossRef CAS.
- H. Zhang, L. Wang, H. Xiong, L. Hu, B. Yang and W. Li, Adv. Mater., 2003, 15, 1712 CrossRef CAS.
- N. Gaponic, D. V. Talapin, A. L. Rogach, K. Hoppe, E. V. Shevchenko, A. Kornowski, A. Eychmuller and H. Weller, J. Phys. Chem. B, 2002, 106, 7177 CrossRef CAS.
- H. Zhang, Z. Zhou, B. Yang and M. Y. Gao, J. Phys. Chem. B, 2003, 107, 8 CrossRef CAS.
- B. Hiroyuki Tetsuka, T. Ebina and F. Mizukami, Adv. Mater., 2008, 20, 3039 CrossRef CAS.
- D. Zhao, W. H. Chan, Z. He and T. Qiu, Anal. Chem., 2009, 81, 3537 CrossRef CAS.
- L. Shi, V. De Paoli, N. Rosenzweig and Z. Rosenzweig, J. Am. Chem. Soc., 2006, 128, 10378 CrossRef CAS.
- J. Chen, A. Zheng, Y. Gao, C. He, G. Wu, Y. Chen, X. Kai and C. Zhu, Spectrochim. Acta, Part A, 2008, 69, 1044 CrossRef.
- Y. Zhang, H. Zhang, X. Guo and H. Wang, Microchem. J., 2008, 89, 142 CrossRef CAS.
- Y. Chen and Z. Rosenzweig, Anal. Chem., 2002, 74, 5132 CrossRef CAS.
- M. Jose Ruedas-Rama and A. H. Elizabeth Hall, Anal. Chem., 2008, 80, 8260 CrossRef CAS.
- Y. Kuo, Q. Wang, C. Ruengruglikit, H. Yu and Q. Huang, J. Phys. Chem. C, 2008, 112, 4818 CrossRef CAS.
- F. Patolsky, R. Gill, Y. Weizmann, U. Banin and I. Willner, J. Am. Chem. Soc., 2003, 125, 13918 CrossRef CAS.
-
G. T. Hermanson, Bioconjugate Techniques, Academic Press: New York, 1996 Search PubMed.
- E. L. Bentzen, I. D. Tomlinson, J. Mason, P. Gresch, M. R. Warnement, D. Wright, E. Sanders-Bush, R. Blakely and S. Rosenthal, Bioconjugate Chem., 2005, 16, 1488 CrossRef CAS.
|
| This journal is © The Royal Society of Chemistry 2010 |
Click here to see how this site uses Cookies. View our privacy policy here. ![[thin space (1/6-em)]](https://www.rsc.org/images/entities/char_2009.gif) :
:![[thin space (1/6-em)]](https://www.rsc.org/images/entities/char_2009.gif) 4) and then diluting to 1000 mL with water, 1-ethyl-3-(3-(dimethylaminp)propyl)carbodiimide hydrochloride (EDC) and N-hydroxysuccinimide (NHS) were purchased from Sigma-Aldrich.
4) and then diluting to 1000 mL with water, 1-ethyl-3-(3-(dimethylaminp)propyl)carbodiimide hydrochloride (EDC) and N-hydroxysuccinimide (NHS) were purchased from Sigma-Aldrich.
![[thin space (1/6-em)]](https://www.rsc.org/images/entities/char_2009.gif) :
:![[thin space (1/6-em)]](https://www.rsc.org/images/entities/char_2009.gif) 1. The reaction was operated under nitrogen flow at 60 °C water bathing with magnetic stirring for about 20 min. The reaction was completed when the black Te powder was transformed to white sodium tetraborate precipitation. A total of 22.5 mL of N2-saturated water was added to form a clear 0.01 mol L−1 NaHTe solution.
1. The reaction was operated under nitrogen flow at 60 °C water bathing with magnetic stirring for about 20 min. The reaction was completed when the black Te powder was transformed to white sodium tetraborate precipitation. A total of 22.5 mL of N2-saturated water was added to form a clear 0.01 mol L−1 NaHTe solution.
![[thin space (1/6-em)]](https://www.rsc.org/images/entities/char_2009.gif) :
:![[thin space (1/6-em)]](https://www.rsc.org/images/entities/char_2009.gif) 0.5
0.5![[thin space (1/6-em)]](https://www.rsc.org/images/entities/char_2009.gif) :
:![[thin space (1/6-em)]](https://www.rsc.org/images/entities/char_2009.gif) 2.4. Finally, the solution was then heated and refluxed under nitrogen flow at 100 °C. Sample was collected at 1 h. Fig. 1 shows the TEM image (The TEM images were recorded by a scanning electron microscope (TEM-2010, Japan)) of TGA-capped CdTe QDs, and TGA-capped CdTe is monodisperse and well-isolated.
2.4. Finally, the solution was then heated and refluxed under nitrogen flow at 100 °C. Sample was collected at 1 h. Fig. 1 shows the TEM image (The TEM images were recorded by a scanning electron microscope (TEM-2010, Japan)) of TGA-capped CdTe QDs, and TGA-capped CdTe is monodisperse and well-isolated.

