DOI:
10.1039/B9NR00151D
(Paper)
Nanoscale, 2009,
1, 366-373
N-Octyl-O-sulfate chitosan stabilises single wall carbon nanotubes in aqueous media and bestows biocompatibility†
Received
23rd June 2009
, Accepted 11th August 2009
First published on 18th September 2009
Abstract
A non-covalent approach to debundle single wall carbon nanotubes using a biocompatible chitosan-derivative, namely N-octyl-O-sulfate chitosan (NOSC), was investigated. The resulting stable dispersions were characterised by Raman spectroscopy, UV-Vis spectroscopy, atomic force microscopy (AFM), transmission electron microscopy (TEM) and ζ-potential measurements. Both AFM and TEM studies revealed the presence of individual carbon nanotubes wrapped with the polymer (diameters up to 7 nm). Raman spectra showed radial breathing mode frequency shifts, after the addition of NOSC, due to the wrapping of the biomolecules onto the graphitic sidewalls. Molecular modelling studies were employed to investigate the mode of binding of the NOSC chains to the surface of the nanotubes. In agreement with the experiments, modelling studies predicted that the wrapped tube has a maximum thickness of approximately 7 nm. Studies on the anticoagulant properties of these complexes revealed that NOSC coated SWCNTs exhibit similar activity to the polymer alone, this property would eliminate the risk for SWCNTs to induce coagulation as a host reaction process when used in vivo.
I Introduction
Carbon nanotubes are of significant interest due to their unique properties and applications.1 However, bundling and aggregation of individual nanotubes combined with poor solubility in aqueous media are the main obstacles to overcome before they can be further used for biomedical applications.2 Two general chemical approaches are widely employed for modification of the graphitic cylinders. The sidewalls or the defect sites can be covalently modified by various grafting reactions which give rise to more soluble nanotubes. Alternatively, the non-covalent adsorption or wrapping of various functional molecules results in the formation of supramolecular complexes and the fabrication of innovative systems.3 For non-covalent adsorption/wrapping, a variety of molecules including surfactants,4,5polymers,6 biomolecules,7 or phospholipids8 have so far been used. Recently, the biocompatible polymer, chitosan ((1 → 4)-2-amino-2-deoxy-β-D-glucan) and its derivatives were used to increase the dispersability of multi-wall carbon nanotubes9–11 and single wall carbon nanotubes12,13 respectively. Chitosan is a natural polysaccharide derived by N-deacetylation of chitin; it is considered as a biocompatible, biodegradable polymer and is widely used in the food industry14 and as a novel drug delivery platform for many routes of administration.15 Herein, we report the stabilisation of single wall carbon nanotubes (SWCNTs) with a chitosan derivative, namely, N-octyl-O-sulfate chitosan (NOSC). NOSC is a self-assembling, amphiphilic polymer, soluble over a wide range of pH; its safety evaluation in rodents has shown no acute toxicity; the LD50 values after i.v. and i.p. injections were found to be 102.59 and 130.53 mg/kg respectively, and no haemolysis was observed in vitro.16 These data suggest that NOSC is a potentially safe polymer to use for biomedical applications. Furthermore, because of its structural similarity to heparin, NOSC, as well as other sulfated polysaccharides, is expected to present anticoagulant activity (here tested for the first time), a property that could increase the blood compatibility of the wrapped SWCNTs17 and allow their use as biocompatible building blocks for nanodevices,18,19 including biosensors 20 and biomaterials.21 The activation of the coagulation cascade is one of the most common host-reactions observed in response to the introduction of a foreign body either in the blood circulation or in a tissue.22,23 By coating the SWCNTs with a polymer presenting anticoagulant activity, we aim at improving the blood compatibility of this nanomaterial, without inducing systemic anticoagulant activity. SWCNT stabilisation in water with NOSC is a simple and straightforward approach for the non-covalent functionalisation of nanotubes. The dispersions obtained were characterised by means of experimental and theoretical methods employing spectroscopy (UV-Vis and Raman), microscopy (atomic force microscopy, AFM and transmission electron microscopy, TEM), ζ-potential measurements and molecular modelling studies.
A. Materials
Low-viscosity chitosan (degree of deacetylation 80.1%), chlorosulfonic acid (HSO3Cl, >98%) and sodium hydroxide (NaOH, A.R.) were purchased from Fluka Biochemika (Poole, UK). Methanol (MeOH, HPLC) and dimethylformamide (DMF, L.R.) were provided by Fisher Scientific (Loughborough, UK). Octaldehyde (99% G.C.) was from Sigma-Aldrich (Pool, UK), whilst sodium borohydride (NaBH4, 98+%) was purchased from Acros Organics (Geel, Belgium). HipCOSWCNTs were obtained from Carbon Nanotechnology Inc. (CNI Grade/Lot#:P0332; Houston, TX USA). All solutions were prepared with Millipore water (conductivity < 0.5 µS cm−1).
B. Synthesis and characterisation of N-octyl-O-sulfate chitosan (NOSC)
N-Octyl-O-sulfate chitosan was synthesised as previously described24,25 (Fig. 1).
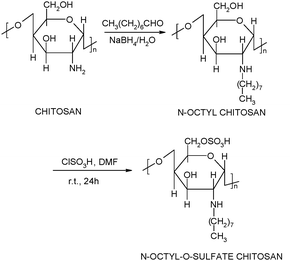 |
| | Fig. 1 Synthesis of N-octyl-O-sulfate chitosan. | |
Briefly, low-viscosity chitosan (1.00 g) was suspended in methanol (50 mL), and octaldehyde (1.02 g) was added to the suspension while stirring; the suspension obtained was stirred at room temperature for 24 h. An aqueous solution of NaBH4 (0.5 g in 5 mL) was slowly added to the reaction mixture and the resulting mixture was stirred at room temperature for further 24 h. The reaction was stopped by neutralisation with 2 M HCl. The product was filtered and repeatedly washed with methanol and water and finally dried under vacuum at 60 °C to constant weight (1.32 ± 0.02 g, n = 4). N-Octyl chitosan (1 g) was suspended in DMF (40 mL). Chlorosulfonic acid (20 mL) was added dropwise to 40 mL of DMF and the mixture stirred for 1 h at 0 °C. The N-octyl chitosan suspension was then added. The mixture was reacted at room temperature for 24 h. The reaction was stopped by neutralisation with 20% w/v NaOH, the obtained precipitate was filtered off and the filtrate was dialysed against distilled water for 3 days and then freeze dried (598.0 ± 16.1 mg, n = 3). NOSC was characterised by the following methods. 1H NMR spectra were obtained on a JEOL 400 MHz spectrometer operating at 400 MHz. The samples were dissolved in D2O and TMS was used as a standard. ATR spectra were recorded on a Tensor 27 FTIR spectrophotometer (Varian 640-IR, FT-IR; Palo Alto, CA, USA). Elemental analysis was carried out with a Carlo-Erba CHNS Elemental Analyzer (EA1108; Milan, Italy).
C. Critical micelle concentration (CMC) determination
The critical micelle concentration (CMC) of N-octyl-O-sulfate chitosan was determined using pyrene as a hydrophobic probe.24,25 A known volume of pyrene in acetone (6 × 10⁻⁷ M) was placed in a series of test tubes; thereafter the solvent was evaporated under vacuum at 60 °C. Aqueous polymer solutions (3 mL) at different concentrations (10−6 to 2 mg/mL) were added into the pyrene-containing test tubes. The resulting suspension was sonicated for 1 h and kept at room temperature for 30 min to equilibrate. The solutions were filtered through polycarbonate filters (0.45 µm) and their fluorescence emission (350–450 nm) was measured after excitation at 339 nm.
D. Preparation of NOSC–SWCNTs aqueous dispersions
Stable dispersions of SWCNTs were obtained by mixing pristine material (0.1 mg/mL) and NOSC (10 mL, 0.5 mg/mL) and subjecting the mixture to sonication in an ultrasonic bath for 2 h. As a control, SWCNTs were dispersed in distilled water (0.1 mg/mL) and subjected to sonication under identical conditions to the sample. The dispersions were then centrifuged at 6000 rpm for 3 min to eliminate any unstable bundles still present in suspension. In an attempt to isolate only the SWCNTs wrapped with the polymer and eliminate the free polymer left in solution, the suspensions were further centrifuged for 30 min at 10![[thin space (1/6-em)]](https://www.rsc.org/images/entities/char_2009.gif) 000 rpm, the supernatant removed and the nanotubes washed (×3) with deionised water and finally re-suspended in water.
The size distribution of the micelles was measured by dynamic light scattering (DLS), on a Nano-ZS (Nanoseries; Malvern Instruments, Malvern, UK), and measurements were made at 25 °C with a fixed angle of 173°. The electrophoretic mobility of the NOSC micelles, the pristine nanotubes and the NOSC–SWCNT hybrids (centrifuged at 6000 rpm for 3 min) were measured at 25 °C using a Zetasizer (Malvern Nanosizer ZS; Malvern Instruments, UK). The ζ-potential (mV) of the dispersions was calculated by the instrument according to the Helmholtz–Smoluchowski equation:where µ is the electrophoretic mobility, η is the viscosity and D is the dielectric constant of the medium in the boundary layer.
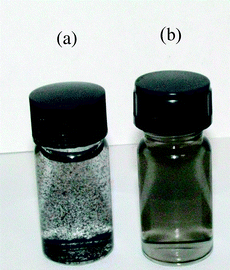
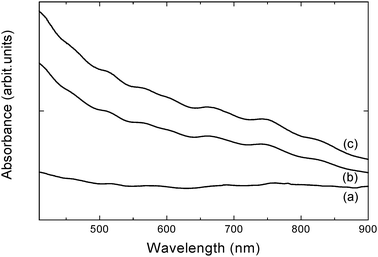
The dispersions of SWCNTs in distilled water and in N-octyl-O-sulfate chitosan were placed in 1 cm QS cells and characterised at room temperature using a UV-Vis spectrophotometer (Perkin Elmer Lambda 35, Waltham, MA, USA) operating in the 400–1100 nm range. The scan speed was 480 nm/min and the slit width was 1 nm. Absorption spectra were recorded for the following preparations: (a) SWCNTs (0.1 mg/mL) in distilled water, (b) NOSC–SWCNT centrifuged at 6000 rpm for 3 min, (c) NOSC–SWCNT dispersion (before centrifugation). The apparent absorption coefficient of SWCNTs dispersed in NOSC solutions was determined as described by Li and coworkers26 Briefly, SWCNTs suspensions were diluted by different factors to obtain a series of suspensions of known SWCNTs content. The absorbance of these solutions at 500 nm was measured and plotted against the concentration of SWCNTs (mg/mL). The data was fitted to pass through the origin by the linear least-squares method. According to Beer's law,where A is the absorbance, ε is the apparent absorption coefficient, L is the path length (1 cm), and c is the SWCNT concentration, the apparent absorption coefficient corresponds to the slope of the line plotted.
NOSC–SWCNTs, centrifuged at 6000 rpm for 3 min, and a drop (10 µL) of the suspension was placed on freshly cleaved muscovite mica (Agar Scientific, Stansted, Essex, UK), mounted on a nickel disc (dia. 1 cm2) with double-sided adhesive tape left for 2 min and excess liquid removed with a gentle stream of N2. AFM studies were carried out using a MultiMode/NanoScope IV scanning probe microscope (Digital Instruments, Santa Barbara, CA, USA) in air under ambient conditions (T = 23 °C, RH = 21%) using the J-scanner (max. xy = 200 µm). Scanning was performed in tapping mode using Si cantilevers with integrated tips (t = 3.5–4.5 µm, l = 115–135 µm, w = 30–40 µm, ν0 = 200–400 kHz, k = 20–80 N m−1, R < 10 nm; Model: RTESP, Veeco Instruments, France) and an RMS amplitude of 0.8 V was used. Images were subsequently processed using NanoScope software (V 7.10; Digital Instruments, Santa Barbara, CA, USA).
Raman spectra were recorded using a microscope equipped triple monochromator combined with a Peltier cooled charge-coupled device detector. The 632.8 nm and 514.5 nm excitation lines were used, while the laser power was ∼1 mW, measured directly before the sample. Raman spectra were obtained for the following preparations: (a) SWCNTs (0.1 mg/mL) in distilled water, (b) NOSC–SWCNTs centrifuged at 6000 rpm for 3 min, (c) NOSC–SWCNTs dispersion.
TEM was performed on a TECNAI G20 S-TWIN microscope (LaB6 filament, 200 kV, Eindhoven, the Netherlands) equipped with an energy dispersive X-ray spectrometer. For the TEM analyses, a drop of a NOSC–SWCNT aqueous suspension was placed on 300 mesh copper grip, which was coated with holey carbon film. The sample was then dehydrated at 40 °C.
000 rpm, the supernatant removed and the nanotubes washed (×3) with deionised water and finally re-suspended in water.
The size distribution of the micelles was measured by dynamic light scattering (DLS), on a Nano-ZS (Nanoseries; Malvern Instruments, Malvern, UK), and measurements were made at 25 °C with a fixed angle of 173°. The electrophoretic mobility of the NOSC micelles, the pristine nanotubes and the NOSC–SWCNT hybrids (centrifuged at 6000 rpm for 3 min) were measured at 25 °C using a Zetasizer (Malvern Nanosizer ZS; Malvern Instruments, UK). The ζ-potential (mV) of the dispersions was calculated by the instrument according to the Helmholtz–Smoluchowski equation:where µ is the electrophoretic mobility, η is the viscosity and D is the dielectric constant of the medium in the boundary layer.
The dispersions of SWCNTs in distilled water and in N-octyl-O-sulfate chitosan were placed in 1 cm QS cells and characterised at room temperature using a UV-Vis spectrophotometer (Perkin Elmer Lambda 35, Waltham, MA, USA) operating in the 400–1100 nm range. The scan speed was 480 nm/min and the slit width was 1 nm. Absorption spectra were recorded for the following preparations: (a) SWCNTs (0.1 mg/mL) in distilled water, (b) NOSC–SWCNT centrifuged at 6000 rpm for 3 min, (c) NOSC–SWCNT dispersion (before centrifugation). The apparent absorption coefficient of SWCNTs dispersed in NOSC solutions was determined as described by Li and coworkers26 Briefly, SWCNTs suspensions were diluted by different factors to obtain a series of suspensions of known SWCNTs content. The absorbance of these solutions at 500 nm was measured and plotted against the concentration of SWCNTs (mg/mL). The data was fitted to pass through the origin by the linear least-squares method. According to Beer's law,where A is the absorbance, ε is the apparent absorption coefficient, L is the path length (1 cm), and c is the SWCNT concentration, the apparent absorption coefficient corresponds to the slope of the line plotted.
NOSC–SWCNTs, centrifuged at 6000 rpm for 3 min, and a drop (10 µL) of the suspension was placed on freshly cleaved muscovite mica (Agar Scientific, Stansted, Essex, UK), mounted on a nickel disc (dia. 1 cm2) with double-sided adhesive tape left for 2 min and excess liquid removed with a gentle stream of N2. AFM studies were carried out using a MultiMode/NanoScope IV scanning probe microscope (Digital Instruments, Santa Barbara, CA, USA) in air under ambient conditions (T = 23 °C, RH = 21%) using the J-scanner (max. xy = 200 µm). Scanning was performed in tapping mode using Si cantilevers with integrated tips (t = 3.5–4.5 µm, l = 115–135 µm, w = 30–40 µm, ν0 = 200–400 kHz, k = 20–80 N m−1, R < 10 nm; Model: RTESP, Veeco Instruments, France) and an RMS amplitude of 0.8 V was used. Images were subsequently processed using NanoScope software (V 7.10; Digital Instruments, Santa Barbara, CA, USA).
Raman spectra were recorded using a microscope equipped triple monochromator combined with a Peltier cooled charge-coupled device detector. The 632.8 nm and 514.5 nm excitation lines were used, while the laser power was ∼1 mW, measured directly before the sample. Raman spectra were obtained for the following preparations: (a) SWCNTs (0.1 mg/mL) in distilled water, (b) NOSC–SWCNTs centrifuged at 6000 rpm for 3 min, (c) NOSC–SWCNTs dispersion.
TEM was performed on a TECNAI G20 S-TWIN microscope (LaB6 filament, 200 kV, Eindhoven, the Netherlands) equipped with an energy dispersive X-ray spectrometer. For the TEM analyses, a drop of a NOSC–SWCNT aqueous suspension was placed on 300 mesh copper grip, which was coated with holey carbon film. The sample was then dehydrated at 40 °C.
J. Molecular modelling
Energy minimisation calculations were used to investigate the mode of binding of the NOSC polymer chains to the surface of the nanotubes. Simulations were carried out using the CVFF forcefield27 as implemented in the program Materials Studio 4.1 (Accelrys Software Inc, San Diego, CA, USA).28Water molecules were not explicitly included in the calculations but the dielectric constant, ε, was set to a value of 78.5 in order to simulate an aqueous environment at room temperature.
The potential anticoagulant activity of NOSC in solution and wrapped onto SWCNTs was determined using the Amax heparin accucolor kit (Trinity Biologicals, Ireland). This kit contains coagulation factor Xa and its inhibitor antithrombin III which in normal conditions would slowly react with each other and reduce the efficiency of the process of coagulation. The presence of heparin or other factor Xa specific inhibitors would catalyse the reaction between the two molecules and increase their reaction rate, this effect being dependent on concentration. Solutions of the polymer in the concentration range 0.001 to 5 mg/mL were tested to obtain a dose response curve for NOSC. Samples of NOSC–SWCNTs, prepared as described above, were also tested. Antithrombin III (75 µL) was added to the test sample (25 µL) in a 96-well plate and the mixture was incubated for 2 min at 37 °C. Factor Xa (75 µL) was added and the mixture incubated for 1 min at 37 °C. To obtain a colour change due to reaction between factor Xa and antithrombin III, factor Xa substrate (75 µL) was added and the mixture incubated for 10 min at 37 °C. The reaction was then stopped by the addition of glacial acetic acid (50 µL) and the optical density was measured at 405 nm. Blanks were prepared by adding glacial acetic acid to the samples from the beginning of the experiment.
III Results and discussion
A.
Polymer synthesis and CMC determination
NOSC was successfully obtained in the form of a water soluble off-white material. The polymer was characterised as described previously.25 In summary, the attachment of the octyl chains to the primary amino group of chitosan was confirmed by FTIR analysis. The characteristic peak attributed to the bending vibration of –NH2 (1587 cm−1) disappeared from the FTIR spectra of the octyl derivative, whilst new peaks attributed to the octyl chain were evident (1649, 1537, 1465, 1373 cm−1); furthermore FTIR analysis revealed that O-sulfation occurred mainly at the hydroxylic group in position C6 as the peak attributed to the combination of O–H bending and C–O stretching of the primary alcohol (1166 cm−1) disappeared and new peaks assigned to O![[double bond, length as m-dash]](https://www.rsc.org/images/entities/char_e001.gif) S
S![[double bond, length as m-dash]](https://www.rsc.org/images/entities/char_e001.gif) O appeared at 1268, 1200, 1095 and 779 cm−1.
O appeared at 1268, 1200, 1095 and 779 cm−1.
Alkylation was also visible on the 1H NMR spectrum with the appearance of new peaks at 0.8–1.0 ppm (–NH–CH2–(CH2)6–CH3), 1.2–2.0 ppm (–NH–CH2–(CH2)6–CH3) and 3.4–3.5 ppm (–NH–CH2–(CH2)6–CH3). According to elemental analysis data, the polymer underwent successful alkylation of 80.3% of the free amino groups, and sulfation afforded an average of 0.78 sulfate groups per monomer. The CMC of NOSC was determined using pyrene as a hydrophobic probe. The calculated value for the CMC was 95.4 ± 8.2 µg/mL, indicating the stability of the polymeric micelles (Fig. 2).
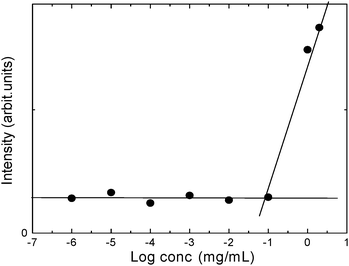 |
| | Fig. 2 Determination of CMC for NOSC polymer in distilled water (pH 5.3). | |
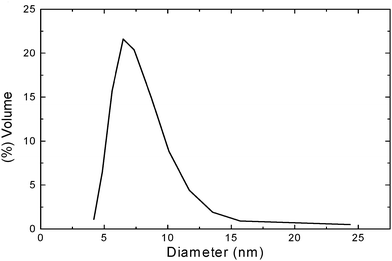 |
| | Fig. 3
Dynamic light scattering distribution of NOSC micelles in distilled water (pH 5.3) expressed as volume particle size distribution versus particle size diameter (nm). | |
D. Apparent absorption coefficient studies
The apparent absorption coefficient for SWCNTs suspended in a solution of NOSC (5 mg/mL) was determined by plotting the absorption values measured at 500 nm for a series of SWCNT suspensions of known concentrations (0.001–0.2 mg/mL), as reported previously.26 The apparent absorption coefficient obtained was 5.16 mL/mg/cm (R2 = 0.994), see Fig. 6A. Once the apparent absorption coefficient was determined this value was used to calculate the loading capacity of NOSC solutions. After sonication of the SWCNT–NOSC mixture in water, the suspension was centrifuged at 6000 rpm to eliminate SWCNTs still present in the form of bundles. After centrifugation it was found that 43.7 ± 6.4% of the SWCNTs were still present in the suspension. To isolate the NOSC–SWCNT hybrids from any free polymer, the suspensions were centrifuged at 10![[thin space (1/6-em)]](https://www.rsc.org/images/entities/char_2009.gif) 000 rpm for 30 min. After such treatment, 15.6 ± 3.6% of the NOSC–SWCNTs were still present in suspension, while 9.8 ± 2.8% of the initial SWCNTs were found in suspension after 3 washings and resuspension in water (Fig. 6B). This corresponds to 0.010 mg/mL SWCNTs in 0.5 mg/mL NOSC solution, a loading capacity that is comparable to that of other chitosan derivatives, both N- and O- substituted, that were found to suspend SWCNTs achieving concentrations of up to 0.038 mg/mL, however this was achieved using the polymers at concentrations of 10 mg/mL, 20 times higher than that used in the present work.29 We can therefore suggest that the presence of the hydrophobic chains grafted to the polysaccharidic backbone and forming hydrophobic interactions with the nanotubes' sidewalls can afford a more efficient suspension even at low polymeric concentrations as opposed to polymers, such as chitosan or pegylated O-carboxymethyl chitosan, that interact by the formation of hydrogen bonding.30
000 rpm for 30 min. After such treatment, 15.6 ± 3.6% of the NOSC–SWCNTs were still present in suspension, while 9.8 ± 2.8% of the initial SWCNTs were found in suspension after 3 washings and resuspension in water (Fig. 6B). This corresponds to 0.010 mg/mL SWCNTs in 0.5 mg/mL NOSC solution, a loading capacity that is comparable to that of other chitosan derivatives, both N- and O- substituted, that were found to suspend SWCNTs achieving concentrations of up to 0.038 mg/mL, however this was achieved using the polymers at concentrations of 10 mg/mL, 20 times higher than that used in the present work.29 We can therefore suggest that the presence of the hydrophobic chains grafted to the polysaccharidic backbone and forming hydrophobic interactions with the nanotubes' sidewalls can afford a more efficient suspension even at low polymeric concentrations as opposed to polymers, such as chitosan or pegylated O-carboxymethyl chitosan, that interact by the formation of hydrogen bonding.30
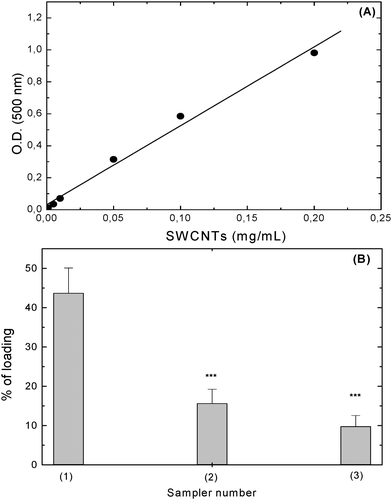 |
| | Fig. 6 (A) SWCNTs calibration curve for the determination of the apparent absorption coefficient. E = 5.16 mL/mg/cm, R2 = 0.994. (B) Loading capacity of NOSC (5 mg/mL). UV absorbance was measured after 3 min centrifugation at 6000 rpm (1), after 30 min centrifugation at 10![[thin space (1/6-em)]](https://www.rsc.org/images/entities/char_2009.gif) 0000 rpm (2) and after washing and resuspending the SWCNTs in water (3). Results are given as mean ± SD (n = 3). One-way Anova analysis of variance, p < 0.001; Tukey–Kramer multicomparison test, ***p < 0.001 compared to (1). 0000 rpm (2) and after washing and resuspending the SWCNTs in water (3). Results are given as mean ± SD (n = 3). One-way Anova analysis of variance, p < 0.001; Tukey–Kramer multicomparison test, ***p < 0.001 compared to (1). | |
The electrical properties of plain and NOSC coated SWCNTs were investigated by means of ζ-potential measurements. Pristine nanotubes exhibited a negative charge −16.35 ± 1.32 mV, as has been previously reported.29 The ζ-potential values of NOSC–SWCNTs dispersions shifted to −39.60 ± 2.55 mV giving evidence of the presence of NOSC onto the surface of the nanotubes.
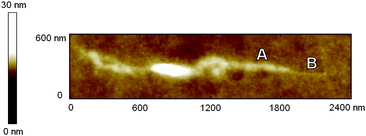
AFM imaging was used to assess the stacking motif of the NOSC polymer onto the SWCNT’s sidewalls. Diameter measurements were obtained in multiple points in coated and uncoated areas. The calculated height values (less susceptible to tip–sample artefact errors than lateral diameter values) of the tubes in the coated region (Fig. 7) were 6.5 ± 1.7 nm (n = 24) and 2.4 ± 0.8 nm (n = 16) for the uncoated region (Fig. 7B) (two-tailed student t-test, p < 0.0001). The shift to higher diameters could be attributed to domains of immobilised NOSC creating a surface layer.
 |
| | Fig. 7
AFM image of SWCNT treated with NOSC (0.5 mg/mL) after centrifugation. A = coated region (height = 6.5 ± 1.7 nm, n = 24) and B = uncoated region (height = 2.4 ± 0.8 nm, n = 16). | |
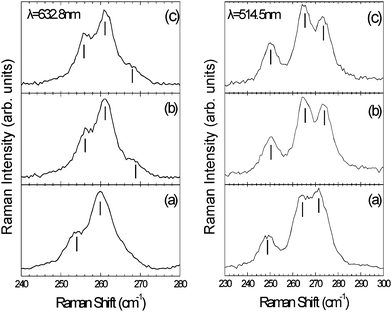
Especially, the low frequency radial breathing mode (RBM) region, where all the tube atoms vibrate radially in phase, gives valuable information concerning the binding of addends onto SWCNT. Fig. 8 (left panel) shows the RBMs of the pristine material in aqueous solution and of the NOSC–SWCNT aqueous suspension before and after centrifugation using the 632.8 nm (1.96 eV) excitation wavelength.
 |
| | Fig. 8
Raman spectra for (a) pristine, (b) NOSC–SWCNT suspension (before centrifugation) and (c) NOSC–SWCNT supernatant (after centrifugation), excited with the 632.8 nm (left panel) and 514.5 nm (right panel). The vertical solid lines indicate the observed phonon peaks. | |
The phonon frequencies were obtained by fitting Lorentzian functions to the experimental peaks, whereas the laser plasma lines were used as an internal calibration of the Raman frequencies. For the pristine uncoated sample, two peaks can be seen at 253 and 260 cm−1 assigned to semi-conducting tubes (resonance with the S22 transition) with chiral indexes (10,3), (9,4), respectively.32 In the case of the modified material obtained before and after centrifugation these bands shift to higher frequencies (256 and 261 cm−1, respectively). Also, a peak at 269 cm−1 assigned to (7,6) can be clearly observed. This peak was poorly resolved for the pristine material. Similar behaviour is observed for the 514.5 nm (2.41 eV) excitation wavelength, Fig. 8 (right panel). More specifically, for the pristine sample three distinct RBM peaks are found at 248, 264 and 272 cm−1 assigned to metallic tubes (resonance with the M11 transition) having chiral indexes (7,7), (8,5) and (9,3), respectively.32 For the NOSC–SWCNT before and after centrifugation the RBM frequencies exhibit a blue shift at 250, 265 and 274 cm−1, respectively. As shown in Fig. 8, the NOSC–SWCNT hybrid material before and after centrifugation exhibits quite similar Raman excitation profiles for both of the wavelengths studied, indicating similar nanotube aggregation states, in agreement with the UV-Vis measurements. The observed RBM frequency shifts, after the addition of NOSC, can be explained by considering the wrapping of the biomolecules onto the graphitic sidewalls. Analogous changes have been reported for the coating of nanotubes with polymers and peptides.30 This mode hardening effect can be rationalised in terms of the increase of the RBM force constants as a result of the stress experienced by NOSC–SWCNTs.33
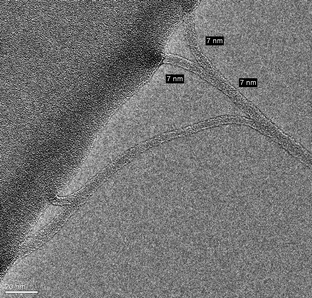
The CNT materials were further examined using TEM; a typical image of NOSC coated SWCNT is shown in Fig. 9. It can be observed that the NOSC–SWCNT has an average outer diameter of approximately 7 nm. This is in good agreement with the nanotubes diameters obtained from the AFM studies, where an average diameter of 6.5 nm was estimated for the same preparation.
H. Molecular modelling studies
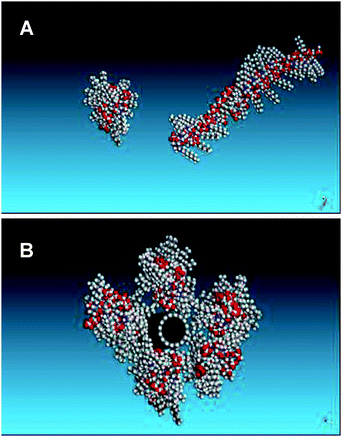
A (8,8) single walled nanotube was constructed with an overall length of 150.0 Å and terminated with hydrogen atoms. A single chain of the chitosanpolymer consisting of 30 monomer units was initially optimised on its own. The polymer was found to adopt a helical backbone configuration with the octyl chains radiating outwards being in broad agreement with a previous study,34 giving the polymer a width perpendicular to the backbone of 3 nm (Fig. 10A). Polymer molecules were then docked near to the surface of the nanotube and energy minimisation was performed using a conjugate gradient algorithm until a convergence force of 0.001 kcal mol−1 Å was obtained. The results showed that favourable interaction is obtained between the polymer and the nanotube. The optimum binding energy was obtained when the chains lie along the nanotube. Up to five polymer chains can be accommodated around the nanotube (Fig. 10B), where an average binding energy of −150.3 kcal mol−1 per chain was obtained. This model gives the tube an overall thickness of up to ca. 7 nm, a value consistent with the results obtained from AFM and TEM studies.
Because of their structural similarity to heparin, sulfated polysaccharides have been reported to present anticoagulant activity by several authors.14,35,36 This study looked in particular at the capacity of NOSC to catalyse the reaction between coagulation factor Xa and antithrombin III as this was previously reported to be the mechanism of action of sulfated chitosan, together with the direct inhibition of thrombin activity.35 Concentrations of polymeric solution between 0.001 and 5 mg/mL were tested to identify at which concentration the polymer presented significant inhibitory activity (Fig. 11).
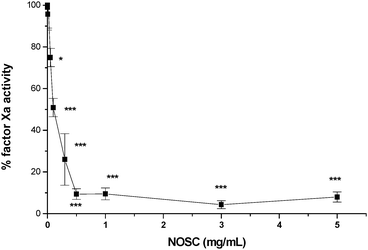 |
| | Fig. 11 Factor Xa inhibition dose response curve for NOSC. Results are given as mean ± SD (n = 3). One-way Anova analysis of variance, p < 0.0001; Tukey–Kramer multicomparison test, *p < 0.05, ***p < 0.001 when compared to PBS pH 7.4. | |
This showed that the polymer can hinder the coagulation process when present in concentrations of at least 0.05 mg/mL (74.9 ± 4.4% of factor Xa residual activity, p < 0.05 compared to PBS pH 7.4); maximum inhibitory effect (4.3 ± 1.9%, p < 0.001) was reached at 3 mg/mL. Recent research suggests that, in order for chitosan heparinoids to present anticoagulant activity, a minimum of 36 consecutive sulfate groups must be present along the polymeric backbone. Since NOSC presents a degree of sulfation of 0.78, it is highly probable that such sequences are often present on the polymer and are responsible for its activity.37 When the NOSC–SWCNT suspension (after centrifugation at 6000 rpm) was tested it gave results similar to those obtained for the polymer on its own (Table 1).
Table 1
Anticoagulant activity of NOSC solutions and NOSC–SWCNT hybrids. Two-tailed student t-test, p < 0.05
| Sample |
Factor Xa activity (%) |
| NOSC (0.5 mg/mL) |
9.4 ± 2.6 |
| NOSC–SWCNTs after centrifugation (6000 rpm) |
8.4 ± 4.9 |
These results showed that NOSC possesses anticoagulant activity at the concentrations used for the preparation of a stable SWCNTs suspension, furthermore its activity is not affected by the presence of the nanotubes. This fact could be of paramount importance in the preparation of biocompatible systems.
IV Conclusions
This paper demonstrates the formation of NOSC-coated SWCNTs, showing that this polymer can suspend the carbon nanotubes up to 20 times more effectively than other chitosan derivatives so far tested. Both experimental and theoretical approaches have been employed to characterise these dispersions. The wrapping of SWCNTs with NOSC resulted in stable dispersions characterised by means of microscopy (AFM and TEM), spectroscopy (UV-Vis, Raman) and surface charge (ζ-potential) measurements. The results demonstrate the presence of individual carbon nanotubes with a diameter of ca. 7 nm. Moreover, molecular modelling studies have been employed to compare the experimental results with those obtained from a theoretical investigation and showed that both experimental and theoretical studies were in good agreement. Finally, studies on the anti-coagulant activity of NOSC demonstrated that at the concentrations used for SWCNT coating, the polymer presents a good anti-coagulant activity. Furthermore, it has been shown that the activity is not affected by the wrapping of the polymer around the SWCNTs. The potential advantages of the current approach are: (i) a simple and straightforward method to stabilise SWCNT and (ii) preparation of polymer coated SWCNTs with anticoagulant properties. Such systems could be further considered to be used to prepare biocompatible nanodevices or biosensors .
Acknowledgements
TEM images were taken at ZELMI of TU, Berlin. KP acknowledges the technical assistance of S. Selve.
Notes and references
- S. Iijima, Nature, 1991, 354, 56–58 CrossRef CAS.
- A. Bianco, K. Kostarelos and M. Prato, Curr. Opin. Chem. Biol., 2005, 9, 674–679 CrossRef CAS.
- D. Tasis, N. Tagmatarchis, A. Bianco and M. Prato, Chem. Rev., 2006, 106, 1105–1136 CrossRef CAS.
- V. C. Moore, M. S. Strano, E. H. Haroz, R. H. Hauge and R. E. Smalley, Nano Lett., 2003, 3, 1379–1382 CrossRef CAS.
- M. F. Islam, E. Rojas, D. M. Bergey, A. T. Johnson and A. G. Yodh, Nano Lett., 2003, 3, 269–273 CrossRef CAS.
- R. Haggenmueller, S. S. Rahatekar, J. A. Fagan, J. Chun, M. L. Becker, R. R. Naik, T. Krauss, L. Carlson, J. F. Kadla, P. C. Trulove, D. F. Fox, H. C. Delong, Z. Fang, S. O. Kelley and J. W. Gilman, Langmuir, 2008, 24, 5070–5078 CrossRef CAS.
- S. Y. Ju, J. Dolli, I. Sharma and F. Papadimitrakopoulos, Nat. Nanotechnol., 2008, 3, 356–362 CrossRef CAS.
- Y. Wu, J. S. Hudson, Q. Lu, J. M. Moore, A. S. Mount, A. M. Rao, E. Alexov and P. C. Ke, J. Phys. Chem. B, 2006, 110, 2475–2478 CrossRef CAS.
- H. Yang, S. C. Wang, P. Mercier and D. L. Akins, Chem. Commun., 2006, 1425–1427 RSC.
- G. Ke, W. Guan, C. Tang, W. Guan, D. Zeng and F. Deng, Biomacromolecules, 2007, 8, 322–326 CrossRef CAS.
- S. F. Wang, L. Shen, W. D. Zhang and Y. J. Tong, Biomacromolecules, 2005, 6, 3067–3072 CrossRef CAS.
- J. A. Wise, J. R. Smith, N. Bouropoulos, S. N. Yannopoulos, S. M. van der Merwe and D. G. Fatouros, J. Biomed. Nanotechnol., 2008, 4, 67–72 Search PubMed.
- T. Takahashi, C. R. Luculescu, K. Uchida, T. Ishii and H. Yajima, Chem. Lett., 2005, 34, 1516–1517 CrossRef CAS.
- F. Shahidi and R. Abuzaytoun, Adv. Food Nutr. Res., 2005, 49, 93–135 Search PubMed.
- M. N. Kumar, R. A. Muzzarelli, C. Muzzarelli, H. Sashiwa and A. J. Domb, Chem. Rev., 2004, 104, 6017–6084 CrossRef.
- C. Zhang, G. Qu, Y. Sun, T. Yang, Z. Yao, W. Shen, Z. Shen, Q. Ding, H. Zhou and Q. Ping, Eur. J. Pharm. Sci., 2008, 33, 415–423 CrossRef CAS.
- R. Jayakumar, N. Nwe, S. Tokura and H. Tamura, Int. J. Biol. Macromol., 2007, 40, 175–181 CrossRef CAS.
- S. Murugesan, T. J. Park, H. Yang, S. Mousa and R. J. Linhardt, Langmuir, 2006, 22, 3461–3463 CrossRef CAS.
- Y. Lin, S. Taylor, H. Li, K. A. S. Fernando, L. Qu, W. Wang, L. Gu, B. Zhou and Y.-P. Sun, J. Mater. Chem., 2004, 14, 527–541 RSC.
- N. Sinha and J. T. Yeow, IEEE Trans. NanoBiosci., 2005, 4, 180–195 CrossRef.
- S. Polizu, O. Savadogo, P. Poulin and L. Yahia, J. Nanosci. Nanotechnol., 2006, 6, 1883–1904 CrossRef CAS.
-
F. J. Schoen, Introduction to Materials in Medicine, 2nd Edition Elsevier Academic Press, London, pp. 293–296, 2004 Search PubMed.
-
S. R. Hanson, Introduction to Materials in Medicine, 2nd Edition Elsevier Academic Press, London, pp. 332–338, 2004 Search PubMed.
- C. Zhang, Q. Ping, H. Zhang and J. Shen, Carbohydr. Polym., 2003, 54, 137–141 CrossRef CAS.
- S. Green, M. Roldo, D. Douroumis, N. Bouropoulos, D. Lamprou and D. G. Fatouros, Carbohydr. Res., 2009, 344, 901–907 CrossRef CAS.
- Y. Liu, L. Gao, S. Zheng, Y. Wang, J. Sun, H. Kajiura, Y. Li and K. Noda, Nanotechnology, 2007, 18, 365702 CrossRef.
- J. R. Maple, M. J. Hwang, T. P. Stockfish, U. Dinur, M. Waldman, C. S. Ewig and A. T. Hagler, J. Comput. Chem., 1994, 15, 162–182 CrossRef CAS.
-
Materials Studio, Version 4.1, Accelrys Inc., San Diego, CA, USA.
- L. Y. Yan, Y. F. Poon, M. B. Chan-Park, Y. Chen and Q. Qing Zhang, J. Phys. Chem. C, 2008, 112, 7579–7587 CrossRef CAS.
- L. Jiang, L. Gao and J. Sun, J. Colloid Interface Sci., 2003, 260, 89–94 CrossRef CAS.
- S. M. Bachilo, M. S. Strano, C. Kittrell, R. H. Hauge, R. E. Smalley and R. B. Weisman, Science, 2002, 298, 2361–2366 CrossRef CAS.
- C. Fantini, A. Jorio, M. Souza, M. S. Strano, M. S. Dresselhaus and M. A. Pimenta, Phys. Rev. Lett., 2004, 93, 087401–4 CrossRef CAS.
- V. A. Sinani, M. K. Gheith, A. A. Yaroslavov, A. A. Rakhnyanskaya, K. Sun, A. A. Mamedov, J. P. Wicksted and N. A. Kotov, J. Am. Chem. Soc., 2005, 127, 3463–3472 CrossRef CAS.
- E. F. Franca, R. D. Lins, L. C. G. Freitas and T. P. Straatsma, J. Chem. Theory Comput., 2008, 4, 2141–2149 CrossRef CAS.
- P. Vongchan, W. Sajomsang, D. Subyen and P. Kongtawelert, Carbohydr. Res., 2002, 337, 1239–1242 CrossRef CAS.
- G. Vikhoreva, G. Bannikova, P. Stolbushkina, A. Panov, N. Drozd, V. Makarov, V. Varlamov and L. Gal'braikh, Carbohydr. Polym., 2005, 62, 327–332 CrossRef CAS.
- Y. Zou and E. Khor, Carbohydr. Polym., 2009, 77, 516–525 CrossRef CAS.
|
| This journal is © The Royal Society of Chemistry 2009 |
Click here to see how this site uses Cookies. View our privacy policy here. 
![[thin space (1/6-em)]](https://www.rsc.org/images/entities/char_2009.gif) 000 rpm, the supernatant removed and the nanotubes washed (×3) with deionised water and finally re-suspended in water.
000 rpm, the supernatant removed and the nanotubes washed (×3) with deionised water and finally re-suspended in water.
![[double bond, length as m-dash]](https://www.rsc.org/images/entities/char_e001.gif) S
S![[double bond, length as m-dash]](https://www.rsc.org/images/entities/char_e001.gif) O appeared at 1268, 1200, 1095 and 779 cm−1.
O appeared at 1268, 1200, 1095 and 779 cm−1.

![[thin space (1/6-em)]](https://www.rsc.org/images/entities/char_2009.gif) 000 rpm for 30 min. After such treatment, 15.6 ± 3.6% of the NOSC–SWCNTs were still present in suspension, while 9.8 ± 2.8% of the initial SWCNTs were found in suspension after 3 washings and resuspension in water (Fig. 6B). This corresponds to 0.010 mg/mL SWCNTs in 0.5 mg/mL NOSC solution, a loading capacity that is comparable to that of other chitosan derivatives, both N- and O- substituted, that were found to suspend SWCNTs achieving concentrations of up to 0.038 mg/mL, however this was achieved using the polymers at concentrations of 10 mg/mL, 20 times higher than that used in the present work.29 We can therefore suggest that the presence of the hydrophobic chains grafted to the polysaccharidic backbone and forming hydrophobic interactions with the nanotubes' sidewalls can afford a more efficient suspension even at low polymeric concentrations as opposed to polymers, such as chitosan or pegylated O-carboxymethyl chitosan, that interact by the formation of hydrogen bonding.30
000 rpm for 30 min. After such treatment, 15.6 ± 3.6% of the NOSC–SWCNTs were still present in suspension, while 9.8 ± 2.8% of the initial SWCNTs were found in suspension after 3 washings and resuspension in water (Fig. 6B). This corresponds to 0.010 mg/mL SWCNTs in 0.5 mg/mL NOSC solution, a loading capacity that is comparable to that of other chitosan derivatives, both N- and O- substituted, that were found to suspend SWCNTs achieving concentrations of up to 0.038 mg/mL, however this was achieved using the polymers at concentrations of 10 mg/mL, 20 times higher than that used in the present work.29 We can therefore suggest that the presence of the hydrophobic chains grafted to the polysaccharidic backbone and forming hydrophobic interactions with the nanotubes' sidewalls can afford a more efficient suspension even at low polymeric concentrations as opposed to polymers, such as chitosan or pegylated O-carboxymethyl chitosan, that interact by the formation of hydrogen bonding.30

![[thin space (1/6-em)]](https://www.rsc.org/images/entities/char_2009.gif) 0000 rpm (2) and after washing and resuspending the SWCNTs in water (3). Results are given as mean ± SD (n = 3). One-way Anova analysis of variance, p < 0.001; Tukey–Kramer multicomparison test, ***p < 0.001 compared to (1).
0000 rpm (2) and after washing and resuspending the SWCNTs in water (3). Results are given as mean ± SD (n = 3). One-way Anova analysis of variance, p < 0.001; Tukey–Kramer multicomparison test, ***p < 0.001 compared to (1).

