The BAD project: data mining, database and prediction of protein adsorption on surfaces†
Elena N.
Vasina‡
a,
Ewa
Paszek‡
a,
Dan V.
Nicolau, Jr‡
b and
Dan V.
Nicolau
*a
aDepartment of Electrical Engineering & Electronics, The University of Liverpool, Liverpool, L69 3GJ, UK. E-mail: dnicolau@liv.ac.uk; Fax: +44 (0)151 794 4540; Tel: +44 (0)151 794 4537
bCentre for Mathematical Biology, Mathematical Institute, Oxford, OX1 3LB, UK. E-mail: nicolau@maths.ox.ac.uk; Fax: +44 (0)1865 283882; Tel: +44 (0)1865 283889
First published on 24th December 2008
Abstract
Protein adsorption at solid–liquid interfaces is critical to many applications, including biomaterials, protein microarrays and lab-on-a-chip devices. Despite this general interest, and a large amount of research in the last half a century, protein adsorption cannot be predicted with an engineering level, design-orientated accuracy. Here we describe a Biomolecular Adsorption Database (BAD), freely available online, which archives the published protein adsorption data. Piecewise linear regression with breakpoint applied to the data in the BAD suggests that the input variables to protein adsorption, i.e., protein concentration in solution; protein descriptors derived from primary structure (number of residues, global protein hydrophobicity and range of amino acid hydrophobicity, isoelectric point); surface descriptors (contact angle); and fluid environment descriptors (pH, ionic strength), correlate well with the output variable—the protein concentration on the surface. Furthermore, neural network analysis revealed that the size of the BAD makes it sufficiently representative, with a neural network-based predictive error of 5% or less. Interestingly, a consistently better fit is obtained if the BAD is divided in two separate sub-sets representing protein adsorption on hydrophilic and hydrophobic surfaces, respectively. Based on these findings, selected entries from the BAD have been used to construct neural network-based estimation routines, which predict the amount of adsorbed protein, the thickness of the adsorbed layer and the surface tension of the protein-covered surface. While the BAD is of general interest, the prediction of the thickness and the surface tension of the protein-covered layers are of particular relevance to the design of microfluidics devices.
1 Introduction
Protein adsorption at solid–liquid interfaces is critical to a large number of industrial and biomedical applications. In the biomedical arena alone the adsorption of proteins on surfaces is relevant to areas as diverse as biomaterials, protein microarrays and lab-on-a-chip devices. This large span of interest is paralleled by the diverse intent of the quantification of protein adsorption on surfaces. For instance, for implantable biomaterials the protein adsorption has to be minimised to avoid bio-incompatibility. For protein microarrays, one needs to find the optimum balance between higher protein concentration on surfaces, which leads to an increase in overall sensitivity; and protein denaturation, which leads to sensitivity decrease. Finally, for lab-on-a-chip devices protein adsorption may be deleterious to the transport of biofluids in micro-channels and could complicate device design and operation, but the immobilisation of proteins in micro-chambers is essential for analytical functions.The efforts aiming to understand and predict protein adsorption are usually based on the modelling and simulation that uses a combination, in various degrees, of either a discrete, molecularly-orientated approach, or a continuous, thermodynamically-orientated approach. At one extreme, the discrete approach is based on the description of the protein as a set of interconnected objects (atoms, or groups of atoms), but the sheer complexity generated by this approach precluded the development of any model with a significant level of generality. Firstly, treating the problem by computational chemistry, e.g., by molecular dynamics simulations,1–3 is at present not feasible due to the large numbers of atoms involved and consequently the prohibitive computing resources required. Consequently, most models4–7 approximate the protein by a collection of rigid objects, with simple shapes and uniform charge. This simplification, although able to deliver accurate predictions in a number of cases,7 is not helpful when attempting predictions for proteins with more complex shapes. The difficulty of describing accurately and efficiently the protein object is compounded by the failure to account for the large number of interactions and fluid-flow effects which affect the adsorption process.8,9 Fundamentally, and computational problems aside, the discrete, molecularly-based models have an inherent difficulty in taking into account even the simplest adsorption parameters, e.g., concentration of the protein in solution.
The progress of the alternative approach, which describes protein adsorption in thermodynamic terms, has been more substantial, largely because the relevant theoretical framework had been already developed for other adsorption processes and because this approach had a higher empirical content than molecularly-based approaches. This thermodynamic-orientated approach can be connected more easily than molecularly-based models to experimental efforts, which can be used for the estimation of model parameters. Indeed, a wealth of publications developed models for a finer description of the protein adsorption, e.g., its kinetics,7,10–12 and the correlation between adsorbed amount and protein concentration in solution in the form of adsorption isotherms13,14 with parameters estimated from, or with results compared with experimental data. Despite its versatility, and in contrast with molecularly-based models, the thermodynamic models have an inherent difficulty in describing the impact of process conditions on protein adsorption, in particular their impact on adsorbed protein bioactivity. Indeed, as small changes in the pH, temperature or ionic strength of the solution can induce considerable changes in protein conformation, the adsorbed amount of protein and its bioactivity can change dramatically.
Despite this general and acute interest in protein adsorption and much work done towards its modelling and simulation, the complexity of the process translates into the incapacity of predicting it with a reasonable degree of accuracy,15 even if precise information regarding the protein structure, fluid environment and surface parameters is available. A similar problem of untamed complexity faced by other scientific areas, e.g., drug discovery,16,17 material discovery,18,19 is tackled by combinatorial approaches, which comprehensively map the relevant experimental ‘space’ and then seek to correlate input parameters (e.g., structure, composition) with output parameters (e.g., bioactivity, material properties).
To this end, we describe a Biomolecular Adsorption Database (BAD), freely available online, which aggregates published data regarding protein adsorption. The database can be used for the selection of materials or operation conditions for microfluidics devices.
2 Methods
2.1. The BAD concept and data collection
The Biomolecular Adsorption Database (BAD) was conceived as a web-orientated database comprising the experimental data reported in the literature. While the purpose of the database is to be a depositary of information regarding the adsorption of biomolecules in general, at the moment only data regarding the protein adsorption is present, due to its relative importance and to the complex behaviour of proteins at surfaces.The database has been intended to be used primarily for the design of microfluidics devices, in particular for the selection of materials for device fabrication, and for the selection of the optimum operating conditions of lab-on-a-chip devices. Consequently, the BAD comprises only literature data that comprehensively report quantitatively the protein, surface and fluid environment descriptors. Unfortunately, only a small proportion of the literature reports on the full extent of protein adsorption data, but the large amount of the general literature counterbalanced this drawback.
An essential feature of the BAD project was the open and free access to the database, as well as the possibility of continuous upgrade, either by database maintenance and inclusion of newly published data, or entries submitted by individual researchers, similarly to e.g., Protein Data Base, PDB.20 The first tentative on-line version of the BAD was mentioned before21 in the context of the calibration of micro-channels for microfluidic devices. Recently, we have reorganised and supplemented this database with additional entries and implemented it on a MS-Access platform. Where necessary, the primary data have been refined, and brief descriptions of the experimental techniques are provided. This contribution reports on the present design and capabilities of the BAD, which is freely available at http://dbweb.liv.ac.uk/bad/. An image of the entry portal to the BAD is presented in Fig. 1.
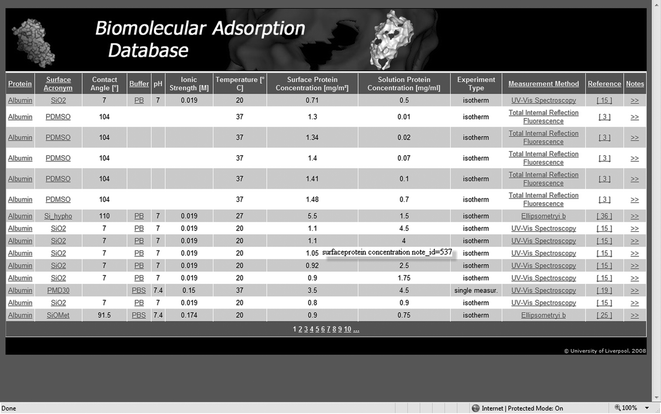 | ||
| Fig. 1 Screenshot of the portal to the Biomolecular Adsorption Database. | ||
The BAD contains experimental results from adsorption isotherms, plateaus and pseudo-plateaus of adsorption kinetics experiments and single adsorption experiments (when adsorbents are incubated in a protein solution with a known initial protein concentration). The primary data has been collected from the open literature (see ESI†) using the major literature search engines (e.g., Scopus, Wiley, Science Direct, ISI Web of Science, etc.) and using several combinations of relevant keywords, e.g., (protein adsorption)AND(contact angle). This initial search was followed by the critical analysis and augmentation of the published data.
Presently, the BAD comprises 768 records of protein adsorption experiments. In several instances, the pair of values (protein concentration in solution) vs. (protein concentration on the surface) had to be estimated from the original contributions through graphical interpolation of data points in the original figures. 80% of the data collected in the BAD come from adsorption isotherms data, 16% from adsorption kinetics experiments and 4% from single adsorption experiments.
2.2. Protein adsorption variables reported in the BAD
The database reports on several input parameters of the protein adsorption process, i.e., related to the protein, surface and fluid environment, together with additional information; the output parameter—mass of adsorbed protein on the surface; and some auxiliary information, i.e., method of measurement and relevant reference.The BAD also provides links to additional information about the proteins, buffers, surfaces, and methods of measurement.
2.3. The organization of the BAD
The primary data was organized along several central tables (web pages). Each table contains the unique index for each row (unique or primary key). The tables are connected through the use of foreign keys that are referential constraints between relations. This approach avoids the redundancy of data in the BAD, maintains its coherence, and allows for the easy extraction of the relevant information. The structure of the information presented in the BAD is schematically presented in Table 1. Fully detailed information regarding the database is presented in the ESI.†| Main BAD table/web page |
| Protein name—link to Protein table |
| Surface Acronym—link to Surfaces table |
| Contact angle (°) |
| Surface tension (mJ/m2) |
| Buffer—link to Buffer table |
| Buffer pH |
| Ionic strength (M) |
| Surface protein concentration (mg/m2) |
| Solution protein concentration (mg/ml) |
| Experiment type |
| Measurement method—link to Methods table |
| Reference—id leading to Reference table |
| Notes—comments on specific entry |
| Protein table: |
| Protein name |
| Source—information about protein source |
| PDB ID (linked Protein Data Bank Identifier) |
| Molecular weight (KDa) |
| Isoelectric point |
| Protein surface tension (mJ/m2) |
| Residues: number of residues of the protein |
| Residues in alpha helices: number of residues in the alpha helices structures |
| Residues in beta sheets: number of residues in the beta sheets structures |
| Disulfide bonds: number of disulfide bonds of the protein |
| Composition of amino acids |
| % of EACH amino acid in the protein sequence |
| Protein hydrophobicity |
| More info: PDF file containing details about the selected protein |
| Surfaces table: |
| Surface full name |
| Surface Acronym and surface abbreviation |
| Description |
| Reference: link to reference id and further information |
| Buffer table: |
| Buffer ID/acronym |
| Description, full buffer name |
| Composition: composition of buffer solution |
| Reference: link to reference id and further information |
| Methods table: |
| Measurement method name |
| Acronym |
| Description |
| Reference: link to reference id and further information |
| Link to external source related to the relevant methodology |
| Reference table: |
| ID—reference identification |
| Author/s |
| Title |
| Year |
| Source |
| Link to external source related to the relevant reference |
2.4. Statistical analysis
The BAD has been tested through the application of regression and neural networks analysis, for the statistical soundness of the variables and overall database extent, respectively.The piecewise multi-linear regression with breakpoint has been applied to a subset of the BAD representing 420 data points (67% of the overall BAD). This subset comprises data that is fully characterised, i.e., complete protein-, surface- and fluid-descriptors, and excludes substantial outliers, e.g., measurements with the quartz microbalance, protein molecular weights above 150 kDa, extremely high protein concentration in solution. Further, the regression has been applied separately to data representing adsorption on hydrophilic (contact angle lower than 45 deg; 201 cases) and hydrophobic surfaces (199 cases).
The regression analysis used a least-squares penalty function as implemented in the software package Statistica™ (from StatSoft Inc.). Whilst the Statistica package is capable of enabling the algorithm to estimate the breakpoint automatically, manually tuning the breakpoint provided a comparatively better fit. The chosen breakpoint was the value at which the correlation between the observed and predicted values was at its highest. We used several estimation algorithms: quasi-Newton, Hooke–Jeeves, Simplex, Rosenbrock and combination of Rosenbrock pattern search and quasi-Newton. Of these, only the first and last were successfully able to converge to a satisfactory solution and both methods gave practically identical results. The maximum number of iterations was set to 1000 and the convergence criterion was set to 10 (the optimization stops when the changes in the parameters from iteration to iteration are no more than the convergence criterion).
The above subset was then analysed by neural networks procedures, also as implemented in Statistica. First, the 420 dataset described above was divided in three sets: training (50, 100, 150, 200, 250 and 300 data points), selection (or validation, 60 data points), and testing (60 data points). The size of the training, selection and test sets has been automatically suggested by Statistica. For each of these combinations we carried out 10 separate runs, each run fitting several types of neural networks using the above sets. Each run uses sets of identical size, but with different composition, prepared through a random process of selection from the BAD 420-subset. For each run we recorded the results, i.e., training, selection and test error as averages, standard deviations and minimum values, only for the networks that improved during neural network procedure. Each run produced an average of 84 improved networks. Second, we run the same calculation plan but with double the size of test sets (120 data points). Consequently the training set could be only up to 240 data points. Finally, we divided the 420 data set in two quasi-equal data sets (211 and 209 data points), each related to different surfaces, i.e., hydrophilic (up to 45°) and hydrophobic. The same procedures were run as before on these two reduced size data sets, but only up to 150 data points for the training set (the remainder being used for the selection and test sets). These surface-specific neural networks calculations produced an average of 50 and 80 improved networks per training set, for hydrophilic and hydrophobic surfaces, respectively. In all calculations, the protein surface concentration was the continuous output and the continuous inputs were protein concentration in solution, ionic strength, contact angle, absolute difference between the pH of buffer and the isoelectric point of the protein, protein hydrophobicity and its standard deviation. In all calculations, both the linear and logistic regression output encoding have been used. The criterion used to select the retained networks was the balance error against diversity. The types of the selected neural networks are linear, probabilistic, general regression, radial basis function and 3 and 4 layer perceptron.
2.5. Prediction of protein adsorption-relevant parameters
Analysis of different network types and architectures, which used the maximum network performance and minimum error criteria, has revealed that the multiple percepton neural network (MLP) gives the optimal results. For the purpose of the further analysis a 3-layer MLP was chosen for fitting the data for hydrophobic surfaces and a 4-layer MLP for hydrophilic surfaces, respectively, and trained using the back propagation method as implemented in Statistica. The most improved network models were further selected. For the hydrophobic surfaces the 7 : 10 : 1 architecture composed of 7 neurons in the first input layer, 10 neurons in the second hidden layer and 1 neuron in the third output layer was selected with the mean-squared error of 0.031. For the hydrophilic surfaces the 7 : 11 : 11 : 1 architecture was fitted with the mean squared error of 0.025. In both cases the hyperbolic function was used as an activation function in hidden layers and the logistic function in output layers, respectively. The performances of the selected neural networks were further analyzed and implemented in Matlab, which was used as the platform for the prediction routines available on the BAD portal.3 Results and discussion
3.1. The BAD and the prediction of protein adsorption for lab-on-a-chip design
Despite the interest in protein adsorption for nearly half a century, one could not yet predict with engineering accuracy the adsorbed amount of a particular protein, on a particular surface in a particular fluid environment. Aside from the previously discussed complexity of the process, this inability also has its roots in the evolution of the interest in protein adsorption. At the beginning much of the interest in protein adsorption was mainly theoretical, which resulted in important theoretical advances—many in use even today. Later, the advent of implantable materials, first metallic, then increasingly polymeric, paralleled by the emergence of more precise analytical equipment, shifted the focus from processes to materials and surfaces. More recently, the development of biomedical microdevices, e.g., biosensors, bioMEMS, micro- and nanoarrays and lab-on-a-chip devices, comes with new interests, challenges and opportunities. While the BAD is intended to help the practitioners involved in any of the above mentioned areas, i.e., colloid and surface science, biomaterials and biomedical microdevices, we expect that the latter community will benefit the most. Indeed, in microfluidics systems the flow of the fluids is well within the laminar regime, and this would make the design of lab-on-a-chip devices trivial if not for a number of complications, of which two could be critical:(i) Change in device geometry. In small sized features (micro-channels, corners, etc.) the attachment of the biomolecules on the walls of the device could induce important changes of their dimensions, at least relatively, thus changing the hydrodynamic resistance to flow in the device.
(ii) Change in surface properties. In laminar regime essentially all the hydrodynamic resistance is concentrated at the walls and this resistance is used to estimate the power required to operate the microfluidics device. But what are the walls? When biomolecules, mostly proteins, attach parasitically and indiscriminately on the walls the roughness of the wall and its nature change, at times dramatically. Then the hydrodynamic resistance changes as well.
The BAD and the BAD-based prediction of protein adsorption could help the lab-on-a-chip designers to address these difficulties.
3.2. Comprehensive mapping of protein adsorption experimental ‘space’
An alternative approach regarding the prediction of protein adsorption, entirely opposite to the approaches based on models, either molecular or thermodynamic, is to comprehensively map the multidimensional experimental ‘space’, i.e., the [protein parameters] × [surface parameters] × [solution parameters]. A similar comprehensive, largely parallel experimentation has been routinely used for more than a decade in the form of combinatorial chemistry for drug discovery,16,17 but also for materials discovery.18,19 Although not explicitly combinatorial, this approach has been attempted, most notably when interfacing representative proteins with ‘model’ surfaces made of self-assembled monolayers (SAMs).26 The complementary effort to combinatorial techniques, denominated as Quantitative Structure-Activity Relationship (QSAR)27 has been also attempted, but in an ‘inverse’ manner, i.e., using neural networks techniques28 to optimise the properties of polymers for fibrinogen adsorption, rather than predict the protein adsorption on any given material.Decades-long research regarding protein adsorption would have offered hope that enough agreement was reached following the large amount of experimental data generated. The—so far—intractable difficulty of the process of protein adsorption, as well as its ubiquitous importance, generated a large amount of empirical data scattered through several decades of scientific literature. This contribution aims to collect, filter and organize this large amount of this unintended combinatorial data regarding protein adsorption in a database that can be used for further QSAR-orientated studies.
3.3. Distribution of the protein adsorption descriptors in the BAD
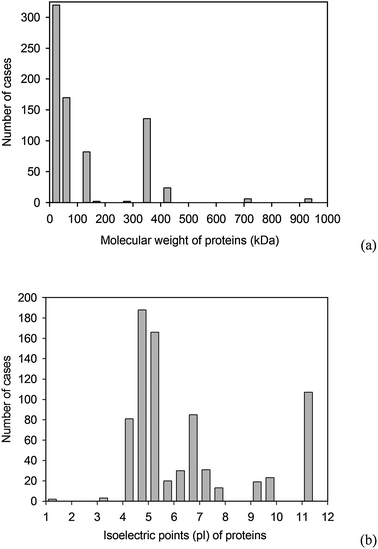 | ||
| Fig. 2 Distribution of the properties of the proteins present in the BAD: (a) molecular weights, (b) isoelectric points. | ||
The molecular weights, isolectric point, hydrophobicity and surface tension have been estimated from the amino acid descriptors, weighted by the relative amino acid composition of the protein. The molecular weight and the isoelectric point are parameters that are independent of the tertiary and quaternary structure of the protein and therefore their estimation from the primary structure is uncontroversial. The protein hydrophobicity and its surface tension are however properties that should manifest on the molecular surface of the protein, at least as adsorption on surfaces is concerned. Consequently, their estimation should be—ideally—derived from the molecular surface, which in turn depends on the tertiary and quaternary structure of the respective protein. Alternatively, all protein descriptors can be included in the BAD as reported in the literature. Despite all of these considerations, the estimation of the protein descriptors as implemented in BAD was dictated by practical considerations. First, the protein adsorption literature very rarely reports the molecular weight and isoelectric point of the protein used, and almost never its hydrophobicity and surface tension. Second, the unavailability of PDB structures for a large proportion of cases in the BAD would have drastically reduced the size of the statistical population and compromised the quality of the prediction of protein adsorption. Third, even if the molecular structure of the proteins were available, the quantum mechanics calculations will be prohibitive even for medium size systems. Fourth, the molecular weight and the molecular surface-related parameters are statistically correlated: at higher molecular weights the overall hydrophobicity will be lower than at lower molecular weights, due to the creation of the hydrophobic core. For all these practical reasons, the data as implemented in the BAD used the primary structure for the estimation of protein descriptors. Further developments, e.g., availability of more protein PDB structures, estimation of protein properties at sub-molecular scale, will be constantly implemented and thus improve the quality of the BAD-based predictions.
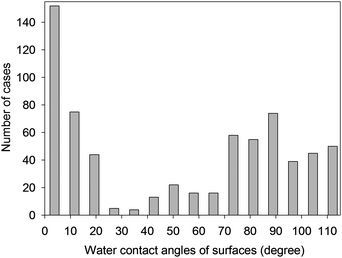 | ||
| Fig. 3 Distribution of the contact angle of surfaces in the BAD. | ||
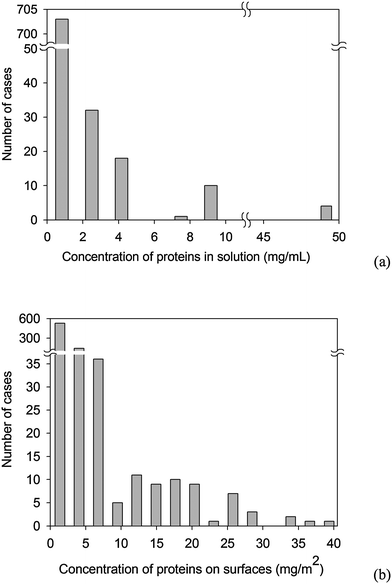 | ||
| Fig. 5 Distribution of proteins concentration: (a) in solution, (b) on the surfaces. | ||
3.4. How representative is the BAD?
A question relevant to the prediction of protein adsorption based on the BAD is whether this database is large enough to be statistically representative for the included proteins. Neural networks and regression analysis can help to provide an answer to this question.First, for the neural network analysis applied to the whole BAD (420 cases; all taken from adsorption isotherm experiments) the error of estimation (test error) of the best neural network reaches a minimum (around 7%) around 150–200 data points, which suggests that a few hundred data points suffice to produce a reasonably accurate prediction for the proteins represented in the BAD. Even more interesting is the observation that less data points (a result of the splitting the data in two sub-sets) are needed to achieve the same or lower errors for the sub-sets describing protein adsorption on hydrophilic and hydrophobic surfaces, respectively. The results of the neural networks analysis (details in the ESI†), strongly suggest that the BAD is large enough to be representative and that further improvements would be the result of additional data for other proteins, surfaces and fluids, and/or more precise measurements, rather than duplication of the present data.
Second, the regression analysis using linear regression with break point resulted in good statistical fits, i.e., a correlation coefficient, R2 of 84.75%, 84.33% and 86.68% for the whole BAD, the hydrophilic, and the hydrophobic surfaces database subsets, respectively. This good fit strongly suggests that the input variables (protein-, surface- and fluid-descriptors; and protein concentration in solutions), as they are represented in the BAD, are in good correlation with the output variable (protein concentration on the surface). These regression results (presented in the ESI†) are not appropriate however to devise relationships that can be used for the prediction of protein adsorption, because, for multiple linear regression, the position of the breakpoint is obtained at the intersection between the regression planes rather than lines—and this does not usually result in a unique point in the multidimensional descriptors “space”. Conceptually, these results suggest that the BAD is also representative with regard to the correlation between the protein adsorption parameters.
3.5. Prediction of lab-on-a-chip design parameters
We need to qualify the prediction of the surface tension of the protein-covered surfaces. The estimated surface tension of protein-covered surface is calculated from the contributions of the bare surface and the pure protein, weighted according to their relative coverage of the total surface. The estimated surface tension of the pure proteins (by a procedure detailed in the ESI†) has provided results that are lower than the experimental data published in the literature,32 which reports the surface tension of pure proteins adsorbed on the surface (full coverage) from saline contact angle measurements on thick layers of the hydrated proteins. This difference can be explained by the fact that while our estimation of the surface tension of pure proteins takes into account all amino acids, the hydrophobicity of the protein manifests more on the molecular surface of the protein. Furthermore the amino acids present on the protein molecular surface are likely more hydrophilic than those inside the protein core. Also our prediction could not include the inherent uptake of the hydration water. With all these qualifications, the estimated surface tension of the surfaces of lab-on-a-chip devices in operation is certainly closer to the working reality, and therefore should be preferred in the design calculations to values for bare surfaces.
3.6. Perspectives and future work
This contribution presented a database regarding the protein adsorption and—using a sub-set of the database—also a predictive method to estimate the parameters relevant to the lab-on-a-chip design. A more comprehensive database and a more accurate prediction could have been produced, if not for several problems related to the measurement and reporting of published protein adsorption data. Despite these shortcomings, the present and the near future offer many opportunities to greatly improve the quality of the database and prediction of protein adsorption, as follows.Standardisation. The literature on protein adsorption is very large, with the major literature databases listing several thousands of titles with “protein adsorption” as a key word, e.g., PubMed 1800; Scopus 4000; ISI Web of Knowledge 6000, etc. Despite this enormous body of knowledge and despite several years of the authors' filtering through thousands of articles, only a very small fraction of the total literature could be useful for the BAD. The main difficulty in integrating this large amount of data lies in the under-reporting of the experimental conditions, i.e., protein, surface and fluid environment conditions. While the protein descriptors are perhaps more difficult to quantify, the surface, and certainly the fluid environment descriptors are far easier to report. Mutually agreed guidelines, if not standardization, similarly with the common practice for other databases (e.g., PDB) would greatly improve the capacity of the scientific community to adsorb the enormous experimental knowledge regarding protein adsorption. Our on-line data submission portal proposes a tentative guideline for reporting protein adsorption data (see ESI†).
Protein descriptors are the most under-reported set of parameters related to protein adsorption, despite their general availability in multiple databases, e.g. PDB, FASTA, etc. Should these descriptors be reported as a matter of common practice, the relationship between protein characteristics and protein adsorption would become much easier to characterise and quantify. Furthermore, the present work correlated the protein adsorption (outputs) with protein descriptors (inputs), but these have been calculated from the protein primary structure rather than from the properties on the molecular surface. It would be expected that the properties manifested on the protein molecular surface, in particular the hydrophobicity, would have a stronger relationship with protein adsorption (although some protein descriptors, e.g., the charges, would be parameters that are ‘bulk’-based rather than molecular surface-based). Consequently, the quantification of some of the protein descriptors on its molecular surface almost surely would improve the prediction of protein adsorption. However, in order to reach this desideratum, new algorithms and methodologies need to be developed, as the present quantification of the molecular surfaces is tailored for drug discovery applications, i.e., using high resolution (water or solvent molecule, Å-range) probing of the protein surface, while protein adsorption is essentially the result of the interaction between the protein surface and adsorbing surface at—relatively—low resolution (surface nanotopography, few nm-range).
Surface descriptors are also under-reported in the literature. This is only partially justified by the experimentally-problematic measurement of the contact angle, e.g., its dynamic nature, but these measurements are relatively trivial compared with the measurements of protein concentration of the adsorbing surface. The development of biomedical microdevices, in particular micro/nanoarrays and lab-on-a-chip devices, makes the impact of the surface more relevant than ever. Several developments are critically needed for a better characterisation and prediction of protein adsorption. First, the surfaces will need to be fully characterised from the electrical point of view, e.g., point of zero charge (pzc), zeta potential, especially in the context of lab-on-a-chip applications. Second, the nanotopography of the surface, often in the range of several nanometres, is likely to interact at the molecular scale with the proteins that have similar dimensions, especially in solutions with low concentrations—as is the case for most biomedical microdevices. Somehow related, the extended exposure of the polymer surfaces to the fluid media surface can cause changes in the macromolecular structure, in which case the protein-surface interactions become even more complex. Third, a full description of the chemistry, which was available in the BAD only for a small number of cases, would allow the automatic calculation of the physico-chemical properties of the adsorbents (e.g., surface potential, surface charge density, pI (or pzc), Hamaker constant). This capability will be added in future versions, in connection with web-based programmes (e.g., MODEL–Molecular Descriptor Lab;33 Polymer Database PoLyInfo34 and other methodologies used to estimate these properties from the chemical structure of polymer materials.35,36 Fourth, as the immobilisation of proteins on the surface is increasingly done for the benefit of ultra-sensitive, single molecule detection devices, there is an imperative need to fully characterise the surface morphology and physico-chemistry with nanometre-level resolution. The mature development of Scanning Probe Microscopies, in particular Atomic Force Microscopy, makes this desideratum an achievable target.
Fluid descriptors are usually the easiest to report, but are still rarely fully described. Lab-on-a-chip applications in particular, where for instance the ionic strength of the buffer could be a critical element in the design of appropriate fluid flow, require the full characterisation of the fluid environment conditions. Whenever possible the reporting of the correlation between the flow conditions and the structure or bioactivity of the immobilised proteins will be of particular relevance to lab-on-a-chip applications.
Combinatorial experiments in microfluidics. Most, if not all of these challenges and additional requirements are counterbalanced by the opportunities offered by lab-on-a-chip devices.37,38 Conceptually, the large number of the combinations of different surfaces would suggest running combinatorial experiments in a microarray format, but the long contact times between the surface and the protein solution, as well as the large number of combinations of the fluid (protein concentration, pH, ionic strength) recommends a microfluidics coupled with a microarray approach. Moreover, several methods for the absolute measurement of the mass of adsorbed proteins, e.g., ellipsometry have been miniaturised together with inherently microscopy based methods (e.g., confocal microscopy). Indeed a combinatorial experiment using modern scanning ellipsometry, which requires an approximate 200 × 200 µm footprint, would result in approximately one thousand experiments on 1 cm2. Certainly such a combinatorial experiment would require nontrivial logistics, design, operation of the chip, and data management of the information, but to put things in perspective this experiment alone would more than double the amount of protein adsorption experiments recorded in the BAD.
Conclusions
While protein adsorption at solid–liquid interfaces is important to many applications, but its impact to the design and operation of lab-on-a-chip devices is critical due to the small dimensions involved and due to the transient regime in which these devices usually operate. Despite the general interest and a large amount of research in the last half a century, the complexity of protein adsorption phenomenon precluded a design-orientated prediction. The online, free-access Biomolecular Adsorption Database (BAD) presented here aims to alleviate this gap in the engineering knowledge. Furthermore, the data present in the BAD allowed for the derivation of predictive tools that can estimate the amount of adsorbed protein, the thickness of the adsorbed protein layer, and the surface tension of the protein-covered surfaces. Lab-on-a-chip device design will require further advances in protein adsorption research, but equally can contribute to an efficient experimentation plan for the benefit of all interested areas.Contributions of the authors
ENV compiled and upgraded the data from the open literature and performed physico-chemical calculations; EP designed and implemented the BAD webpage, including the online prediction tools, and performed the neural networks analysis; DVN Jr contributed to the initial concept, the design of the database, including online versions, and contributed to the regression and neural networks analysis; DVN designed and directed the project, performed the regression analysis, and contributed to the neural networks work.Acknowledgements
The research reported here was sponsored over the years by grants from Defence Advanced Research Projects Agency (DARPA), Australian Research Council (ARC) and European FP6 Programme. DVN wishes to acknowledge the initial work of Dr Jinan Cao, Florin Fulga and Gerardin Solana from Swinburne University of Technology; and the very fruitful discussions with Dr Anantha Krishnan of DARPA and Prof. Mauro Ferarri from Ohio State University. The authors would like to thank Kelly Dorgan for many comments and suggestions that have considerably improved the manuscript.References
- R. Braun, M. Sarikaya and K. Schulten, J. Biomater. Sci., Polym. Ed., 2002, 13, 747–757 CrossRef CAS.
- T. E. Cheatham III and P. A. Kollman, Annu. Rev. Phys. Chem., 2000, 51, 435–471 CrossRef.
- M. F. O'Donohue, E. Minasian, S. J. Leach, A. W. Burgess and H. R. Treutlein, J. Comput. Chem., 2000, 21, 446–461 CrossRef CAS.
- J. Garcia De La Torre, M. L. Huertas and B. Carrasco, Biophys. J., 2000, 78, 719–730 CrossRef CAS.
- O. Byron, Biophys. J., 1997, 72, 408–415 CAS.
- J. Liang, H. Edelsbrunner, P. Fu, P. V. Sudhakar and S. Subramaniam, Proteins: Struct., Funct., Genet., 1998, 33, 1–17 CrossRef CAS.
- R. C. Chatelier and A. P. Minton, Biophys. J., 1996, 71, 2367–2374 CAS.
- M. Malmsten, J. Colloid Interface Sci., 1998, 207, 186–199 CrossRef CAS.
- F. Höök, J. Vörös, M. Rodahl, R. Kurrat, P. Böni, J. J. Ramsden, M. Textor, N. D. Spencer, P. Tengvall, J. Gold and B. Kasemo, Colloids Surf., B, 2002, 24, 155–170 CrossRef CAS.
- P. R. Van Tassel, Materialwissenschaft und Werkstofftechnik, 2003, 34, 1129–1132 Search PubMed.
- P. Déjardin and I. Cottin, Colloids Surf., B, 1995, 4, 111–120 CrossRef CAS.
- M. A. Brusatori and P. R. Van Tassel, J. Colloid Interface Sci., 1999, 219, 333–338 CrossRef CAS.
- M. R. Oberholzer and A. M. Lenhoff, Langmuir, 1999, 15, 3905–3914 CrossRef CAS.
- A. Ladiwala, K. Rege, C. M. Breneman and S. M. Cramer, Proc. Natl. Acad. Sci. U. S. A., 2005, 102, 11710–11715 CrossRef CAS.
- T. A. Horbett and J. L. Brash, eds., Proteins at interfaces II: Fundamentals and applications, American Chemical Society, Washington, DC, 1995 Search PubMed.
- M. A. Gallop, R. W. Barrett, W. J. Dower, S. P. A. Fodor and E. M. Gordon, J. Med. Chem., 1994, 37, 1233–1251 CrossRef CAS.
- E. M. Gordon, R. W. Barrett, W. J. Dower, S. P. A. Fodor and M. A. Gallop, J. Med. Chem., 1994, 37, 1385–1401 CrossRef CAS.
- J. C. Meredith, A. P. Smith, A. Karim and E. J. Amis, Macromolecules, 2000, 33, 9747–9756 CrossRef CAS.
- R. R. Bhat, M. R. Tomlinson and J. Genzer, J. Polym. Sci., Part B: Polym. Phys., 2005, 43, 3384–3394 CrossRef CAS.
- H. M. Berman, J. Westbrook, Z. Feng, G. Gilliland, T. N. Bhat, H. Weissig, I. N. Shindyalov and P. E. Bourne, Nucleic Acids Res., 2000, 28, 235–242 CrossRef CAS.
- D. V. Nicolau Jr, F. Fulga and D. V. Nicolau, Biomed. Microdevices, 2003, 5, 227–233 CrossRef.
- W. R. Pearson and D. J. Lipman, Proc. Natl. Acad. Sci. U. S. A., 1988, 85, 2444–2448 CAS.
- S. H. White and W. C. Wimley, Biochim. Biophys. Acta, 1998, 1376, 339–352 CrossRef CAS.
- E. L. Decker, B. Frank, Y. Suo and S. Garoff, Colloids Surf., A, 1999, 156, 177–189 CrossRef CAS.
- R. Beynon and J. Easterby, Buffer solutions, Taylor & Francis, 2003 Search PubMed.
- A. Sethuraman, M. Han, R. S. Kane and G. Belfort, Langmuir, 2004, 20, 7779–7788 CrossRef CAS.
- R. Perkins, H. Fang, W. Tong and W. J. Welsh, Environ. Toxicol. Chem., 2003, 22, 1666–1679 CrossRef CAS.
- J. R. Smith, V. Kholodovych, D. Knight, J. Kohn and W. J. Welsh, Polymer, 2005, 46, 4296–4306 CrossRef CAS.
- R. Austin, Nat. Nano, 2007, 2, 79–80 Search PubMed.
- A. van den Berg and M. Wessling, Nature, 2007, 445, 726–726 CrossRef CAS.
- R. Mukhopadhyay, Anal. Chem., 2006, 78, 7379–7382 CAS.
- C. J. Van Oss, D. R. Absolom, A. W. Neumann and W. Zingg, Biochim. Biophys. Acta, 1981, 670, 64–73 CAS.
- Z. R. Li, L. Y. Han, Y. Xue, C. W. Yap, H. Li, L. Jiang and Y. Z. Chen, Biotechnol. Bioeng., 2007, 97, 389–396 CrossRef CAS.
- Y. Takaeda and K. Yagi, Polym. News, 2003, 28, 352–355 Search PubMed.
- D. W. Van Krevelen, Properties of polymers, 3rd edn., Elsevier, Amsterdam, 1990 Search PubMed.
- A. A. Askadskii, Computational materials science of polymers, Cambridge International Science Publishing, 2001 Search PubMed.
- A. Lionello, J. Josserand, H. Jensen and H. H. Girault, Lab Chip, 2005, 5, 1096–1103 RSC.
- K. R. Hawkins, M. R. Steedman, R. R. Baldwin, E. Fu, S. Ghosal and P. Yager, Lab Chip, 2007, 7, 281–285 RSC.
Footnotes |
| † Electronic supplementary information (ESI) available: Supplementary Information on 44 references of BAD; detailed description of database organisation; quality of Neural Networks analysis and prediction; prediction of protein layer thickness; prediction of surface tension of protein covered surfaces. See DOI: 10.1039/b813475h |
| ‡ ENV, EP and DVN Jr contributed equally to this work. |
| This journal is © The Royal Society of Chemistry 2009 |