Low cost Pd–W nanoalloy electrocatalysts for oxygen reduction reaction in fuel cells
A.
Sarkar
,
A. Vadivel
Murugan
and
A.
Manthiram
*
Electrochemical Energy Laboratory & Materials Science and Engineering Program, The University of Texas at Austin, Austin, TX 78712, USA. E-mail: rmanth@mail.utexas.edu
First published on 19th November 2008
Abstract
Carbon supported Pd100 − xWx (0 ≤ x ≤ 30) nanoalloy electrocatalysts have been synthesized by simultaneous thermal decomposition of palladium acetylacetonate and tungsten carbonyl in o-xylene in the presence of Vulcan XC-72R carbon, followed by annealing up to 800 °C in H2 atmosphere. Characterization of the Pd–W samples by X-ray diffraction (XRD), X-ray photoelectron spectroscopy (XPS) energy dispersive spectroscopic (EDS) analysis in scanning electron microscopy (SEM), and transmission electron microscopy (TEM) indicates the formation of single phase face centered cubic (fcc) solid solutions for 0 ≤ x ≤ 20 with controlled composition and morphology. The TEM data indicate an increase in particle size with increasing heat treatment temperature. Cyclic voltammetry (CV) and rotating disk electrode (RDE) measurements reveal that the alloying of Pd with W enhances the catalytic activity for the oxygen reduction reaction (ORR) as well as the stability (durability) of the electrocatalyst compared to the unalloyed Pd. The composition Pd95W5 exhibits the maximum activity for ORR in the Pd–W system. The Pd–W catalysts show high tolerance to methanol electro-oxidation compared to a Pt catalyst, which may offer important advantages in employing the Pd-based electrocatalysts for ORR in direct methanol fuel cells.
Introduction
Fuel cells are being actively considered for automotive and stationary power applications as they offer high efficiency with little or no pollution. For transportation applications, both proton exchange membrane fuel cells (PEMFC) and direct methanol fuel cells (DMFC) are being actively pursued due to their low temperature of operation. The oxygen reduction reaction (ORR) is a critical challenge in advancing both the PEMFC and DMFC technologies. Considerable ongoing research is aimed at increasing the kinetics of ORR on Pt-based electrocatalysts and finding cost-effective platinum-free alloy electrocatalysts.1–6 Alloying of Pt with less expensive transition metals like Cr, Fe, Co, Ni, and Cu has been shown to improve the catalytic activity for ORR and the durability.7–16 More recently, alloying of Pd with other elements like Fe, Co, Mo, and Ti has become appealing as they offer high catalytic activity for ORR and the cost of palladium is one-fifth of the cost of platinum.17–24 Binary and ternary Pd-based alloys such as Pd80Co20,Pd90Mo10, and Pd70Co20Mo10 have been found to exhibit good catalytic activity for ORR along with a high tolerance to methanol that may cross-over from the anode to the cathode through the membrane.20,25,26 Since Cr, Mo, and W as group 6A elements of the Periodic Table are equally resistant to oxidation, alloying of Pd with them could enhance the durability while offering good catalytic activity. However, while Savadogo et. al reported no improvement in the ORR activity of a sputtered Pd–Cr alloy compared to Pd,18 we showed recently that both the electrocatalytic activity and the durability can be increased significantly on alloying Pd with Mo.26We present here the synthesis of carbon supported nanostructured Pd–W alloy electrocatalysts by thermal decomposition of tungsten carbonyl and palladium acetylacetonate simultaneously in an organic material. After heat treating at various temperatures, the Pd–W nanoparticles are characterized by X-ray diffraction (XRD), transmission electron microscopy (TEM), energy dispersive spectroscopy (EDS) in a scanning electron microscope (SEM), X-ray photoelectron spectroscopy (XPS), cyclic voltammetry (CV), and electrochemical polarization measurements in rotating disk electrodes (RDE) for ORR. Additionally, a comparison of the electrocatalytic activity of Pd–W with that of Pd–Mo and an investigation of the tolerance of Pd–W to methanol are presented.
Experimental
Palladium acetylacetonate, platinum acetylacetonate, 1,2-hexadecanediol, and tungsten carbonyl were obtained from Aldrich and used as received. 200 mg of carbon-supported Pd100 − xWx (0 ≤ x ≤ 30) catalysts with 20 wt. % metal were synthesized by refluxing required amounts of palladium acetylacetonate, tungsten carbonyl solution (0.00319 g W(CO)6 per mL of o-xylene), and Vulcan XC-72R carbon black (Cabot Corp.) in 50 mL of o-xylene (Acros Organics) for 12 h. The reaction mixture was then cooled to room temperature, filtered, washed repeatedly with o-xylene, and dried overnight in an oven. The carbon supported Pd–W catalysts thus obtained were then heat treated at 300, 500, 700, and 800 °C for 2 h in a flowing H2 atmosphere. For a comparison, 200 mg of carbon supported Pt catalyst with 20 wt % metal in carbon was also synthesized by refluxing a required amount of platinum acetylacetonate with 0.106 g of 1,2-hexadecanediol as a reducing agent and Vulcan XC-72R carbon black in 50 mL of o-xylene. The carbon supported Pt catalyst was not, however, subjected to any post heat treatment.The samples were all characterized by XRD with Cu Kα radiation. The Pd to W ratios in the synthesized samples were assessed by EDS analysis with a JEOL-JSM5610 SEM having an Oxford Instruments EDS attachment. Morphological and particle distribution studies were carried out with a Philips EM 208 TEM operated at 80 keV. XPS studies were conducted with a Kratos Analytical spectrometer using monochromatic Al Kα X-ray source to assess the surface composition of the samples.
CV characterizations were carried out with a standard single compartment three electrode cell having a Pt mesh counter electrode, a glassy carbon (3mm dia.) working electrode, and a saturated calomel reference electrode (SCE), employing a Voltalab PGZ 402 potentiostat (Radiometer Analytical). In a typical experiment, 5 mg of the carbon supported catalyst in 1 mL of isopropyl alcohol was ultrasonicated until a dark homogeneous dispersion was formed. 5 µL of the dispersion was drop cast onto a glassy carbon electrode to give an effective carbon supported catalyst loading of 25 ± 1 µg, and additionally dropping 2 µL of 5 wt. % Nafion solution (Electrochem Inc.) to form a thin film over the catalyst. The CV experiments were conducted in N2 purged 0.5 M H2SO4 at a scan rate of 20 mV/s between −0.242 and 1.1 V (vssaturated calomel electrode (SCE)) at ambient conditions. Before recording the voltammograms, the catalyst surface was cleaned by cycling once between −0.242 and 1.1 V (vsSCE).
Rotating disk electrode (RDE) experiments were conducted with a glassy carbon disk electrode (5 mm dia.) mounted onto an interchangeable RDE holder (Pine Instruments, USA) in O2 saturated 0.5 M H2SO4. A Pt mesh and a SCE were used, respectively, as counter and reference electrodes. All potentials, however, are reported with respect to normal hydrogen electrode (NHE). Before each experiment, the glassy carbon electrode was polished to a mirror-like finish with 0.05 µm alumina (Buehler). In a typical experiment, 1 mg of carbon supported catalyst was ultrasonicated with 0.5 mL isopropyl alcohol and 0.5 mL of 0.15 wt. % Nafion solution (diluted from 5 wt. % Nafion solution by adding ethanol), 20 µL of the aliquot was drop cast onto the glassy carbon electrode, and dried in air to obtain a catalyst loading of 20.37 µg metal/cm2. The catalyst surface was cleaned by cycling 10 times between −0.242 and 1.1 V (vsSCE) before the hydrodynamic polarization curves were recorded. The potential was scanned from 1.0 V to 0.3 V (vsNHE). Methanol tolerance of the catalyst was assessed by scanning the potential between 0.242 and 1.1 V vsSCE in N2 purged 0.5 M H2SO4 + 0.5 M methanol solution at 20 mV/s. The electrode was fabricated as described earlier.
Results and discussion
Structural and compositional characterization
Fig. 1 compares the XRD patterns of the carbon supported Pd100 − xWx (0 ≤ x ≤ 30) catalysts after heat treating at various temperatures. As no shifts in the positions of the Pd100 − xWx reflections compared to those of Pd are seen even after heating at 800 °C possibly due to the similar atomic sizes of Pd and W, the formation of a solid solution alloy between Pd and W could not be established directly from the XRD data. However, the literature Pd–W phase diagram clearly shows the formation of a face centered cubic solid solution up to 23 atom % W and a two-phase region consisting of a Pd-rich face centered cubic phase and a W-rich body centered cubic phase beyond 23 atom % W at 800 °C.27 Examination of the XRD data of the samples heat treated at 800 °C reveals that while W impurity reflections are present in the Pd70W30 sample, no such reflections are seen in Pd80W20. This suggests the formation of a single phase solid solution up to about 20 atom % W, which is consistent with the published phase diagram data.27 However, it is possible that a small amount of tungsten that is below the detection limit of XRD could be present as an impurity phase in Pd80W20 even after heat treatment at 800 °C. Also, no W impurity reflections are seen in Pd70W30 after heat treating at 700 °C, possibly due the presence of tungsten as poorly crystalline or amorphous oxide or unalloyed W.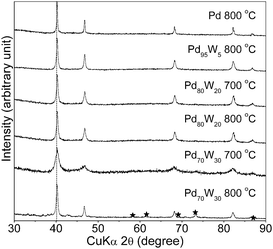 | ||
| Fig. 1 X-Ray diffraction patterns of Pd, Pd95W5, Pd80W20, and Pd70W30 after heat treating at various temperatures. The dotted line refers to the expected position of the (111) reflection of Pd. The reflections marked with * in Pd70W30 after heat treating at 800 °C refer to the W impurity phase (PDF # 00-004-0806). | ||
The TEM images and the particle size distributions of the as-synthesized and 800 °C heat treated Pd95W5 samples are compared in Fig. 2. The as-synthesized Pd95W5 sample has a mean particle diameter of 4.5 nm with a narrow size distribution, which is similar to that of the as-synthesized Pd sample. However, the particle sizes of both Pd and Pd95W5 increase significantly to 10.1 and 11.6 nm, respectively, with a slightly broader size distribution after heat treatment at 800 °C. EDS analysis of all the Pd100 − xWx (0 ≤ x ≤ 30) samples in SEM indicated Pd to W ratios similar to those in the nominal compositions, suggesting effective reduction of both Pd and W by the synthesis method adopted.
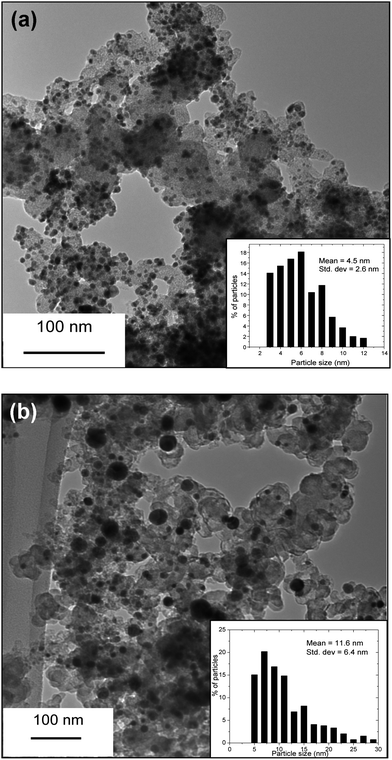 | ||
| Fig. 2 TEM images and particle size distributions of the as-synthesized Pd95W5 before (a) and (b) after heat treating at 800 °C in flowing H2 for 2 h. | ||
Fig. 3(a) and (b) show the Pd 3d and W 4f core level XPS profiles of Pd, Pd95W5, Pd90W10, and Pd80W20 after heat treatment at 800 °C. All the XPS profiles were fitted by the Gaussian–Lorentzian (30% Gaussian) method after background subtraction using Shirley's method. Also, the peaks corresponding to Pd 3d5/2 and Pd 3d3/2 core levels were deconvoluted into Pd and PdOy (0 ≤ y ≤ 2).28,29 As evident from Fig. 3(a), palladium in the surface exists as both Pd metal and PdOy in all the samples. Additionally, it was found that upon alloying with tungsten, the ratio of Pd:PdOy decreases systematically from 1.5 in the case of Pd to 0.75, 0.71, and 0.67 for Pd95W5, Pd90W10, and Pd80W20, respectively. A small shift in the binding energy of the Pd 3d5/2 core level in Pd95W5, Pd90W10, and Pd80W20 by +0.2, +0.4, and +0.5 eV, respectively, compared to that in Pd (335.3 eV) was also observed. The systematic shift in the binding energy of Pd 3d5/2 with increasing W content suggests a change in the electron density around Pd upon alloying with W. Fig. 3(b) shows a fitting of the W 4f peaks. Two distinct 4f7/2 doublets centered at 35.3 and 32.3 eV corresponding to WOz (0 ≤ z ≤ 3) and WC can be seen.30,31 Based on the XPS data, it can be concluded that a small amount of surface carburization resulting in WC (less than 20 atom %) might have occurred during the heat treatment of the carbon-supported catalysts at 800 °C and the formation of WOz and PdOy moieties on the surface might have occurred due to the exposure of the samples to ambient. The Pd:W ratio in Pd95W5 as determined from the XPS peak areas was 93.7:6.3, which is close to the nominal composition. The XPS analysis in conjugation with the SEM-EDS data suggests that there is no surface segregation, which is in agreement with the theoretical calculations of Ruban et al.32 However, enrichment in the surface layers cannot be ruled out as the XPS technique has a certain penetration depth.
![XPS profiles and fitting results of 800 °C heat treated Pd, Pd95W5, Pd90W10, and Pd80W20: (a) Pd 3d core levels showing Pd [- - -] and PdOy (0 ≤ y ≤ 2) [⋯], and (b) W 4f core levels showing WOz (0 ≤ z ≤ 3) [- - -] and WC [⋯]. Solid lines refer to the experimental curves and dotted lines refer to the fitted curves. In both the cases, C 1s binding energy (284.5 eV) was used for calibration.](/image/article/2009/JM/b812722k/b812722k-f3.gif) | ||
| Fig. 3 XPS profiles and fitting results of 800 °C heat treated Pd, Pd95W5, Pd90W10, and Pd80W20: (a) Pd 3d core levels showing Pd [- - -] and PdOy (0 ≤ y ≤ 2) [⋯], and (b) W 4f core levels showing WOz (0 ≤ z ≤ 3) [- - -] and WC [⋯]. Solid lines refer to the experimental curves and dotted lines refer to the fitted curves. In both the cases, C 1s binding energy (284.5 eV) was used for calibration. | ||
Electrochemical characterization
Fig. 4 compares the cyclic voltammograms at the 1st and 5th cycles of the as-synthesized carbon supported Pd, Pd90W10, and Pd80W20catalysts. For brevity, the CVs of Pd95W5 and Pd85W15 are not shown, but they closely follow the trend in Fig. 4. As seen in Fig. 4(a), the peak current density values for the surface oxide reduction (cathodic) peak increase with increasing tungsten content in the as-synthesized Pd–W samples and the peak shifts towards lower potentials compared to that in Pd. In the anodic surface oxide formation region, the tungsten incorporated samples show lower currents compared to Pd, suggesting reduced formation of Pd(OH)2 (E° = 0.897 V vsSHE) and PdO (E° = 0.917 V vsSHE). Incorporation of tungsten also causes changes in the hydrogen adsorption and desorption regions of the CV. However, the tungsten incorporated samples show lower peak areas compared to the as-synthesized palladium. Although no direct measurements of the electrochemical surface area are available in the literature as the coverage of hydrogen on Pd is not a monolayer, the lower peak area in the hydrogen desorption region for the W incorporated samples compared to that of Pd suggests a decrease in the electrochemical active surface area with W incorporation.33–35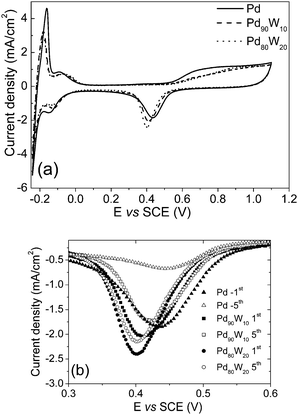 | ||
| Fig. 4 Comparison of the (a) cyclic voltammograms and (b) surface oxide reduction (cathodic) region of the voltammograms after 1st and 5th cycles of as-synthesized Pd, Pd90W10, and Pd80W20 electrocatalysts. | ||
However, after 5 cycles, the peak current density (or active surface area) of both the Pd and the W incorporated samples drop substantially although the drop is less severe for the W incorporated samples as seen in Fig. 4(b). The decrease has been attributed to the formation and incipient growth of PdO and Pd(OH)2 films and subsequent dissolution of Pd as Pd2+ in acidic solutions in the potential range of 0.5–1.3 V vsSHE, which also explains the anomalous observations in the anodic oxide formation and cathodic surface oxide reduction mentioned earlier.36–40 On heat treating at 300, 500, and 700 °C, no significant change was noticed in the stability although the peak current decreased and the cathodic peak potential shifted positive compared to the as-synthesized Pd due to an increase in particle size and corresponding decrease in surface area.
Fig. 5(a) compares the voltammograms of the carbon supported Pd, Pd95W5, Pd90W10, Pd85W15, and Pd80W20catalysts after heat treatment at 800 °C. From the data, it is evident that the Pd–W solid solution alloys show much higher oxide reduction peak currents and hydrogen desorption areas than Pd. This suggests that alloying of Pd with W enhances the electrochemical active surface area as well as the activity for surface oxide formation and its reduction. Among the Pd–W samples tested, Pd95W5 shows the maximum oxygen reduction peak current. Interestingly, alloying of Pd with W also suppresses the dissolution of Pd. As seen in Fig. 5(b), no significant reduction in peak areas is noticed for both the surface oxide reduction and hydrogen desorption peaks of Pd95W5 after 15 cycles. However, increasing the W content beyond Pd85W15 had an adverse effect on stability. Alloying of tungsten also modifies the hydrogen desorption region of the CV substantially. As seen in Fig. 5(a), the hydrogen desorption peak area is maximum for Pd95W5, and the area decreases substantially on increasing the W content further.
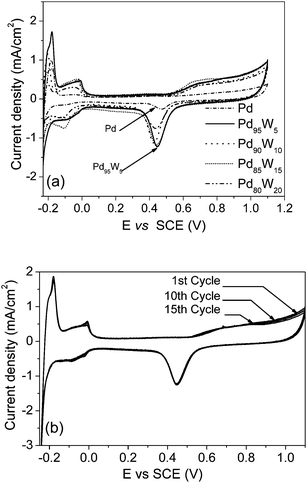 | ||
| Fig. 5 Comparison of (a) the cyclic voltammograms of the 800 °C heat treated Pd, Pd95W5, Pd90W10, Pd85W15, and Pd80W20 samples and (b) the cyclic voltammograms of Pd95W5 after 1st, 10th, and 15th cycles. | ||
Fig. 6(a) and (b) present a comparison of the activities of selected Pd–W alloys and Pd after heat treatment at 800 °C with that of as-synthesized Pt for ORR based on rotating disk electrode (RDE) measurements in 0.5 M H2SO4. From the hydrodynamic polarization curves as shown in Fig. 6(a), it is evident that the ORR on 800 °C heat treated Pd catalyst is under mixed kinetic and diffusion control in the potential window between 1.0 and 0.3 V. Also, measurable currents were observed only below 0.70 V. Alloying of Pd with W increases significantly the activity as can be seen with Pd95W5, Pd90W10, and Pd85W5 compared to Pd. In the case of Pd95W5, the onset potential for ORR was found to be 0.85 V and the limiting current was 4.2 mA/cm2. Figure 6(b) presents the mass transfer corrected kinetic currents for the as-synthesized Pt and 800 °C heat treated Pd, Pd95W5, and Pd90W10 at various potentials. In the absence of a reliable active surface area value for Pd because of the absorption of hydrogen, the current densities were evaluated based on the geometric area. From the plots, it can be concluded that the activities of Pd95W5, Pd90W10, and Pd85W5 for ORR are significantly higher than that of Pd and the ORR activity of Pd95W5 is comparable to the as-synthesized Pt although the particle size of Pd95W5 (11.6 nm ± 6.4 nm) is almost two times that of the as-synthesized Pt (5.6 nm ± 1.4 nm). As the initial and onset part of the curve will depend on the real surface area, a decrease in real surface area will shift the curve to lower potentials irrespective of the catalytic activity. The higher catalytic activity of Pd95W5 compared to that of Pd despite a slightly smaller surface area for the former resulting from a slightly larger particle size indicate that alloying with W intrinsically enhances the activity of Pd.
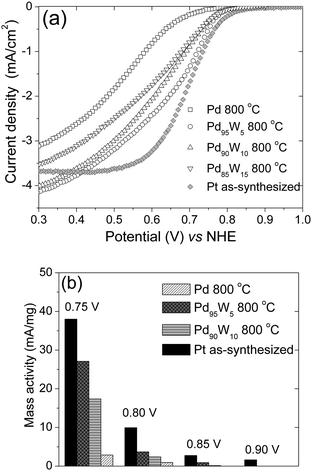 | ||
| Fig. 6 (a) Comparison of the hydrodynamic polarization curves of Pd, Pd95W5, and Pd90W10 after heat treatment at 800 °C with that of as-synthesized Pt. The ORR curves were obtained in O2 saturated 0.5 M H2SO4 with a rotation speed of 1600 rpm at room temperature (the current density refers to geometric area). (b) Mass transport corrected kinetic currents at various potentials (the limiting current values were taken at +300 mV). | ||
Fig. 7 shows the Tafel plots for as-synthesized Pt and 800 °C heat treated Pd, Pd95W5, and Pd90W10. The Tafel slopes for the as-synthesized Pt and 800 °C heat treated Pd were found to be 91.5 mV/decade and 96.5 mV/decade, respectively. Since as-synthesized Pt and 800 °C heat treated Pd show similar Tafel slopes, it can be concluded that the mechanism for ORR on Pd is similar to that on Pt. However, the Pd–W alloy electrocatalysts tend to exhibit a change in Tafel slope with current density. At low currents, the Tafel slopes for Pd95W5 and Pd90W10 are 58.4 and 63.3 mV/decade, respectively, which change to 140 mV/decade and 133.7 mV/decade at higher currents. This suggests a change in reaction mechanism or in the rate controlling step at higher currents for the Pd–W electrocatalysts.
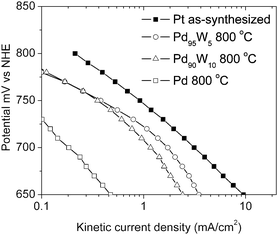 | ||
| Fig. 7 Tafel plots for ORR at ambient temperature of as-synthesized Pt and 800 °C heat treated Pd, Pd95W5 and Pd90W10. | ||
We reported recently an enhancement in activity for ORR on alloying palladium with molybdenum.26 With an alloying temperature of 900 °C, the composition Pd90Mo10 with 10 atom % Mo was found to exhibit the maximum activity for ORR. Fig. 8 compares the RDE plots of selected Pd–Mo and Pd–W samples for ORR. From the hydrodynamic polarization curves, it is evident that the ORR activity of Pd95W5 is slightly higher than that of Pd90Mo10.
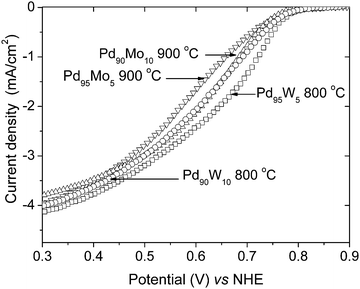 | ||
| Fig. 8 Comparison of the hydrodynamic polarization curves of 900 °C heat treated Pd95Mo5 and Pd90Mo10 with those of 800 °C heat treated Pd95W5 and Pd90W10. The ORR curves were obtained in O2 saturated 0.5 M H2SO4 with a rotation speed of 1600 rpm at room temperature (the current density refers to geometric area). | ||
It has been demonstrated before that the palladium-based alloy catalysts are not active for methanol oxidation and they show high tolerance to methanol that may cross-over from the anode to the cathode through the Nafion membrane in a DMFC.20,24 Indeed, the CV plot of Pd95W5 in a mixture of 0.5 M methanol and 0.5 M H2SO4 as shown in Fig. 9 does not show any current due to methanol oxidation compared to significant activity of the as-synthesized platinum catalyst for methanol oxidation. The results suggest that Pd95W5 can be a potential ORR electrocatalyst in DMFC.
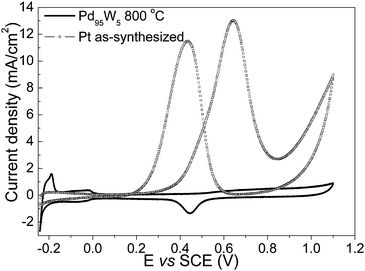 | ||
| Fig. 9 Cyclic voltammograms of Pd95W5 and as-synthesized Pt in a mixture of 0.5M H2SO4 + 0.5 M CH3OH at 20 mV/sec. | ||
Oxygen reduction is a multi-electron reduction process and involves a number of reaction steps, intermediates, and adsorbed species. The rate determining step and the kinetics are not only different for different electrocatalysts, but also dependent on the crystal faces of the same electrocatalyst. It has been demonstrated that palladium-based alloy catalysts promote a four-electron pathway for the oxygen reduction reaction in acidic solution.22,24 Therefore, it is reasonable to assume that the mechanisms proposed for the enhancement in activity on alloying Pt with other element like Co can be applied for Pd based alloy catalysts as well. The enhanced electrocatalytic activity of platinum alloys like Pt–Co, Pt–Ni, and Pt–Fe has been explained on the basis of (i) modification of the electronic structure of Pt (5d-orbital vacancies), (ii) changes in the Pt–Pt bond distance and coordination number, and (iii) inhibition of adsorbed oxygen-containing species from the electrolyte onto Pt.10–16,41 More recently, it has been proposed that for Pt–M (M = Fe, Co, Ni, and Cu) alloy catalysts, selective dissolution of the alloying element from the top layers resulting in a Pt skin structure causes a change in the d-states of the surface atoms.11–16 As the filling of the antibonding states of O2 2p determines the strength of interaction of the metal–oxygen bond, which is dependent on the position of the metal d states relative to the Fermi level, the dissociative chemisorption of oxygen changes with the alloying element. The kinetics of the net oxygen reduction reaction, however, depends on two competing processes: dissociative adsorption of O2 and subsequent transfer of electrons and protons to the adsorbed O2 and the removal of adsorbed OH and O species from the surface. Theoretical calculations have shown that oxygen binds more strongly on Pd compared to that on Pt. A decrease in electron density in Pd on alloying with W as suggested by the XPS data may weaken the Pd–O bond and thus enhance the dissociative adsorption of O2. Moreover, with increasing tungsten content, the removal of adsorbed OH and O species may become difficult, resulting in a decrease in the performance and stability at higher tungsten contents. However, it should be noted that unlike platinum where the dissolution rate is slow, dissolution of Pd itself can limit the application of the proposed mechanisms. Nevertheless, alloying of Pd with tungsten suppresses the dissolution of Pd.
Another factor that has been proposed for the enhancement in the catalytic activity for ORR on alloying Pt with other elements is the Pt–Pt nearest neighbor distance that promotes alternate reaction pathways.10,11 However, this effect is anticipated to be negligible in the Pd–W system as the XRD data show no significant change in the lattice parameter values on alloying Pd with W.
Conclusions
A facile synthesis approach has been adopted to prepare carbon supported Pd100 − xWx (0 ≤ x ≤ 30) electrocatalysts for the oxygen reduction reaction in fuel cells. Alloying of Pd with W is found to increase both the catalytic activity for ORR and the catalyst durability. Although heat treatment at 800 °C to realize the alloy formation increases the particle size of the Pd–W alloys significantly compared to that of an as-prepared Pt catalyst, the mass activity of Pd95W5 is comparable to that of Pt. In addition, the Pd–W alloy electrocatalysts offer an important advantage of high tolerance to methanol compared to Pt. The lower cost and higher tolerance to methanol of the Pd-based alloy catalysts compared to Pt may make them attractive for direct methanol fuel cells.Acknowledgements
Financial support by the National Science Foundation grant CBET-0651929 and Welch Foundation grant F-1254 is gratefully acknowledged.References
- W. Vielstich, H. A. Gasteigner and A. Lamm (ed), Handbook of Fuel Cells-Fundamentals, Technology and Applications, John Wiley & Sons, Ltd., 2003, vol. 2 Search PubMed.
- A. J. Appleby and F. R. Foulkes, Fuel Cell Handbook, Van Nostrand Reinhold, New York, 1989 Search PubMed.
- J. C. Larminie and A. Dicks, Fuel Cell Systems Explained, John Wiley and Sons Ltd, New York, 2nd edn, 2003 Search PubMed.
- K. B. Prater, J. Power Sources, 1994, 51, 129 CrossRef CAS.
- B. C. H. Steele and A. Heinzel, Nature, 2001, 414, 345 CrossRef CAS.
- G. J. K. Acres, J. Power Sources, 2001, 100, 60 CrossRef CAS.
- L. Xiong, A. M. Kannan and A. Manthiram, Electrochem. Commun., 2002, 4, 898 CrossRef CAS.
- L. Xiong and A. Manthiram, J. Mater. Chem., 2004, 14, 1454 RSC.
- L. Xiong and A. Manthiram, Electrochim. Acta, 2005, 50, 2323 CrossRef CAS.
- S. Mukerjee, S. Srinivasan, M. P. Soriaga and J. McBreen, J. Phys. Chem., 1995, 99, 4577 CrossRef CAS.
- V. Jalan and E. J. Taylor, J. Electrochem. Soc., 1983, 130, 2299 CAS.
- V. Stamenkovic, B. S. Mun, K. J. Mayrhofer, P. N. Ross, N. M. Markovic, J. Rossmeisl, J. Greeley and J. K. Nørskov, Angew. Chem., Int. Ed., 2006, 45, 2897 CrossRef CAS.
- J. Greeley, J. K. Norskov and M. Mavrikakis, Annu. Rev. Phys. Chem., 2002, 53, 319 CrossRef CAS.
- N. M. Markovic, T. J. Schmidt, V. Stamenkovic and P. N. Ross, Fuel Cells, 2001, 1, 105 CrossRef CAS.
- V. Stamenkovic, B. S. Mun, K. J. Mayrhofer, P. N. Ross and N. M. Markovic, J. Am. Chem. Soc., 2006, 128, 8813 CrossRef CAS.
- V. Stamenkovic, B. Fowler, B. S. Mun, G. Wang, P. N. Ross, C. A. Lucas and N. M. Markovic, Science, 2007, 315, 493 CrossRef CAS.
- R. Pattabiraman, Appl. Catal., A, 1997, 153, 9 CrossRef CAS.
- O. Savadogo, K. Lee, K. Oishi, S. Mitsushima, N. Kamiya and K. I. Ota, Electrochem. Commun., 2004, 6, 105 CrossRef CAS.
- J. L. Fernández, V. Raghuveer, A. Manthiram and A. J. Bard, J. Am. Chem. Soc., 2005, 127, 13100 CrossRef CAS.
- V. Raghuveer, A. Manthiram and A. J. Bard, J. Phys. Chem. B, 2005, 109, 22909 CrossRef CAS.
- V. Raghuveer, P. J. Ferreira and A. Manthiram, Electrochem. Commun., 2006, 8, 807 CrossRef CAS.
- W. E. Mustain, K. Keith and J. Prakash, Electrochem. Commun., 2006, 8, 406 CrossRef CAS.
- M. Shao, K. Sasaki and R. R. Adzic, J. Am. Chem. Soc., 2006, 128, 3526 CrossRef CAS.
- L. Zhang, L. Kunchan and J. Zhang, Electrochim. Acta, 2007, 52, 3088 CrossRef CAS.
- H. Liu and A. Manthiram, Electrochem. Commun., 2008, 10, 740 CrossRef CAS.
- A. Sarkar, A. Vadivel Murugan and A. Manthiram, J. Phys. Chem. C, 2008, 112, 12037 CrossRef CAS.
- S. V. Nagendra Naidu and P. Rama Rao, J. Alloy Phase Diagr., 1990, 6, 67 Search PubMed.
- K. S. Kim, A. F. Gossmann and N. Winograd, Anal. Chem., 1974, 46, 197 CrossRef CAS.
- K. Noack, H. Zbinden and R. Schlögl, Catal. Lett., 1990, 4, 145 CAS.
- G. E. McGuire, G. Kk. Schweitzer and T. A. Carlson, Inorg. Chem., 1973, 12, 2451.
- K. T. Ng and D. M. Hercules, J. Phys. Chem., 1976, 80, 2095.
- A. V. Ruban, H. L. Skriver and J. K. Norskov, Phys. Rev. B: Condens. Matter., 1999, 59, 15990 CrossRef.
- J. P. Hoare and S. Schuldiner, J. Electrochem. Soc., 1956, 103, 237 CAS.
- A. Lasia and D. Gregoire, J. Electrochem. Soc., 1995, 142, 3393 CAS.
- C. Gabrielli, P. P. Grand, A. Lasia and H. Perrot, J. Electrochem. Soc., 2004, 151, A1937 CrossRef CAS.
- S. H. Cadle, J. Electrochem. Soc., 1974, 121, 645 CAS.
- L. D. Burke and J. K. Casey, J. Electrochem. Soc., 1993, 140, 1284 CAS.
- M. Grdeń, J. Kotowski and A. Czerwiński, J. Solid State Electrochem., 1999, 3, 348 CrossRef CAS.
- K. Juodkazis, J. Juodkazyt, B. Sebeka, G. Stalnionis and A. Lukinskas, Russ. J. Electrochem., 2003, 39, 1067.
- M. Lukaszewski and A. Czerwinski, J. Electroanal. Chem., 2006, 589, 38 CrossRef CAS.
- K. Kinoshita, Electrochemical Oxygen Technology, John Wiley & Sons, Newyork, 1992 Search PubMed.
| This journal is © The Royal Society of Chemistry 2009 |
