Quantification of 1-aminopyrene in human urine after a controlled exposure to diesel exhaust
Robert
Laumbach
a,
Jian
Tong
b,
Lin
Zhang
b,
Pamela
Ohman-Strickland
ab,
Alan
Stern
bc,
Nancy
Fiedler
a,
Howard
Kipen
a,
Kathie
Kelly-McNeil
a,
Paul
Lioy
a and
Junfeng
Zhang
*ab
aEnvironmental and Occupational Health Sciences Institute, University of Medicine and Dentistry of New Jersey (UMDNJ)-Robert Wood Johnson Medical School and Rutgers University, 170 Frelinghysen Road, Piscataway, NJ 08854, USA
bUMDNJ-School of Public Health, 683 Hoes Lane West, Piscataway, NJ 08854, USA. E-mail: zhangju@umdnj.edu; Fax: +732-235-4004; Tel: +732-235-5405
cDepartment of Environmental Protection, The State of New Jersey, Trenton, NJ 08625, USA
First published on 21st October 2008
Abstract
Diesel exhaust (DE) is a significant source of air pollution that has been linked to respiratory and cardiovascular morbidity and mortality. Many components in DE, such as polycyclic aromatic hydrocarbons, are present in the environment from other sources. 1-Nitropyrene appears to be a more specific marker of DE exposure. 1-Nitropyrene is partially metabolized to 1-aminopyrene and excreted in urine. We developed a practical, sensitive method for measuring 1-aminopyrene in human urine using a HPLC-fluorescence technique. We measured 1-aminopyrene concentrations in spot urine samples collected prior to and during 24 h following the start of 1 h controlled exposures to DE (target concentration 300 µg m−3 as PM10) and clean air control. Time-weighted-average concentrations of urinary 1-aminopyrene were significantly greater following the DE exposure compared to the control (median 138.7 ng g−1creatininevs. 21.7 ng g−1creatinine, p < 0.0001). Comparing DE to control exposures, we observed significant increases in 1-aminopyrine concentration from pre-exposure to either first post-exposure void or peak spot urine concentration following exposure (p = 0.027 and p = 0.0026, respectively). Large inter-individual variability, in both the concentration of urinary 1-aminopyrene and the time course of appearance in the urine following the standardized exposure to DE, suggests the need to explore subject variables that may affect conversion of inhaled 1-nitropyrene to urinary excretion of 1-aminopyrene.
Introduction
Diesel engines play an important and growing role in the world's transportation and industrial infrastructure.1 The emissions from diesel engines are a major source of urban particulate matter air pollution, which epidemiological studies have linked to cardiovascular as well as respiratory morbidity and mortality.2–4 Diesel exhaust (DE) is a probable human carcinogen, and recent animal and human studies show that it may contribute to the induction and exacerbation of allergy and asthma.5,6 Assessment of DE exposure has been a challenge in epidemiological studies of DE health effects due to the need for validated specific markers of DE in environmental and biomonitoring samples.7DE is a complex and variable chemical mixture consisting of inorganic and organic gases and vapors, and a particle phase in which organic compounds and trace metals are adsorbed onto elemental carbon cores.1 Moreover, exposure to DE usually occurs in the context of a yet-more-complex milieu of air pollutants from other sources.7 Personal and fixed-site air monitoring for elemental carbon, the most commonly used marker of DE, has limitations in atmospheres in which other sources of elemental carbon are present. Likewise, the abundant polycyclic aromatic hydrocarbons (PAHs) found in DE are also found in tobacco smoke and emissions from other combustion sources.8Nitro-substituted PAHs (nitro-PAHs) have been proposed as a more-specific marker of DE.9 A recent study found that concentrations of nitro-PAHs were three orders of magnitude higher in DE particles than in urban ambient particles. The most abundant nitro-PAH in DE particles was 1-nitropyrene, with a concentration range of 18–40 µg g−1.10 Nitro-PAHs can also be formed secondarily from gas-phase reactions of PAHs with oxides of nitrogen in the atmosphere, but these reactions preferentially form 2-nitropyrene and 2-nitrofluoranthene, not 1-nitropyrene.10,11 However, the measurement of airborne 1-nitropyrene has often been problematic due to sampling artifacts.12 Potential dietary exposure to 1-nitropyrene from grilled meats and fish is not well established, with one report of nanogram quantities of 1-nitropyrene detected in extracts of grilled chicken.13
As a measure of internal dose, biomonitoring of DE-specific compounds and metabolites in blood or urine may be a useful adjunct or alternative to environmental exposure measurements. 1-nitropyrene is partially metabolized to 1-aminopyrene (1-AP), which has been measured in urine of DE-exposed miners.14 In addition to being a DE-specific marker, 1-nitropyrene is a potent mutagen with direct health implications.15
One of the major reasons for using urine as a matrix for biomonitoring in epidemiological studies is the ease of collection of spot (untimed) urine samples. In contrast, collection of 24 h urine voids is difficult and unreliable due to subject non-adherence.16 Optimization of the utility of spot urine sampling requires some knowledge of the time course of excretion following exposure, which is presently unknown for urinary 1-AP.
In this study we sought to develop a feasible method to measure 1-AP in urine of volunteers undergoing a brief controlled exposure to DE at an occupationally-relevant concentration. We sought to characterize the time-course of excretion following the discrete 1 h long exposure, with the goal of estimating the time to peak urine 1-AP concentration. In addition, we sought to characterize inter-individual variation in urinary 1-AP following the standardized exposure.
Experimental
Subjects
Fifty-five healthy non-smokers were recruited from the University of Medicine and Dentistry of New Jersey (UMDNJ) and Rutgers University community and surrounding New Jersey suburbs through postings and advertisements in newspapers. Among the subjects, 33 were female and 22 were male. Their age range was 19–44 years; but the majority were younger than 30 (mean age was 24.8 with a SD of 6.6 years). Subjects were screened by medical history and physical examination to rule out cardiovascular, pulmonary, renal and hepatic disease. All recruitment and testing procedures were reviewed and approved by the Institutional Review Board of UMDNJ.Exposure conditions
Each subject underwent one 60 min exposure to a filtered-air control condition (clean air, CA) and one 60 min exposure to diluted DE (∼300 µg m−3 as PM10) in random order on separate mornings at least one week apart. Up to two subjects were seated and did not exercise during an exposure session. The exposures were conducted in the Controlled Environment Facility (CEF) housed in Environmental and Occupational Health Sciences Institute (EOHSI) located on Rutgers University's Busch Campus, Piscataway, NJ. The CEF is a 25 m3 stainless steel-lined chamber in which air contaminant concentrations, temperature and humidity are controlled. The DE was generated by a 5500 W electricity generator (Yanmar, Model YDG 5500EE) that contains a 406 cc displacement air-cooled engine. The engine was operated using Number 2 undyed on-highway fuel and 40 weight motor lube oil. A large quantity of fuel was purchased at the beginning of the project to ensure a minimum variation in fuel composition throughout the study. The engine, loaded with several space heaters, was maintained at 100% of rated capacity during each experimental session. The engine is located directly above the ceiling of the CEF, in the penthouse of the EOHSI Building. The dilution/delivery system includes two single-stage mass reduction devices. The first-stage device was a 10 position butterfly valve that divided diesel exhaust between the waste exhaust pipe and the second-stage mass reduction device, a variable-speed blower. After the two mass reductions are completed, a desired amount of diesel exhaust was introduced to the CEF air delivery stream to achieve a targeted DE particulate matter concentration within the CEF. The CEF air delivery stream was filtered through a series of HEPA filters and activated carbon cartridges to remove ambient particles and gaseous pollutants. Concentrations of PM10, NOx, and CO were monitored throughout every DE or clean air session. Real-time PM10 concentration was measured using a SidePak Aerosol Monitor Model 8520 (TSI Inc., Shoreview, MN) calibrated with the same diluted DE in the CEF. NOx was monitored using a chemiluminescent nitrogen oxides (NOx) monitor (Thermo Electron Corp. Franklin, MA). CO was monitored using a Langan Model T15v CO monitor (Langan Products Inc, San Francisco, CA).1-Nitropyrene measurement
Because the exposure condition in the CEF was kept the same for all subjects, we only measured 1-nitropyrene concentrations during 3 separate DE exposure sessions (and 1 clean air session). When PM10 mass concentrations in the CEF stabilized at ∼300 µg m−3, the sampling pump (BGI Inc., Waltham, MA), equipped with a PM10 impactor (A.D.E. Inc., Naples, ME) and a quartz fiber filter (Pall Corp. Life Sciences, East Hills, NY), was turned on at a sampling flow rate of 4 l min−1. After 60 min, the pump was turned off; and the filter was removed from the sampler for storage and analysis as described below.In order to quantify potential 1-nitroprene exposures from other background environmental sources, we asked subjects to wear a personal sampler 24 h prior to and 24 h following an exposure session. The personal sampler was the same as the one used for the measurement of 1-nitropyrene in the CEF and was also operated at a flow rate of 4 l min−1. The sampling inlet was clipped on subjects' collars or shirt pockets. During sleeping hours, the sampler was placed in the bedroom with its inlet close to the breathing zone.
Prior to sample extraction, all filter samples were stored separately in petri dishes in complete darkness at below −4 °C, thus minimizing 1-nitropyrene losses or artifacts. The filters were Soxhlet extracted with 150 ml of HPLC-grade dichloromethane at 70 °C for at least 16 h. After cooling down to room temperature, the extracts were rotary evaporated at 40 °C under a reduced pressure to ∼1 ml. The concentrated extract, along with ∼3 ml dichloromethane used for rinsing, was transferred to an amber vial where the extract was blown to dryness with a gentle nitrogen stream at room temperature. Finally 0.1 ml benzene was added to the vial containing the dry extract. The final solution was analysed for 1-nitropyrene on a GC-ECD system (Model 6890 of Hewlett Packard Co., Rolling Meadows, IL). A DB-5 capillary column (30 m × 0.25 mm id × 0.25 µm-thick film, J&W Scientific, Davis, CA) was used with the following oven temperature program: held at 75 °C for 2 min, increased to 280 °C linearly in 26 min, then held at 280 °C for 5 min. The temperature was set at 300 °C for both the detector and the injection port. An external standard of 1-nitropyrene (99% purity, Aldrich Co., St. Louis, MO) was used to generate calibrations curves.
Urine collection and analysis
Subjects were asked to collect a single spot urine sample at the Clinical Center, located within the EOHSI building where the CEF was housed, prior to the exposure sessions. Following the exposure, subjects were instructed to collect samples of all spontaneous urine voids that occurred prior to their return to the Clinical Center at 24 h post-exposure. Urine samples were collected in 50 ml sterile urine collection cups. Subjects were provided a cooler for immediate storage of urine samples prior to return to the Clinical Center.Shortly after collection, the acetylated urinary 1-AP conjugate was hydrolysed with concentrated HCl (1 ml HCl 12 M + 10 ml urine) at 80 °C in a shaking bath for 1 h. The mixture was then kept cool on an ice bath before extraction. During the extraction process, the pH of the urine–HCl mixture was first adjusted to 7–8 by adding ∼1.1 ml of 10 M NaOH and a small quantity of concentrated acetic acid. The resulting solution was then extracted twice with 5 ml of dichloromethane by centrifugation at 2500 g for 10 min. The two dichloromethane extracts were combined in a glass tube and evaporated to near dryness using nitrogen at room temperature. The residue was rinsed from the glass tube wall and made into a final solution of 1 ml with acetonitrile. The final solution was filtered through a 0.2 µm PVDF Liquid Filter into a 1.8 ml amber vial that was sealed with a Teflon septum for HPLC analysis.
The HPLC system used for 1-AP analysis included a 600E System Controller, a 717 Auto Sampler, and a 2474 Fluorescence Detector (Waters Co., Milford, MA). An Ascentis RP-Amide column (4.6 mm × 250 mm) (Supelco Co., Bellefonte, PA) was used to separate analytes. The mobile phase involved the use of two solutions: solution A = 50 % acetonitrile in water, and solution B = 100 % acetonitrile, with, linear gradient from 100% A to 100% B in 30 min at a flow rate of 1.0 ml min−1. The injection volume was 20 µL. The fluorescence detector was set at an excitation wavelength of 254 nm and an emission wavelength of 425 nm. An external standard of 1-AP (97% purity, Aldrich Co., St. Louis, MO) was used to generate calibrations curves for quantifying 1-AP concentrations. All calibration curves had a near-zero intercept and a R2 > 0.99. This method had a detection limit of 0.02 ng ml−1, expressed as three times the standard deviation of a low-concentration calibration standard (N = 8). The coefficient of variation (CV) on eight repeated injections was 10.1%, demonstrating high reproducibility of the method. Defined as ratio of the concentration determined from the HPLC analysis to the concentration spiked into a real urine sample (with concentration in the original urine subtracted), the method recovery was 88.3%. Examples of chromatograms from a representative urine sample and standard are shown in Fig. 1.
 | ||
| Fig. 1 Representative example of chromatograms showing 1-AP in a typical urine sample and the standard. | ||
Creatinine concentration in each urine sample was measured spectrophotometrically and was used to normalize1-AP concentration (i.e., reported as µg 1-AP per gram creatinine.) Creatinine adjustment is intended to adjust for varying diluteness in spot urine samples.
Statistical analysis
Urine concentrations were aggregated into 2 h intervals across all subjects. Box-plots were used to examine the general pattern of 1-AP concentrations over time following exposure. Our analysis focused on average concentration of urine samples collected in the 24 h post-CA and DE exposures weighted by the interval of time between valid urine samples. The time-weighted averages of 1-AP concentrations following exposure (Ci.Exp) for an individual following exposure is given bywhere Exp = DE or clean air, depending on exposure, tij,Exp is the time that has elapsed from the previous void to void j, or, in the case of the first void, the time elapsed since the end of exposure for the ith subject. The ith subject has a total of Ji,Exp voids for a particular exposure. The sum of the tij,Exp (over all j) will typically be less than 24 h since most subjects will not have voids right at the 24 hour mark. The difference between the time-weighted concentrations for each subject following the DE exposure and the clean air exposure were used as the response. Histograms, examined for normality, demonstrated that these differences followed an extremely light-tailed, although symmetric distribution. Therefore, rank sum tests of the differences were used to compare the 1-AP concentrations following the DE exposure and the CA exposure.

The following rules were applied for inclusion of individual subjects' data in the inferential analyses described above. For inclusion, a subject's exposure follow-up should include at least two valid urine samples and should have no consecutive missing samples (see Results section on details of data validation). If there is an invalid or missing concentration, this is replaced by the average concentration of the samples immediately prior to and following it. If the first sample after exposure is invalid, it is not included in the calculation and the time weighted concentration is calculated with this sample time as the starting point.
Additional sign rank tests compared change in concentrations from baseline to first void following exposure and to peak concentration within 24 h following exposure. Specifically, the response was given as the difference between the DE and the clean air exposures in the change in the log-transformed concentrations from baseline to first (or peak) void. For these analyses, only subjects with valid pre- and post-exposure measurements were included.
Results
Air concentrations
Actual concentrations of particulate matter less than 10 microns in diameter (PM10) (276 ± 13 µg m−3, N = 49) were close to the target concentration of 300 µg m−3 for DE exposure sessions. In contrast, PM10 concentrations for the clean air (CA) sessions were 6 ± 5 µg m−3 (N = 46). Mean nitrogen oxides (NOx) concentrations were 3.63 ± 0.90 ppm for the DE sessions and 0.02 ± 0.02 ppm for the CA sessions. Carbon monoxide (CO) concentrations were 3.79 ± 0.76 ppm for the DE sessions and 0.91 ± 0.21 ppm for the CA sessions. 1-Nitropyrene concentrations for the DE exposure conditions were 2.68 ± 0.51 ng m−3 (N = 3) and below the detection limit (0.06 ng m−3) for the CA conditions. All integrated personal air measurements for the 24 h preceding and the 24 h after each exposure showed that 1-nitropyrene concentrations were below the method detection limit.Urinary 1-AP results
In total, we collected 763 spot urine samples from the 55 subjects. We invalidated four samples due to insufficient volume for sample analysis. We could not use 31 samples in paired within-subject analyses because these samples had no matched DE or clean air session data due to subject drop-out after having finished only one of the two planned exposure sessions. We found that 11 subjects had no more than two valid voids following either the DE or the clean air session and that seven subjects had two invalid urine voids in a row. These 18 subjects were excluded from statistical analysis, leaving 38 subjects. Moreover, 115 samples had creatinine concentrations either > 300 mg l−1 or < 30 mg l−1, which are the limits for an acceptable urine sample result according to WHO guidelines for spot urine sampling.17 We report the results obtained from data excluding these samples that did not meet the WHO criteria, although we obtained similar results, in terms of effect sizes and level of statistical significance, when we repeated the statistical analyses without excluding those samples (not reported).Boxplots in Fig. 2 summarize the urine concentrations during each 2 h interval following the DE exposure and following the clean air exposure. Median concentrations following the DE exposure were up to 9.9 times higher than median concentrations following the clean air exposure.
 | ||
| Fig. 2 Box plot showing distribution of urinary 1-AP concentrations for all samples at 2 h intervals following DE exposure and clean air exposure. The number of urine samples in each time interval ranges from two to 34. The larger appearing median concentration for DE at the ≥18 to <20 h interval is based on only five samples. Sixteen data points of 1-AP concentration > 200 µg mol−1creatinine are not shown. The boxplots show the 25th, 50th and 75th percentiles within the box. The largest and smallest non-outliers (within 1.5 times the interquartile range (IQR) from the first and third quartile) are marked by ‘whiskers’, and mild outliers (from 1.5 to three times the IQR from the first and third quartile) and extreme outliers (more than three times the IQR from the first and third quartile) and are marked with open circles and stars respectively. | ||
Fig. 3 presents histograms of the time-weighted concentrations following the DE exposure and the clean air exposure. It is clear that the distribution shifted towards higher 1-AP concentrations following the DE exposure compared to the distribution of concentrations following clean air exposure. Following the DE exposure, <40% of the subjects had 1-AP concentrations ≤ 100 ng g−1creatinine, compared to 90% of the subjects with average time-weighted 1-AP concentration ≤ 100 ng g−1creatinine following the clean air exposure.
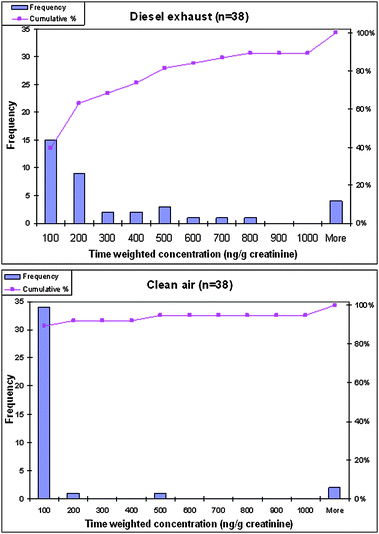 | ||
| Fig. 3 Histograms showing the distribution of individual time-weighted-average 1-AP concentrations in spot urines collected during the 24 h period following the DE exposure (upper) and the clean air exposure (lower). | ||
The time course of urinary 1-AP concentrations was highly variable between individuals. Times to peak exposure varied widely, and some of the 24 h time courses included more than one local maxima. In some cases, the highest concentration was in the last sample collected in the 24 h period, precluding estimation of the peak concentration. Fig. 4 shows three examples of individual time courses that illustrate the varying patterns of 1-AP excretion.
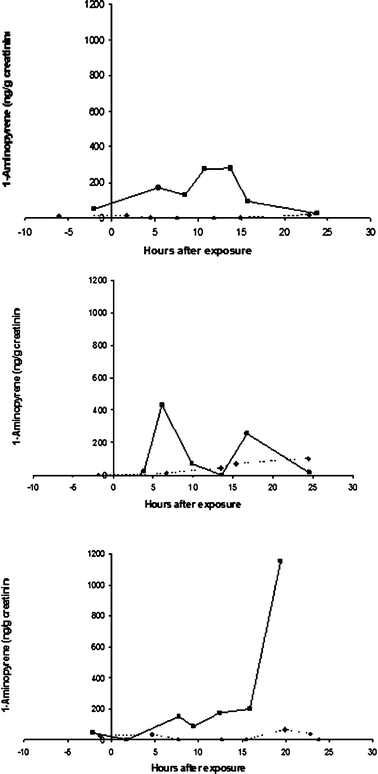 | ||
| Fig. 4 Examples of the time courses of untimed urinary 1-AP concentrations following DE and clean air exposures for three individuals, demonstrating the widely varying patterns of excretion. Time 0 is at the start of the 2 h exposure. For each individual, DE exposure is represented by square points connected by solid lines and clean air exposure by diamond points connected by broken lines. | ||
The signed rank test indicated that the time-weighted 1-AP urine concentrations following the DE exposures differed significantly from the concentrations following the clean air exposure (S = 265, p <0.0001). In fact, 33 out of 38 subjects (86.8%, 95% CI: 73.1, 97.6%) had higher time-weighted concentrations following the DE exposure than following the clean air exposure. This is reflected in the large difference in medians of the time-weighted concentrations for the 38 subjects between the two exposure conditions (138.7 ng g−1 for the DE and 21.7 ng g−1 for the clean air). Because the data were highly skewed, the differences in mean time-weighted concentrations were smaller (with large standard deviations) (324.0 ± 442.4 ng g−1 following the DE exposure and 234.4 ± 852.9 ng g−1 following the clean air exposure)
We also made comparisons of changes in concentrations from baseline to either first void or the peak (i.e., the highest concentrations among all the post-exposure spot urines). The signed rank tests revealed significant differences between the DE and CA control exposures as measured by the change from baseline to either of these post-exposure spot urine samples (p = 0.027 for first voids; p = 0.0026 for peak-concentration voids).
Discussion
The individual time-weighted averages of 1-AP concentrations in the spot urine samples collected in the 24 h after the DE exposure was, on average, 1.38 times that following the clean air control exposure. However, DE median was 6.4 times that of CA, and the vast majority of subjects (86.8%) had higher time-weighted average urine 1-AP concentrations following the DE exposure relative to the clean air exposure. Although tests of changes from baseline 1-AP concentrations to single sample post-exposure 1-AP concentrations were significant, there existed large within-subject variability in the different spot urine 1-AP concentrations collected over time and we observed no clear time course for changes in urine concentration on an aggregate population basis following the exposure (see Fig. 1).Our results are consistent with results of a study by Seidel et al.14 that showed measurable levels of 1-AP in 24 h urine collected from miners exposed to DE. Seidel et al.14 also found that 1-AP urine concentrations were higher among more highly-exposed underground miners compared to surface workers, but there was no unexposed control group. They found no apparent difference in urinary 1-AP concentrations between smoking and nonsmoking miners. This ability to distinguish between tobacco smoke and DE exposures may be especially useful in occupational epidemiology studies in which cigarette smoking is usually an important confounder. Our study of nonsmokers did not address this issue.
The concentrations of 1-AP in urines collected after the clean air exposure were in some cases within the range of concentrations after the DE exposure (Fig. 2). This may have resulted from dietary sources, which we did not assess, or from background environmental exposure to 1-nitropyrene. Our personal air sampling, with non-detectable results, indicates that environmental exposure to 1-nitropyrene was likely small compared to the controlled DE exposure in the Controlled Environment Facility (CEF). However, the personal air samples were integrated over the 24 h periods preceding or following the 1 h exposure, leaving open the possibility that relatively high-level but short-period exposures occurred during activities such as commuting prior to the morning exposure sessions. In this context, it should be noted that the majority of subjects were students attending classes on a large university campus. Diesel buses provide transportation between classes and between dormitories and parking lots and run across the campus frequently. Exposures to DE before and/or after CA and DE exposure could well have occurred while riding these buses and/or from being in campus locations where these buses pass and stop. By comparing urinary 1-AP concentrations after DE exposure to concentrations after CA exposures, we controlled to some extent for this individual variation in background exposure.
Supporting the conclusion that 1-nitropyrene exposure is widespread, Zwirner-Baier and Neumann9 detected hemoglobin adducts of 1-nitropyrene among garage workers, urban residents and rural residents, with no significant differences between the small groups studied.9 A recent study by Toriba et al.18 found measurable levels of several other metabolites of 1-nitropyrene, but not 1-AP, in urine of urban dwellers with assumed environmental exposure to DE.18 However, the urine metabolites in the Toriba et al.18 study were deconjugated with glucuronidase, not acid hydrolysis of actetylated conjugates, and therefore did not measure the acetylated conjugate of 1-AP. Our methods were sensitive enough to detect background levels of urinary 1-AP in a sample of individuals without occupational exposure to DE, but further study would be required to determine the source(s) of this background urinary 1-AP.
We observed a large degree of between- and within-subjects variability in urinary 1-AP concentrations, both after the DE exposure and the clean air exposure. For a few individuals, spot urine concentrations after the clean air exposure exceeded concentrations after the DE exposure. In some cases, this was due to low 1-AP concentrations in post-DE exposure spot urine samples. At least some of these urine samples were likely to have been collected before or after the appearance in the urine of 1-AP derived from exposure to 1-nitropyrene during the discrete 1 h DE exposure period. A source of variability inherent in urine bio-monitoring is the fact that spot samples of urine represent integration of the rate of 1-AP appearance in the urine over varying periods of time between voids. We attempted to address this in part, through use of time-weighted measure of urine concentrations. Despite this variability, we did see a statistically significant difference between the DE and the clean air exposures when we compared single post-exposure samples, either as first void or peak urine concentrations during the 24 h post-exposure period. The kinetic limitations potentially inherent in the use of spot urine sampling for assessing individual exposures are less problematic when employing such data to compare exposure levels in populations with differential exposures.
Inter-individual variability observed in this study could be accounted for by differences in the pharmacokinetics of 1-AP metabolism, including inherited or acquired enzyme status relevant to 1-nitropyrene metabolism. All subjects underwent nearly identical DE exposure conditions, but individual differences may have started with differences in absorbed dose of 1-nitropyrene (due to differences in respiration parameters, nose versus mouth breathing, pulmonary clearance rates, and other variables, none of which were assessed in this study). Studies of 1-nitropyrene metabolism in animals suggest that 1-AP may not be the primary metabolite of 1-nitropyrene in urine,19,20 and, even given the same absorbed dose of 1-AP, individual profiles of metabolites may vary. Studies in animal models indicate that although 1-nitropyrene may be reduced to 1-AP in the liver, it is primarily metabolized by cytochrome P450s in the liver to ring-hydroxylated metabolites, including the 3-, 6-, and 8-hydroxyl-1-nitropyrenes.15,19 Other rodent studies suggest that gut microflora may contribute significantly to reduction of 1-nitropyrene to 1-AP, with subsequent hydroxylation to 6- and 8- hydroxy-N-acetyl-1-aminopyrenes.21 It has been suggested that involvement of gut microflora, subsequent enterohepatic recirculation, and polymorphisms in N-acetyltransferases may contribute to variability in the metabolism of 1-nitropyrene.18 The relevance of these findings, which were based on an oral route of administration, to inhalation of 1-nitropyrene may be questioned. However, 1-nitropyrene in DE particles is poorly soluble and a portion of the inhaled dose may well reach the gut due to particle clearance mechanisms in the respiratory tract.1 The hydroxylated aminopyrene and hydroxylated nitropyrene metabolites identified in the animal models were measured in human urine in the Toriba et al.18 study of urban dwellers with presumed environmental inhalation exposure to 1-nitropyrene. In general, individual differences in metabolism of 1-nitropyrene may result in different patterns of urine metabolites, possibly due to individual differences in functional polymorphisms in enzymes such as cytochrome P450s and nitroreductase.22
Conclusions
The HPLC-fluorescence technique we used in the present study was sensitive enough to quantify urinary 1-AP in spot urine samples of non-occupationally exposed volunteers, with and without following a controlled 1 h DE exposure. Differences between pre- and post-exposure urinary 1-AP concentrations were greater after exposure to DE compared to clean air control. Large inter-individual variation in the time courses of 1-AP levels in the urine may limit the utility of spot samples for quantifying individual exposure to 1-nitropyrene as a marker of DE exposure, but this variability may be less problematic when employing such data to compare exposure levels in populations with differential exposures. The variable response to a relatively standardized exposure to DE suggests the need to further explore subject variables that may affect the conversion from inhaled 1-nitropyrene to urinary excretion of 1-AP. It is also worthwhile to examine whether steady-state urinary 1-AP concentrations are higher in routinely exposed individuals (e.g., people who live or work close to DE sources).Acknowledgements
Our sincere thanks go to the study volunteers who made this study possible. The study is funded by a Science-To-Achieve-Results (STAR) grant (#RD832097, PI: J. Zhang) from the US Environmental Protection Agency. The research of Dr Robert Laumbach, Dr Pamela Ohman-Strickland, Dr Nancy Fiedler, Dr Howard Kipen, Dr Paul Lioy, and Dr Junfeng Zhang is supported in part by a National Institute of Environmental Health Sciences research center grant (#P30 ES05022) and K08 ES013520 (Dr Laumbach). The views expressed in this paper are solely of the authors and do not necessarily reflect those of the funding agencies.References
- US EPA, Health Assessment Document for Diesel Engine Exhaust, U.S. Environmental Protection Agency, Office of Research and Development, National Center for Environmental Assessment, Washington, DC Office, 2002 Search PubMed.
- D. W. Dockery, C. A. Pope, 3, X. Xu, J. D. Spengler, J. H. Ware, M. E. Fay, B. G. Ferris, Jr and F. E. Speizer, N. Engl. J. Med., 1993, 329, 1753–1759 CrossRef CAS.
- J. M. Samet, F. Dominici, F. C. Curriero, I. Coursac and S. L. Zeger, N. Engl. J. Med., 2000, 343, 1742–1749 CrossRef CAS.
- C. A. Pope 3, J. B. Muhlestein, H. T. May, D. G. Renlund, J. L. Anderson and B. D. Home, Circulation, 2006, 114, 2443–2448 CrossRef.
- World Health Organization International Agency for Cancer Research (IARC), IARC Monogr. Eval. Carcinog. Risk Hum., 1989, 46, 41–45 Search PubMed.
- J. A. Bernstein, N. Alexis, C. Barnes, I. L. Bernstein, A. Nel, D. Peden, D. Diaz-Sanchez, S. M. Tarlo and P. B. Williams, J. Allergy Clin. Immunol., 2004, 114, 1116–1123 CrossRef.
- Health Effects Institute (HEI), Diesel Epidemiology Working Group, Research Directions to Improve Estimates of Human Exposure and Risk from Diesel Exhaust. Special Report, Health Effects Institute, Boston, MA, USA, 2002 Search PubMed.
- J. Jacob and A. Seidel, J. Chromatogr., B, 2002, 778, 31–47 CrossRef CAS.
- I. Zwirner-Baier and H. G. Neumann, Mutat. Res., 1999, 441, 135–144 CAS.
- H. A. Bamford, D. Z. Bezabeh, S. Schantz, S. A. Wise and J. E. Baker, Chemosphere, 2003, 50, 575–587 CrossRef CAS.
- J. Arey, B. Zielinska, R. Atkinson, A. M. Winer, T. Ramdahl and J. N. Pitts, Jr, Atmos. Environ., 1986, 20, 2339–2345 CrossRef CAS.
- N. Yamaki, T. Kohno, S. Ishiwata, H. Matsushita, K. Yoshihara, Y. Iida, T. Mizoguchi, S. Okuzawa, K. Sakamoto and H. Kachi, Dev. Toxicol. Environ. Sci., 1986, 13, 17–40 Search PubMed.
- T. Kinouchi, H. Tsutsui and Y. Ohnishi, Mutat. Res., 1986, 171, 105–113 CrossRef CAS.
- A. Seidel, D. Dahmann, H. Krekeler and J. Jacob, Int. J. Hyg. Environ. Health, 2002, 204, 333–338 CrossRef CAS.
- P. T. Scheepers, M. H. Martens, D. D. Velder, P. Fijneman, M. van Kerkoven, J. Noordhoek and R. P. Bos, Environ. Mol. Mutagen., 1995, 25, 134–147 CrossRef CAS.
- D. B. Barr, L. C. Wilder, S. P. Caudill, A. J. Gonzales, L. L. Needham and J. L. Pirkle, Environ. Health Perspect., 2005, 113, 192–200 CAS.
- World Health Organization, Biological Monitoring of Chemical Exposure in the Workplace, Finnish Institute of Occupational Health, Geneva, 1996 Search PubMed.
- A. Toriba, H. Kitaoka, R. L. Dills, S. Mizukami, K. Tanabe, N. Takeuchi, M. Ueno, T. Kameda, N. Tang, K. Hayakawa and C. D. Simpson, Chem. Res. Toxicol., 2007, 20, 999–1007 CrossRef CAS.
- L. Ball, M. J. Kohan, J. P. Inmon, L. D. Claxton and J. Lewtas, Carcinogenesis, 1984, 5, 1557–1564 CrossRef CAS.
- Y. M. van Bekkum, P. H. van den Broek, P. T. Scheepers, J. Noordhoek and R. P. Bos, Chem.-Biol. Interact., 1999, 117, 15–33 CrossRef CAS.
- K. El-Bayoumy, B. Reddy and S. S. Hecht, Carcinogenesis, 1984, 5, 1371–1373 CrossRef CAS.
- H. P. Rihs, B. Pesch, M. Kappler, S. Rabstein, B. Rossback, J. Angerer, M. Scherenberg, A. Adams, M. Wilhelm, A. Seidel and T. Bruning, Toxicol. Lett., 2005, 157, 241–255 CrossRef CAS.
| This journal is © The Royal Society of Chemistry 2009 |