Assessment of renewable energy potential through satellite data and numerical models
Francisco J.
Tapiador
*
Institute of Environmental Sciences, Faculty of Environmental Sciences, University of Castilla-La Mancha (UCLM), Toledo, Spain. E-mail: francisco.tapiador@uclm.es; Tel: +34 925 268 800 ext 5762
First published on 23rd September 2009
Abstract
There is an increasing use of satellite data and numerical models to assess the environmental constraints and energy potential of several renewable energies, namely solar, wind, hydropower, biomass and geothermal. This paper presents an overview of state of the art spatial technology and quantitative models in renewable energy research, with an emphasis on applications.
 Francisco J. Tapiador | Francisco J. Tapiador holds a Ramon y Cajal senior scientist position in Remote Sensing and lectures Meteorology and Climatology at the University of Castilla-La Mancha (UCLM, Toledo, Spain). He graduated in and received a Master degree in Geography and a PhD in Physics. As a postdoc, he spent three years at the University of Birmingham (UK), working in precipitation science. He has been a visiting scholar at the universities of Barcelona (Spain), Oklahoma/National Weather Center (USA), Paris (France), and Cambridge (UK). His current research interests are in the field of remote sensing of the atmosphere. |
Broader contextSatellites are becoming increasingly important in energy and environmental science. They offer objective, homogeneous, global, and physically-based estimates of key geophysical parameters such as solar radiation, wind speed and precipitation. This paper presents for the first time a critical and comprehensive overview of the theory and use of remote sensing technologies and numerical models for solar, wind, hydropower, biomass and geothermal energy potential assessment. The combination of these methods, which quantify the most suitable locations for energy plants and assess the potential and future state of the resource, with advances in chemical technology—which improve the efficiency of the technologies—can help the transition from a carbon-based economy to a fully-fledged renewable energy system tackling anthropogenic global warming. |
1 Introduction
Choosing a location for a renewable energy facility requires a precise knowledge of site climatology. Efficiency depends on the strength and variability of the resource, as it does the technological choice within the same type of renewable energy. Thus, within the solar energy field it would make more economic sense to implement a solar cell technology designed to maximize the integral of solar radiation in a place with frequent clear skies rather than in some other which is often covered by clouds, where a solar technology that takes advantage of peak power, rather than of integral power, may be preferable.The basic guidelines for such choices may seem common sense, but a more precise and objective estimate of the environmental constraints is instrumental to the emergence of tailored technologies, to the design of size and capacity of the facilities, and to cost/benefit analyses. Thus for instance, the optimal size of photovoltaic facilities is derived from the careful analysis of insolation series (which are increasingly calculated using satellite data).1 Another example of the link between environment and technological choice, this time in the context of wind power, is the type of wind turbine utilized, as it has to be chosen to withstand maximum expected gust speeds and its blades have to be constructed according to mean wind conditions. Environmental information in renewable research is also relevant if license fees or public rights are required to set up facilities, as is currently the case in Europe. Those rights are usually traded, and bids differ depending on the expected profits. It is both in the interest of the government and the companies to know which concessions could be more lucrative in order to adjust the asking price and the bids. Climatologies of the potential energy of the renewable resource are therefore of practical importance, and they can be assessed by satellites, in some cases, by models in some others, and by a combination of satellites and models to reinforce their relative strengths.
Models are especially useful in energy research in the context of climate change. The global warming scenario sets new research challenges for energy production. Whilst nuclear fusion is arguably the energy of the future, the technological challenges still to be solved preclude considering it as a feasible option, at least at the moment. In contrast, renewable energies are technologically mature and have enough potential to cover present energy demands without increasing emissions, so the focus should be put on them. In the short and medium term, a mix of resources is widely seen as key in guaranteeing energy production and meeting international treaties for reducing CO2 emissions. Thus, it has been calculated that offsetting 50% of all future growth in thermal electricity generation by photovoltaics would reduce annual global carbon dioxide emission from projected increased levels by 10% in 20 years and 32% in 50 years.2
Another aspect of climate change on renewable energies relates to the changes in the weather patterns that may affect production and economic performance of, for instance, wind facilities.3 Turbines are shut down at wind speeds greater than 25 m/s to avoid gearbox burnout, so it is important to have an estimate of the future frequency of strong winds or gales in order to calculate the efficiency. Stormy weather in some areas may require new materials to be applied to the tower or to the turbines to withstand larger stresses at lower cost. Carbon fibre reinforced resins are already used in blades and other components, but new polymeric materials with high strength-to-weight ratio such as carbon nanotube reinforced foams4 could be a must in the future.
The quantitative estimation of the expected environmental conditions and the associated future energy potential can only be done through climate models. However, satellite technology can assist the development of renewable energies in a variety of ways. Thus for example, the forthcoming SMOS satellite will provide improved estimates of the extent and changes in sea salinity, an important parameter for those designing and managing offshore wind farms (apart from other factors such as distance to shore, high cost and energy transmission), since salts generate corrosion and degradation, shortening the life cycle of materials and thus limiting the benefits of the facilities. Also, it is expected that other satellite missions such as the GPM mission can improve the quantification of the hydrological resources at basin level, allowing for better management of hydropower. Tidal energy projects can also benefit from satellite information. Tides are predictable, but local variations due to bathimetry and wind stress can be assessed by satellite altimetry, thereby assisting the identification of suitable locations for the turbines.
Within the wide range of direct and lateral applications of satellite science and models to renewable energies, this paper focuses on their role in assessing the energy potential of solar, wind, hydropower, biomass and geothermal resources. Also, as quantitative models, and chiefly amongst them Numerical Weather Prediction (NWP) models, Global Circulation Models (GCM) and Regional Climate Models (RCM), are also valuable in assessing the energy potential of the renewables, and as such, their role and current status will also be discussed. Whereas satellites are more precise in estimating for instance cloud cover, multidecadal simulations of the climate are useful for long-term planning of facilities. For daily operations, short-term forecasting of the weather conditions is relevant for energy trade, power plant management scheduling and grid congestion management. The complementary use of satellites and NWP through data assimilation benefits those daily activities as it improves the quality of the forecasts.5
2 Solar energy
Meteorological parameters play a key role in the economic assessment of solar thermal power stations. The quantity, intensity and temporal distribution of solar irradiation considerably affect the electricity production cost6 and thus the efficiency of solar plants. The quality of the radiation, i.e., whether radiation is direct (not affected by clouds) or diffuse (resulting from cloud absorption and multiple scattering in the atmosphere) is also important. In the case of focusing systems for generating electricity, an estimate of the direct radiation is needed. Planning solar concentration systems to generate energy for mining activities such as zeolite dessication,7 or water desalination requires an estimate of the total hours of sunshine over a period. For other solar technologies (thermal and photovoltaic), the diffuse part of solar radiation is also at play, and it therefore needs to be considered at the design stage, and in its daily operations.Colle et al.8 have shown that uncertainties in life cycle savings for solar thermal and photovoltaic systems are linearly correlated with uncertainty in the radiation data. It is therefore important to analyze the amount of both direct and diffuse components and to characterize the uncertainty bounds and the variability. The specific data requirements in terms of temporal resolution depend on the application. Fixed and tracking plate systems require monthly hemispherical tilt and tracking data, whereas focusing systems require direct normal solar estimates.9 The temporal sampling is also dependent on application. The design and modelling of installations need hourly data and to evaluate the system response to clouds sub-hourly, daily power profiles are desired (Table 1).
| Type of data | Time resolution | Application |
|---|---|---|
| a From Myers (2005), Table 3. | ||
| Hemispherical, vertical surface, azimuth | Seasonal/daily | Glazing energy balance (energy or power) |
| Illuminance, vertical surface, azimuth | Seasonal/daily | Daylighting |
| Hemispherical tilt | Monthly/annual | Fixed flat plate |
| Hemispherical tracking | Monthly/annual | Tracking flat plate |
| Direct normal | Monthly/annual | Focusing/concentrating systems |
| Sunshape variation (disk + circumsolar) | Variable | Concentrating tracking collector |
| Monthly mean daily total | Monthly/daily | Sizing and design specs, economics |
| Monthly mean | Monthly | Sizing and design specs, economics |
| Daily profiles | Hourly | System simulation modelling and rating |
| 8760 hourly data for year hemispherical and/or direct | Hourly | System simulation, economic analysis (multiple years for min/max performance) |
| 10–30 year hourly power | Hourly | Performance and economics, system lifetime |
| Daily profiles power | Sub-hourly | System response to clouds, etc. |
Both satellites and numerical weather prediction models could be potentially used to model solar radiation, but comparison experiments have shown that satellites outperform NWP models at the spatial resolutions required for practical energy applications.10 Current NWP are not precise enough in determining cloud cover due in part to the still large significant and continuing uncertainties in cloud modelling and to the very high spatial resolutions (a few kilometers) required in operation, which would require explicit physics for many processes, escalating the number of calculations required to the point of making the modelling impractical in computational terms.
Satellites, on the other hand, can provide measurements of cloud cover at high spatial and temporal resolution, but cannot be used to forecast solar radiation beyond a few hours (nowcasting). This makes NWP still useful in providing short-range approximate forecasts of solar radiation (72 hours). NWP are also required to provide estimates of columnar water vapor, a parameter which is used in the radiative transfer calculations needed to derive satellite retrievals of solar radiation, as described below.
Solar radiation is measured at ground level using pyranometers, pyroheliomers, and shaded pyronometers, which act as truth-data for validation experiments. However, a balanced comparison between ground stations and satellites in terms of data requirements versus capabilities benefits satellites. It has been shown that ground stations cannot provide a good enough estimate of the regional solar irradiation in areas of contrasted relief and/or climate. Thus, by calculating the semivariance at several lag distances using data from the meteorological network, Muselli et al.11 showed the limitations of spatial interpolation techniques to provide precise estimates of areal solar irradiance, making the case for satellite as an alternative to ground stations where site-specific information over extensive areas is required. With the advent of improved resolution satellites in the next decade (Meteosat Third Generation, MTG), the gap will probably widen. MTG will have a spatial resolution of 1 km and a temporal resolution of 15 minutes, both values well within the planning needs of solar plants. The use of ground stations will then be focused on the calibration and validation (cal/val) of satellite estimates and on assisting in operations.
2.1 Satellite retrieval
The methods for deriving solar energy potential through satellite data have evolved from the early qualitative methods using hard-copy satellite images to quantitative and radiative transfer methods. The comparison of the overview provided by Hay12,13 for the early nineties with current methods shows a steady progression from empirical methods correlating ground estimates of solar radiation with cloud parameters derived from a few bands, to physically-based models using satellite imagery at several wavelengths. In the past, direct radiation was estimated through satellite orbital parameters and trigonometric relationships on the earth/satellite/sun geometry, while the diffuse component was calculated through regression.14 It was soon found, however, that regression models for estimating the diffuse radiation are highly dependent on the site. Those relationships that were developed in Europe or North America proved to be inadequate for other areas.15 Notwithstanding that empirical relationships still persist for modelling complicated interactions, the transition to more physically-based approaches in the last decade is clear, and radiative transfer can be considered as mainstream in the satellite retrieval of solar irradiation.The blossoming of telecommunications and cheap computing storage permitted the emergence of databases of solar radiation to provide the estimates for interested parties. In Europe, the Satel-Light project (1996–1998) employed satellite data to generate estimates of both direct and diffuse components of the solar radiation. The spatial and the temporal sampling of the Meteosat satellite (3 km and 30 minutes) and the relatively long series still make the products useful for applications such as building design and feasibility studies for solar plants. Fig. 1 shows an example of the calculations that could be derived from the data, which is freely available on the web albeit with some limitations in terms of access to quantitative information. The spectral analyses of the time series shows the stability of the solar resource (note the conspicuous peaks over an homogeneous background noise). The series are dominated by the diurnal and seasonal cycles, which represent a difference over wind energy, more intermittent, or hydropower, whose production can be adapted to demand.
 | ||
| Fig. 1 Global Horizontal Irradiance (sum of direct solar radiation and diffuse solar radiation; red time series) and Direct Horizontal Irradiance (green time series) for 39°52′N 4°2′W, Alt: 446 m (Toledo, Spain), from 1 Jan 1996 to 31 Dec 2000. Data correspond to satellite estimates every 30 minutes. The spectra of the time series show the temporal structure of the signals, from high period cycles (the largest peak at ∼0.0208 points up the daily cycle) to the Nyquist frequency (0.5 cycles–one hour period). The higher the peak, the more the net contribution of that peak to the time series. A theoretical series presenting a single peak spectrum centred in 0.0208 would indicate that the series is the result of the daily solar cycle alone. In real series, the signal is made of the daily solar cycle plus the weather effects, which appear as weaker peaks at several other frequencies. Original data from the Satel-Light project. | ||
More ready-to-use products become available as the algorithms evolve to more elaborate methods requiring intensive use of computing power, and with the advent of growing needs for information for field applications. Additionally, in the European Union, the HELIOSAT project was an attempt to generate high-quality solar radiation from the existing Earth observation technologies at the time (2004 for HELIOSAT-3 follow-up). Another database that has recently become available is the EUMETSAT's Land Satellite Application Facility (SAF). The archive provides access to hemispheric estimates of solar radiation, using state of the art modelling of the problem. The ‘downwelling surface shortwave radiation flux’ (DSSF) product is also broadcast in near-real time through EUMETCAST, which permits a practical use in daily operations with a simple antenna and minimum technological effort. The current SAF archive gathers data from the whole Meteosat era, allowing users to derive maps and time series for applications such as optimizing the location of solar plants in a region.
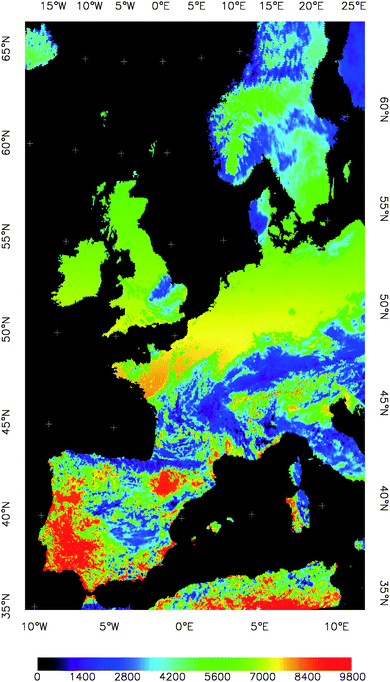
The planned reprocessing of the EUMETSAT UMARF archive would improve the characterisation of solar resources by increasing the number of samples, which would decrease the uncertainties in the solar potential assessment of Europe and Africa.
2.2 Physical retrieval
The physical variable of interest for solar energy applications is the flux (energy per cross-section per unit time) of the solar radiation at earth surface. The flux has a short wavelength following Planck's Law since the Sun's photosphere is at about 6000K. The DSSF is defined as: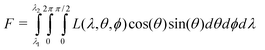 | (1) |
| F ≈ 1370 {1 + 0.033 cos[2π(J − 3)/365]} cos(θs) T | (2) |
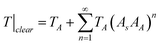
For clear air, the effective transmittance T depends on the atmospheric transmittance TA, which is the result of direct solar radiation plus diffuse radiation. The diffuse component can be modeled as being composed of three parts: Rayleigh-scattered diffuse irradiance; aerosol-scattered diffuse irradiance; and irradiance arising out of multiple reflections between the atmosphere and the ground.
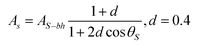
Several schemes have been used to calculated the effective transmittance from satellite data. The rationale of the methods is well exemplified by the process followed to generate the EUMETSAT's DSSF, which is reviewed here. The T for clear air is modeled in the DSSF as:
 | (3) |
 | (4) |
| AA = a′ + b′/V | (5) |
In (4), AS-bh is the bi-hemispherical variant of the surface albedo, and the quotient parameterizes the diurnal cycle.17,18 In (5), a′ and b′ are parameters (0.088 and 0.456) and V is the visibility (20 km as standard value). As the second summand in (3) is a geometric series, it follows that:
| T|clear = TA(1 − ASAA)−1 | (6) |
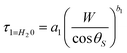
The value of TA can be parameterised as a function of the separated effects of m gases of the atmosphere:19
| TA = exp(−τ1 − τ2 − … − τm) | (7) |
For the main absorbing gases of the atmosphere at solar wavelengths these values are used:
 | (8) |
 | (9) |
 | (10) |
For cloudy skies, the model becomes more complicated, and several additional assumptions have to be made. A similar discussion to that for the direct component yields an expression close to (6), here for T in cloudy conditions:
| T|cloudy = TATC + (1 − ASACTbc)−1 | (11) |
Equation (11) reveals the need for satellite data in order to precisely estimate the solar radiation. The cloud transmittance combines multiplicatively with the atmospheric transmittance (TA), while the cloud albedo also affects the effective transmittance (cfr. Fig. 2). If the boundaries of the cloud cover are not precisely estimated, the estimation would be strongly affected, which explains why NWPs tend to perform worse than satellites in validation exercises, owing to their lower spatial resolution and physical parameterizations.
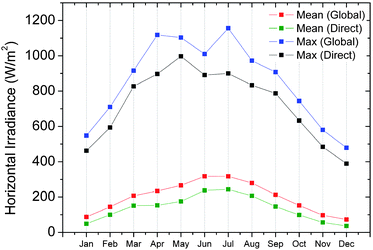 | ||
| Fig. 2 Monthly accumulated values for the data in Fig. 1. The mean values for global and direct irradiance includes all the available time slots. | ||
Equation (11) also epitomizes the challenges facing satellite estimation of the solar radiation. The interplay between cloud albedo and transmittance depends on the cloud type, from thin cirrus with high albedo to less reflective but more absorptive cumulus; and on cloud microphysics, from drop size distribution to relative content and phase of the water species. The Tbc factor depends on the height of the cloud base, and the three transmittances (TA, Tc and Tbc) would need to be split in the presence of multilayered cloud systems. All these factors need to be considered in order to improve the estimates, making full physical modelling a complex task. In practice, the interaction of solar radiation with clouds still needs to be parameterised and empirically-adjusted to validation data.
Fig. 3 shows an example of the DSSF from the Land SAF. It corresponds to an instantaneous estimate, and shows the latitudinal gradient of the DSSF, as well as the variability due to cloud cover.
 | ||
| Fig. 3 Estimate of the Downwelling Surface Shortwave Radiation Flux (DSSF) over land for 4 Apr 2007 at noon. Units are W/m2. Original data from the EUMESAT's Land Satellite Application Facility (Land-SAF). | ||
Estimates of the solar irradiation a few hours ahead are useful for planning operations. By using successive satellite estimates of instantaneous, real time solar irradiation, it is possible to generate a nowcasting of the solar radiation. The nowcasting strategy consists of calculating the cloud motion winds (CMW) between the last two or three available satellite images using correlation-based20 or fluid-dynamics21 algorithms, which then extrapolates the latest estimate of solar radiation using the CMWs to simulate a synthetic new image. The procedure assumes negligible changes in the short-term, large-area dynamics, which is a reasonable hypothesis. The estimates of future solar input represents an advantage to the producer, as it enables the negotiation of a price for electricity a few hours ahead.
The effects of climate change on solar radiation have been investigated for the US case,22 concluding that increases in GHG would lead to a decrease in the seasonal-mean daily global radiation availability in the range of 0–20% for the mid 21st century. The simulations from Regional Climate Models nested on a Global Model found a larger decrease in the western US during fall, winter, and spring, whereas for small areas in the southern and northwestern US some increases in global radiation appeared.
2.3 Space solar power stations
It is briefly worth mentioning a direct application of satellite technology to solar energy, namely the use of one or several satellites to generate large amounts of electricity from large-scale, space-based solar power systems. The idea is to concentrate solar radiation in space, and to send the energy back to earth in the form of microwave radiation (MW). The MW beam would then be captured by a ground antenna and the electricity would be distributed to the grid. The prospects and technological challenges for, to name a few, a space solar power (SSP) system, an Integrated Symmetrical Concentrator (ISC), a North-South symmetrical array, and a reflector system named Abacus have been investigated over the previous few decades.23,24 Proposals such as the SunTower concept aim to demonstrate the technical and commercial feasibility of SSP systems by exploiting newly available technologies for lowering costs, which impeded SSP technology taking off from blueprints in the seventies.Energy potential studies show that such systems may be competitive providing the technological challenges can be solved. The same applies to the Japanese initiative of deploying a 1 GW SSP. Yamagiwa25 analysed the environmental and economic trade-offs of this technology, which may be viable if advances in material science can produce advanced materials with a large strength-to-weight ratio. While advances in nanocomposites26,27 are bridging the gap between science, technology and requirements, and in spite of the potential interest in the idea, in the event of an (unlikely) catastrophic climate change, it is improbable that SSP systems will become a reality in the near future given the risks associated with technical failures, accidents or misuse. Nonetheless, the technology is far from being discarded and new designs are continuously proposed to redefine the concept. Thus, Takeichi28 has delineated the mechanical and orbital requirements for a formation of satellites in GEO orbit that would concentrate VIS-IR solar radiation and transport the energy in the form of MW radiation or as a laser beam. The proposal focuses on solving the problems associated with mobile parts, and would mitigate the costs of orbit control by taking advantage of the solar wind for orbital transfer (i.e. solar sailing).
3 Wind energy
In a sense, the assessment of energy potential for wind is the mirror image of solar. As discussed above, satellites outperform numerical models for solar assessment and forecasting. In the case of wind, however, models seem to provide better results when compared with validation data. One of the reasons for this is the limited temporal resolution of those satellites that possess the capability of measuring wind speed. Owing to its polar orbits, those satellites revisit the same place only twice a day, thus given a snapshot estimate of the wind speed. Besides, satellite estimates of wind speed are limited to ocean areas. Satellites, however provide consistent estimates (within ±1 m/s),29 and can help to improve the performances of NWP models through data assimilation methods.3.1 Probabilistic modelling
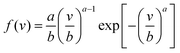
The identification of wind energy is made by investigating detailed knowledge of the wind characteristics, such as speed, direction, continuity, and availability.30 An usual variable to characterize this energy is the wind potential, which is derived from the probability distribution function (pdf). Thus, if f(v) is the pdf of the wind speed modulus v, the wind power per unit area Pm is calculated as: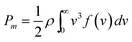 | (12) |
 | (13) |
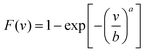
The cumulative distribution function (cdf) is:
 | (14) |
The parameters for the cdf can be estimated using the method of the moments, maximum likelihood or others. Thus for instance Gökcek et al.30 use:
 | (15) |
 | (16) |
![[v with combining circumflex]](https://www.rsc.org/images/entities/i_char_0076_0302.gif) and σ are the sample mean and standard deviation resp. of the wind speed modulus. With this parameter estimation method, the wind power per unit area becomes:
and σ are the sample mean and standard deviation resp. of the wind speed modulus. With this parameter estimation method, the wind power per unit area becomes: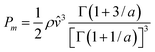 | (17) |
In spite of the widespread use of the Weibull distribution in wind potential research, it has been argued that the maximum entropy method (MEM) estimates wind power density more accurately.31 From a physical point of view, the key advantage of the MEM is that it provides a theoretical foundation for selecting the pdf. Theory dictates that the MEM gives the most likely, less biased estimate of the pdf compatible with the constraints imposed by the problem.33 The constraints for the MEM in wind modelling can be in the form of either large series averaged values of wind speed or as any other measurement that can characterize the physics of the problem. Thus, the following constraints for the conservation of mass (m), momentum (p) and energy (E) have been proposed:34
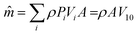 | (18) |
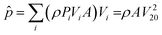 | (19) |
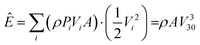 | (20) |
The result of maximizing the entropy subject to (18, 19, 20) or an alternative set of constraints is a pdf in the form of:
| f(v) = exp(−λ0 − λ1Vi − λ2Vi2 − λ3Vi3) | (21) |
 | (22) |
 | (23) |
The parameters of the Weibull distribution in this case are derived as:35
| E[va] = ba | (24) |
| E[lnv] = lnb + Ψ(1)/a | (25) |
Other distributions such as extreme value may also be useful to estimate wind energy potential. If the tails of the distribution are of interest, subexponential distributions are well suited for leptokurtic distributions such as maximum wind speeds.
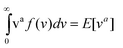
Fig. 4 illustrates the differences between fitting hourly wind speed averages to Maximum Entropy, Lognormal, Extreme Value and Weibull distributions. The plots on the right are log-scaled on the y-axis to improve visualization of the tails of the distributions. The differences in the pdf are noticeable, especially for sustained strong winds (tails of the pdfs, right plots).
 | ||
| Fig. 4 Best fits for hourly wind observations (from 2000 to 2008) using four distributions. The y-axes of the pdfs on the right are in log scale to highlight the tails of the distributions. The red line indicates the best fit for each model. Dark blue paired lines mark the 0.95 confidence limits; green outermost paired lines bound the 0.95 confidence prediction limits. Statistics are shown in Table 2. Original data from the Torun Centre for Astronomy, Nicolaus Copernicus University (Poland), made available by K.M. Borkowski. | ||
The lower wind power per unit area is that of the Extreme value distribution, in spite of its apparent good fit in the tail, as those few values have a limited contribution to the overall power, which is dominated by the values around the mode of the pdf. In ascending order of Pm, the distributions are sorted out as follows: Extreme value, Maximum Entropy, Weibull and Lognormal. Statistics are shown in Table 2. Given the good scores of the Extreme value distribution, one might wonder if the remaining distributions are not overestimating wind power in this case. Nevertheless, this issue is only relatively important regarding operations given the actual closeness of the scores and the fact that engineering constraints and Betz' Law have a stronger influence on actual available power. In order to assess the wind energy potential of a site, or to find the best place in a region, it is the relative differences between sites which matters, so the only requirement is consistency and using the same pdf and parameter estimation method.
Regardless of the parameterization or distribution chosen, the problem of assessing wind energy potential is therefore reduced to gather enough data to characterize the wind. To that end, either ground, satellite or model information have been used.
3.2 Satellite estimates of wind power
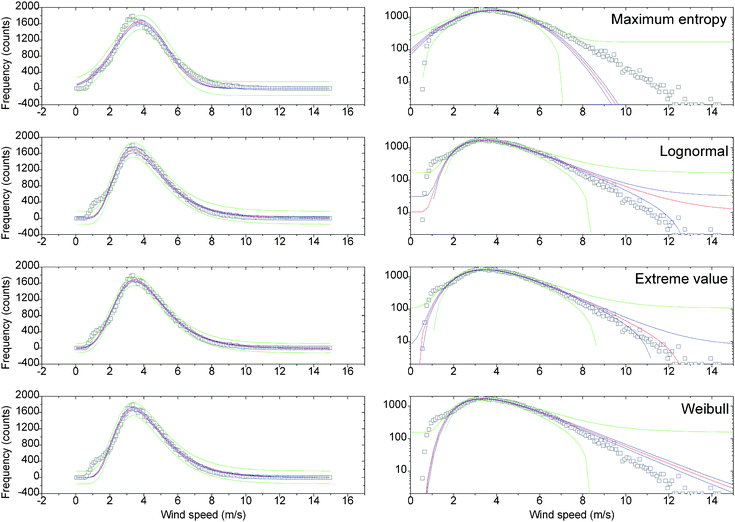
Satellites can be used to derive maps of wind speed, wind power density, and practical turbine output over the sea.36 As mentioned above, assessing wind energy potential from a satellite is currently limited to the sea surface as the technique is based on the relationship between wind, the roughness produced on the ocean skin layer by the wind stress, and the corresponding backscattered signal of the microwave beam. Despite the technological problems of operating in open waters, offshore location is an alternative to land due to the potential of very high wind power as a result of lower friction. For planning, annually-integrated and seasonal maps of the intra-annual variation of the resource are more useful because they have larger temporal and spatial resolution, so satellites and NWP models are fit for this task.As Fig. 5 illustrates, the properties of the scattered radar wave are highly dependent on the surface roughness. Smooth surfaces such as oil spill in the figure show little reflection, whereas highly contrasted surfaces over land correspond with a maximum back-scattered signal. The sea surface gives different responses depending on the wind stress (compare the low signal in the calm waters within deep estuaries with that of open waters) and this fact permits an estimate of the actual surface wind speed under some reasonable assumptions.
 | ||
| Fig. 5 ENVISAT's ASAR wide-swath image illustrating surface dependence on the scattered radar signal. The darkest areas within the image swath correspond to smooth surfaces (here, the Prestige oil spill). The lighter area on the left is the northwest coast of Spain. Estimates of wind speed over the ocean rely on the empirical relationship between backscattered radar signal and open sea surface roughness. Original data from ESA. | ||
Once the surface wind is estimated, the variation of the wind speed with height is approximated through this relationship:
 | (26) |
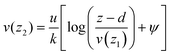 | (27) |
The limitation of satellite retrieval of wind to the sea surface is obviously determinant for landlocked countries, but is less significant for others depending on coastal length. Only in a 5° coastal strip off Brazil (about 500 km), researchers using satellite data and complementary data36 have calculated a total resource of 102 GW average electrical production, which amounts to the entire electricity demand of the country.
The satellite sensors that can measure ocean wind are Scatterometers and Synthetic Aperture Radars (SAR). The scatterometer is a monostatic non-nadir looking real aperture radar. It retrieves the normalized radar cross-section at different angles to infer wind speed and direction. Backscatter coefficients are correlated to wind speed through the roughness of the open sea.37 The algorithms depend on whether coastal or open water areas are considered, an issue to be taken into account when using satellite-derived winds to avoid biases.
ERS SAR scenes and Envisat's ASAR (Advanced Synthetic Aperture Radar) operating at C-band frequency have been used to derive wind maps in several parts of the world. The ASAR has the potential of retrieving sea surface wind field more accurately than the older ERS-1/2 AMI because the ASAR can collect higher resolution images with a various viewing geometry and simultaneously in two polarization modes. Wind climate maps based on satellite SAR images help to delineate spatial variations in the wind speed,38 which are of interest to those planning offshore wind farms. The Japanese JERS satellite has also been used to derive wind maps. Also, the QuikSCAT routinely provides an ocean wind product at a resolution of 25 km.
The composition of the QuikSCAT orbits has permitted the construction of a global wind climatology39 (Fig. 6). The strong winds at high latitudes are noticeable, as they represent regional differences due to ocean currents such as the upwelling in the Peruvian coast. Both the comparison of those offshore satellite scatterometer winds and global model data show good agreement with in situ data. Fig. 6 also helps explain the importance of offshore wind resources for Europe.
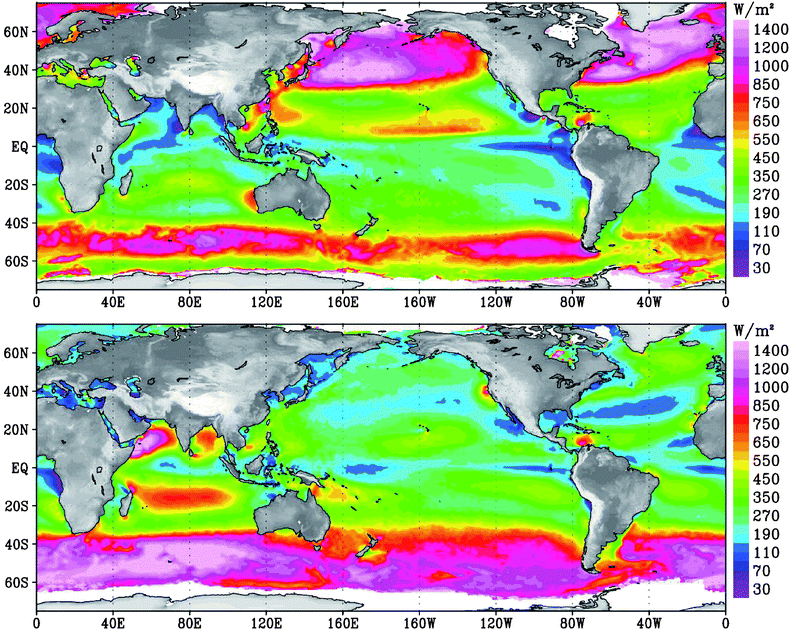 | ||
| Fig. 6 QuikSCAT composite of wind power density over global oceans for Northern Hemisphere winter (top panel) and summer (lower panel). Just considering the Betz limit, it is deemed that a wind turbine would not extract more than 59% of this available wind power. The actual recoupable energy is some two orders of magnitude lower than is indicated here because of turbine spacing and other engineering constraints (such as the choice of floating or fixed platforms). Other factors to consider include distance from shore, water depth, location of shipping lanes and fisheries. Image courtesy of Tim Liu, NASA JPL. | ||
The UK, Germany and Denmark have large offshore wind programs (>30 GW for the British case alone) that aim to take advantage of the prevailing atmospheric circulation at high latitudes. The satellite-calculated wind power density over most of northern Europe exceeds 1000 W/m2 in wintertime, making this energy suitable for a region where solar energy is far less profitable than in southern Europe.
The downstream effects of offshore wind farms has also been investigated using remote sensing technology. Christiansen and Hasager40 used ERS-2 SAR and Envisat ASAR to study the wake effect on two large offshore wind farms in Denmark, obtaining changes averaging 8–9% in the vicinity of the turbines, regaining 2% of the free steam velocity over 5–20 km depending on conditions. The result is relevant as it demonstrates the environmental effects of these facilities. Thus, the planning of wind farms needs to account for decreasing wind power from other wind farms. Also, placement of large offshore wind farms could mitigate the adverse wind climatology in places with strong winds affecting human activities as a subproduct of transforming kinetic energy into electricity. The cooling effect of wind farms over the environment has also been investigated, with estimates of about 0.25 K/Tw.41
3.3 Numerical weather models in wind potential assessment
The pdf of wind speeds can also be estimated using numerical models. Kiss and Jánosi42 used ERA-40 data to derive the parameters of the Weibull distribution over Europe. The results (Fig. 7) profit from the homogeneity of the reanalysis, which embeds most of the available observations into a dynamically-consistent model. The sea-land differences are apparent for the shape parameter, while the scale parameter marks the regional differences related to mesocale circulation and topography.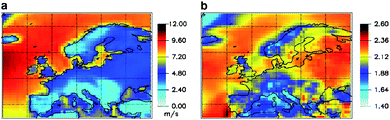 | ||
| Fig. 7 Geographical distributions of the shape (a) and scale (b) parameters of maximum likelihood Weibull fits derived from ERA-40 data (from ref. 42). | ||
The forecast of wind power is important for daily operations. Details such as diurnal cycles (e.g. strong winds at night, weak winds during the day, seasonality) can have a profound impact on the utility of the resource and they are not captured by the pdf. NWP models permit a thorough analysis at high spatial and temporal resolutions through for instance spectral analysis. Attempts to provide accurate predictions include the use of NWP models, satellite data and artificial intelligence models such as genetic algorithms, one of which has been found significantly superior to persistence and autoregressive techniques in a case study in India.43 Neural networks have also been used to forecast wind speed.44 Modelling, however, is not straightforward over complex terrains. Fig. 8 illustrates a NWP output for a case study in Spain.
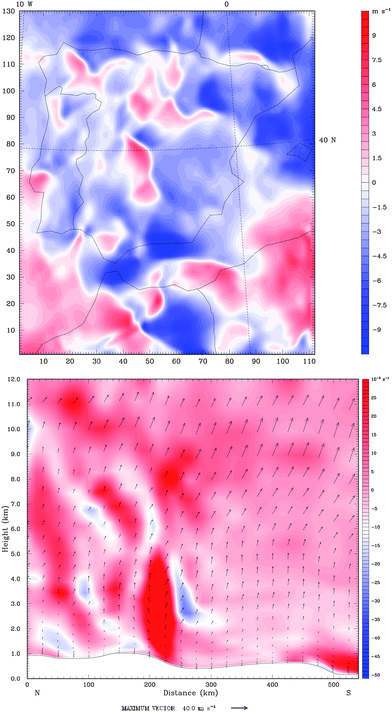 | ||
| Fig. 8 Example of a NWP model output for 21:00 UTC 2 Oct 2007. Top: horizontal wind speed in the x direction (units: m s−1). Bottom: vertical cross-section of the atmosphere from 42.44N,−4.68W to 37.44N,−4.97W depicting the vertical velocities (arrows) and the relative vorticity (colours, in s−1). | ||
No matter the fine spatial resolution used, NWP outputs need postprocessing to be useful for wind potential assessment. Model Output Statistics (MOS) are routinely used to that end. MOS are multilinear regression equations derived by screening potential model-forecast variables as predictors and ground data as predictant. They are required to account for local variation in surface weather that the NWP models cannot fully capture. The method produces forecasts that to some extent account for the random and systematic errors in the numerical weather prediction model. However, the improvement in the forecast is at the expense of introducing empirical relationships into the physical modelling.
Exercises comparing NWP models and several satellites have found important discrepancies depending on model version and algorithm type. Using a sample of 7 years of data, Boutin et al.29 compared two different versions of the ECMWF model with Geosat, SSM/I and ERS-1 estimates of wind speed. A figure worth remembering from that work is that post-1991 ECMWF wind speed estimates are 5 per cent less than those of SSM/I or ERS-1.
Some of the challenges for wind assessment potential45 are the need to improve our knowledge of and ability to forecast both mean and turbulent structure of the lowest 200 m of the atmosphere; the validation of new theories and models in complex flows; the development of wind forecasting technologies; data assimilation; the integration of models of complementary scales; and the quantification of the uncertainties in the estimates. Regarding the latter, one can only agree with Barthelmie and Pryor46 when they argue that aside from known issues regarding absolute accuracy and precision there are a number of biases inherent in remote retrieval of wind speeds using satellite-borne instrumentation, and that such biases lead to overestimation of the wind which are of sufficient magnitude to merit further consideration, and to ask pdf parameterizations to be provided with error bars. While it is clear that new observations are required, the combined use of satellites and NWP models appears a promising technique.
3.4 Climate change effects on wind power resources
It is sensible to assume that projected climate changes under increasing greenhouse gases scenarios would lead to changes in the wind patterns and thus in the potential of the resource. Assessing how changes on a mesoscale would translate locally is not straightforward, as wind presents strong variability depending on scale. Quantifiying the extent of such changes has been investigated using statistical methods and physical models. A simple estimate of climate sensitivity of marine energy was provided by Harrison et al.,3 focusing on how changes in mean wind speed influence wind and wave energy production and economics. However, regional estimates require more focalised information. Direct statistical downscaling of Global Circulation Models (GCM) projections through nonlinear methods such as neural networks47 can be used to that end. Those models assume that current relationships between local observed climate and mesocale simulations will hold in the future. Since this is a reasonable hypothesis, the results can be interpreted as projected changes in wind power.The physical methods follow a different approach by using the GCM simulations as input to Regional Climate Models (RCMs). A RCM embeds the same physics of the GCM but over a limited area. The RCMs receive the lateral and boundary conditions from a GCM, increase the spatial and temporal resolution of the estimates using smaller grid sizes and time steps, and parameterise the physical processes that remain important at the resolution chosen. The theoretical need of GCM downscaling using either dynamic downscaling or RCMs emerges as a real requirement as experiments are carried out. Thus, Sailor et al.48 showed the discrepancies between GCMs and observations when using data from four GCMs to investigate scenarios of climate change impacts on wind power generation potential in the Northwest United States. Crucially, they also found that dynamic downscaling helped resolve the differences in the GCMs, so justifying the added value of the RCMs.
A necessary but by no means sufficient condition for considering the future climate simulations from RCMs as proper estimates of real changes in the atmosphere is their ability to reproduce current, observed climate. In the case of wind projections, several experiments have successfully proven the agreement, albeit with uncertainties that are large enough to avoid drawing definitive conclusions. Thus, simulated wind fields from the RCAO model with boundary conditions derived from two GCMs (ECHAM4/OPYC3 AOGCM and the HadAM3H atmosphere-only GCM) compares well with reanalysis data for current climate (1961–1990).49 However, even accounting for the fact that model outputs would compare better with reanalysis than with observations only, the differences between future and present climates were of similar magnitude to differences between present climate and reanalysis. They also found a high degree of sensitivity to the boundary conditions, with simulations conducted using boundary conditions from the HadAM3H exhibiting slight declines or no change in wind speed and energy density between 1961–1990 and 2071–2100. Another example in the US obtained similar conclusions using a RCM nested on two GCM suggesting that the US will see reduced wind speeds of 1.0 to 3.2% in the next 50 years, and 1.4 to 4.5% over the next 100 years (Fig. 9).50 Nonetheless, they also found a large uncertainty in the results. Another experiment concluded that the impact of the climate change scenarios on wind power in the US may be as high as a 40% reduction in summertime generation potential.48 In Europe, evidence of model skill in simulation of wind extremes is mixed, but confidence in future changes in windiness in Europe remains relatively low. Most PRUDENCE51 RCMs, while quite realistic over sea, severely underestimate the occurrence of very high wind speeds over land and coastal areas.52 Realistic frequencies of high wind speeds were only found in two models that used a gust parameterization to mimic the large local and temporal variability of near-surface winds over land.53 Over ocean, projections are deemed as being more realistic. In the UK case, other experiments have found seasonal changes in potential onshore wind production, with a general increase in winter production and a summer decrease.54
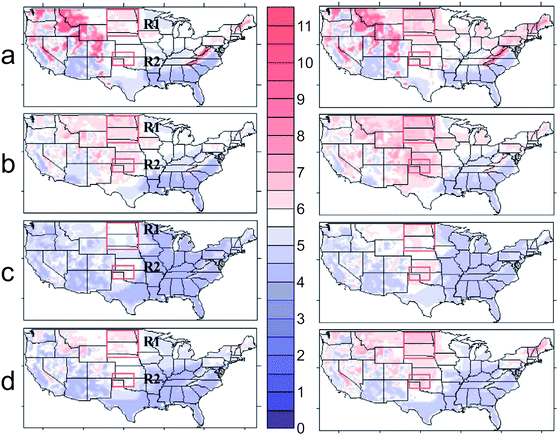 | ||
| Fig. 9 Present-climate wind speeds (m/s) for the period 1948–1978 at 0.5° × 0.5° resolution in the US for (a) Jan–Mar, (b) Apr–Jun, (c) Jul–Sep, and (d) Oct–Dec periods (left column), compared with Hadley Centre HADCM II GCM predicted wind speed for 2050 (right column). From ref. 50. | ||
4 Hydropower
According to the World Energy Council, hydropower generates about one-fifth of the World's electricity. Although hydropower projects may have a large effect on ecosystems and local population, the advantages over other alternatives to tackle global warming, such as nuclear power, are clear. Hydropower plants use a renewable resource, they can be used to meet peak energy by modulating discharge and are clean. Also, apart from generating electricity, dams permit the management of scarce resources, such as drinking water, and can be used by wildlife providing an ecological discharge is sustained.Hydroelectric power depends on the management of the liquid water from a river network, which in turn depends on precipitation in liquid or solid form; on runoff and on ice and snow melting. Also, upstream water discharges for agriculture or industrial uses affect the dam water level. A precise estimate of all these components improves the planning of generation power in the dam.
In places where river gauges are not available, or are unreliable, the level of upstream waters or the dam height can be directly measured using laser altimetry onboard airplanes. The series of measured height give the current potential energy available for conversion into electricity. The drawback of this procedure is that there are not high spatial resolution laser sensors regularly surveying the Earth's surface. The estimates we have are snapshots from dedicated missions (Space Shuttle) or flight campaigns, thus are inadequate for continuous monitoring of the resource. Nonetheless, less precise, indirect methods using visible, moderate resolution sensors such as MODIS (two daily overpasses at 250 m resolution) can be used. The procedure here is to delineate the extent of the water layer using an image analysis algorithm. As the topography and bathymetry are known, the amount of available water can then be estimated.
Determining snow coverage is important in high latitude areas where snow-melt runoff is a major source of hydropower. Hydrological models that use estimates of snow cover benefit from advances in satellite technology. Estimates using the normalized difference snow index (NDSI) applied to Landsat-TM or MODIS sensors increase the accuracy of hydrological models at basin level when combined with snow-depletion curves.55
Satellites have also been used to explore hydropower potential in remote areas. Images from IRS-1D, and LISS III sensors have proven useful in identifying and selecting suitable sites for small, mini- and micro-hydropower projects.56
4.1 Satellite precipitation estimates
Measuring precipitation in a basin is the first step in integrated hydrological modelling. Quantitative knowledge of precipitation variability is the key to success in a number of hydrometeorological applications. Apart from hydropower assessment, other applications range from quantitative precipitation forecasting, to flood and flash flood forecasting, water resources and agricultural management.57 The ability of NWP models to provide precipitation estimates or forecasts still lies behind satellite algorithms. Nonetheless, continuous advances in computing power, rain and cloud microphysics modelling and in ensemble techniques are bridging the gap. Besides, the use of satellite data to adjust NWP to observations (data assimilation) blurs the differences between methods.Satellites have been widely used for precipitation estimation since the early years of space technology. The advantages of satellites over ground instruments are apparent if we consider the practical limitations of rain gauges, ground radars, and disdrometers. Standard rain gauges have small catching area instruments that are affected by strong winds, evaporation, snow accumulation, blocking by leaves and accidental splash. The technical problems worsen for automatic rain gauges that are located in remote areas and seldom recalibrated. Furthermore, control experiments with well-calibrated dual rain gauges separated by a few meters have shown that large differences may appear in rainfall estimation. In the case of ground radar, known effects hindering perfect rainfall estimates are the path attenuation and uncertainty sources including the storm-to-storm and within-the-same-storm variability of drop size distribution, the variations of reflectivity with height, the temporal and spatial radar sampling associated with nonlinear averaging of highly variable precipitation fields, and the radar hardware miscalibration and noise.58 Therefore, use of radar-derived rainfall products in hydrometeorological applications requires proper characterization of the estimation error. Also, the calibration of the Z-R relationship, the function that relates the measured radar reflectivity Z with the actual precipitation (R), depends on the drop size distribution (DSD), which presents a large spatial and temporal variability and that has to be estimated using disdrometers. An estimate of the DSD, as well as hydrometeor phase (liquid, solid, mixed) and shape is key to relate polarimetric radar measurements to precipitation and other radar parameters (e.g., specific and differential attenuation, KDP, liquid water content, rain rate, etc.)59 Regarding disdrometers, either laser or video disdrometers also have their own uncertainties and limitations.
Sensors onboard satellites measuring precipitation are not free from potential errors, but have an edge over ground instrumentation. Firstly, they provide homogeneous estimates, i.e. data obtained by the same instrument, usually continuously-calibrated. Secondly, they provide estimates over a large area, which is almost hemispheric for geostationary orbits (GEO), and global for low orbits (LEO). Also, satellites operate both over land and sea, whereas ground instruments are almost absent over the oceans. An additional bonus compared with ground based measurements is the continuous sampling at high temporal and spatial resolutions offered by satellites.
Three types of approaches coexist for deriving rainfall estimates from the radiances measured by the satellite. First, the use of visible and infrared wavelengths, which permit high spatial and temporal resolutions due to the geostationary orbit of those sensors. VIS-IR techniques, however, rely on the quite indirect relationship between cold cloud top in the IR, cloud morphology and evolution, and surface rainfall. While it is true that a colder cloud top implies larger vertical cloud development and thus likely precipitation, the presence of precipitation depends on cloud microphysics, thermodynamics, chemistry, and dynamics; making the link colder-cloud-top/higher-precipitation-rates true only in a statistical sense. Methods using IR data as primary information are suitable as an indicator of probability of precipitation over an extended period (monthly) integrated over an extensive area (hundreds of kilometers), which may be informative enough for hydrological applications in large basins.
A more direct approach to estimate precipitation from satellites is the use of microwave frequencies. At those wavelengths, EM radiation is affected by rain drops and ice crystals. Depending on the frequency of the MW radiation, scattering by ice or emission dominates the signal. Emission-based techniques use primarily frequencies below 20 GHz, which are sensitive to the optical depth of the raindrops. The non-linear relationship between the observed brightness temperature and rainfall rate is then used. This method cannot be used over land given the high surface emissivity over land, neither can it be employed for high rainfall rates, as the relative contribution of hydrometeors to the emission signature decreases exponentially with their optical depth. An additional problem is the beam filling effect,61 given the combined effect of the spatial inhomogeneity of rainfall rates and the nonlinear dependence between MW brightness temperature and rain rate. The scattering approach can be used both over land and ocean, but it is more indirect. The scattering signal at high frequencies (typically 85 GHz) is dependent on the ice above the freezing layer, which has to be related to surface rainfall using statistical relationships derived from radiative transfer calculations. Combined emission-scattering algorithms have been described taking advantage of differences in polarization.
Table 3 gathers the key satellites and sensors currently employed by mainstream precipitation algorithms. Amongst them, the Tropical Rainfall Measuring Mission (TRMM) satellite has been proven invaluable improving our knowledge of the water cycle.62TRMM carries both a radiometer (TMI) and the first orbital radar to measure precipitation, the Precipitation Radar (PR). The combination of both sensing technologies has been considered very useful in deriving surface rainfall.49 The forthcoming Global Precipitation Measuring (GPM) mission will extend TRMM geographical coverage thanks to a constellation of radiometers and a core radar satellite, also improving the sensing capabilities of the system using dual-polarization radar techniques.62–64
| Satellite | Sensor | Spectral rangea | Channels | Resolution |
|---|---|---|---|---|
| a VIS: Visible; IR: Infrared; MW: Microwave. | ||||
| Low Earth orbiting satellites (LEO) | ||||
| NOAA 10/11/12 | AVHRR | VIS & IR | 5 | 1.1 km |
| AMSU A&B (radiometer) | MW | 15 & 5 | 50 km (best) | |
| TOVS [HIRS/MSU/SSU)] (sounder) | MW | n/a | n/a | |
| DMSP F-13/14/15/16 | SSMI/SSMI/S (radiometer) | MW | 7/11 | n/a |
| TRMM | TMI (radiometer) | MW | 9 | 5–50 km |
| PR (radar) | MW | 1 | 4.3 km | |
| Geostationary satellites (GEO) | ||||
| GOES E/W | GOES I-M imager | VIS & IR | 5 | 1 (VIS) and 4 km |
| Meteosat 5,7,8 | MVIRI/SEVIRI | VIS & IR | 3/12 | 1 (VIS) and 4 km |
| MTSAT | n/a | VIS & IR | 5 | 1 (VIS) and 4 km |
Given the relative merits of VIS-IR sensors (high temporal and spatial resolution) and MW sensors (more direct rainfall estimation), it is not surprising that blended methods appeared. The third approach in rainfall estimation from space is represented by data-fusion procedures aimed at taking advantage of the high spatial and temporal resolution of GEO satellites and the more direct estimates from sensors in LEOs. The histogram matching technique accumulatively assigns colder cloud temperatures to higher rainfall rates,66 extending the MW statistics outside the MW swath.67 Neural networks methods try to model the non-linear relationship between IR and MW using a variety of approaches,68 including that of linking precipitation amount to cloud types,69 whereas morphing techniques use IR to advect high-quality MW rainfall estimates along cloud-derived vectors until a new MW overpass is available, therefore covering the gaps between successive MW swaths.70 As mentioned above, the cloud motion wind vectors required by the advection are calculated either by correlation windows or by variational methods. Fig. 10 shows the potential of techniques such as the CMORPH method,20 which can be used to generate high-quality precipitation estimates at several temporal and spatial resolutions starting from the satellite products resolution (8 km, 30 minutes for CMORPH) to more aggregated values.
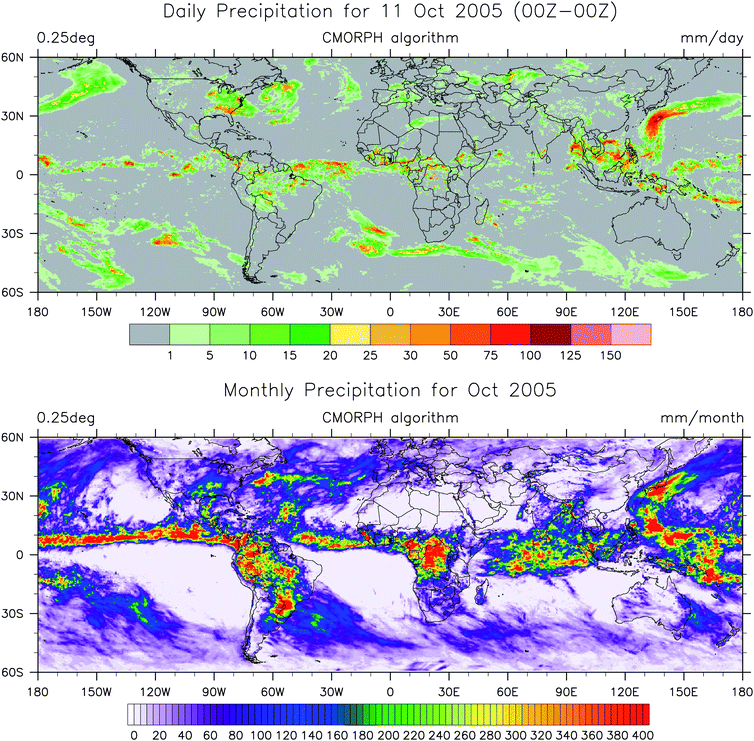 | ||
| Fig. 10 Global daily (top) and monthly (bottom) accumulated precipitation estimates derived from the CMORPH algorithm. Data from NOAA's Climate Prediction Center (CPC). | ||
Table 4 shows operational satellite precipitation algorithms using some of the methods described above. The variety reveals the challenges in satellite rainfall estimation, and attempts to tackle a problem with several aspects such as the geographical variability of the performances of the algorithms.
| a http://www.isac.cnr.it/%7Eipwg/. |
|---|
| IR -based algorithms |
| CMA China Meteorological Agency (CMA), People Rep. of China |
| EURAINSAT/A 1.0 EURAINSAT project, EU |
| High resolution Precipitation Index (HPI) EUMETSAT, EU |
| Hydro-Estimator for short term (1–6 hr) Extreme Precipitation NOAA/NESDIS, USA |
| JMAMSC Japan Meteorological Agency, Japan |
| Multiple precipitation estimations blend |
| GOES Multispectral Rainfall Algorithm (GMSRA) NOAA/NESDIS, USA |
| GPCP 1 Degree Daily NASA/GSFC, USA |
| GPCP Satellite-Gauge Combination NASA/GSFC, USA |
| TRMM var (3B41RT) NASA/GSFC, USA |
| MW-based algorithms |
| AMSR-E L2 NOAA-NESDIS global rain rates NOAA/NESDIS, USA |
| AMSU NOAA-NESDIS orbital, pentad and monthly global rain rates NOAA/NESDIS, USA |
| SSM/I NOAA-NESDIS orbital, pentad and monthly global rain rates NOAA/NESDIS, USA |
| TRMM HQ (3B40RT) NASA/GSFC, USA |
| Blended MW-IR algorithms |
| CPC Morphing technique (CMORPH) NOAA, USA |
| EURAINSAT/B 1.0 EURAINSAT project, EU |
| GSMaP Osaka University, Japan |
| NRL Blended Satellite Technique Naval Research Laboratory, USA |
| Precipitation Estimation from Remotely Sensed Information using Artificial Neural Networks (PERSIANN) Univ. of California Irvine, USA |
| PERSIANN - Cloud Classification System (PERSIANN-CCS) Univ. of California Irvine, USA |
| Self-Calibrating Multivariate Precipitation Retrieval (SCaMPR) NOAA-NESDIS-STAR, USA |
| TRMM HQ/VAR (3B42RT) NASA/GSFC, USA |
4.2 Potential climate change effects on hydropower
The most relevant effect of climate change on hydropower derives from variations in amount, spatial distribution and temporal availability of precipitation. Models to quantify the relationship between climate change and the financial and technical viability of hydropower have been described,71 including also an assessment of the financial risks.72 Changes in temperature also influence hydropower production as warmer weather implies more evaporation and growing water demand,73 but the overall effect in the water budget is comparatively smaller and can be further decreased by intelligent water use policies.Hydroclimatic projections of runoff at basin scale have shown that several RCMs are required to provide trustworthy data to water resource managers.74 Ensembles of RCMs with different parameterizations are thus used to determine the uncertainties at the limits of changes in precipitation,75 either in total water availability or in the precipitation cycles76 (Fig. 11), a value of the primary interest of water managers in semiarid environments.
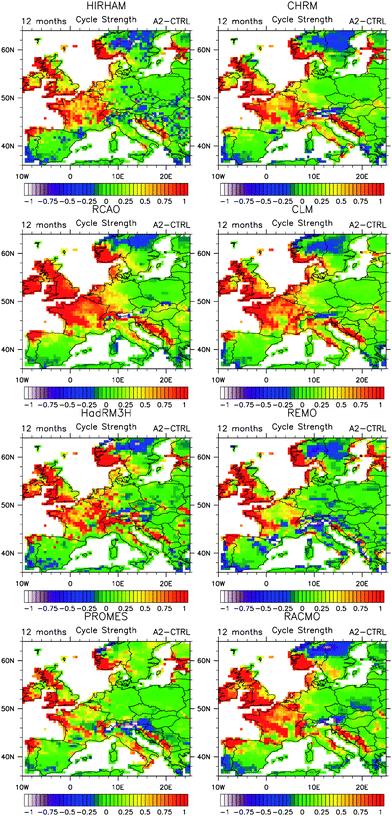 | ||
| Fig. 11 Differences for eight regional models in the annual cycle strength between the control (1960–90) and the A2 future climate scenario (2070–2100). Changes in the hydrological cycle severely affect energy resources, and have to be considered when planning new installations. From ref. 76. | ||
Joint regional changes in temperature and precipitation can also be estimated using several RCMs (Fig. 12), with uncertainty limits marked by the spread of the ensemble members.65 This methodology does not fulfil all the uncertainties in hydropower modelling, such as consumption patterns, but tackles the problem of the direct effects of expected climate change.
![Joint estimate of future changes in the European precipitation and temperature in the A2 scenario over present climate. The figures depict the estimates and uncertainties for nine RCMs simulations and the forcing GCM. The added value of the RCMs is assessed by comparing the spread of the RCMs and the distance to the GCM estimate of the potential changes under that scenario. The regional differences are also apparent. The results are relevant in assessing hydropower in terms of changes in the availability of the resource, with less precipitation plus increased evaporation in most of the regions. [IB: Iberian Peninsula; IT: Italy; ALP: Alps, BC: Balkans; BI: British Isles; CE: Central Europe; EE: Eastern Europe; FR: France]. Adapted from ref. 65.](/image/article/2009/EE/b914121a/b914121a-f12.gif) | ||
| Fig. 12 Joint estimate of future changes in the European precipitation and temperature in the A2 scenario over present climate. The figures depict the estimates and uncertainties for nine RCMs simulations and the forcing GCM. The added value of the RCMs is assessed by comparing the spread of the RCMs and the distance to the GCM estimate of the potential changes under that scenario. The regional differences are also apparent. The results are relevant in assessing hydropower in terms of changes in the availability of the resource, with less precipitation plus increased evaporation in most of the regions. [IB: Iberian Peninsula; IT: Italy; ALP: Alps, BC: Balkans; BI: British Isles; CE: Central Europe; EE: Eastern Europe; FR: France]. Adapted from ref. 65. | ||
Other uncertainties to take into consideration include the discharge model, the evolution of glaciers in mountain areas, and hydropower management.77 The variability of the problems vary depending on location, storage capacity and management, as shown by Vicuna et al.78 in their California case study, where models comparing wetter and dryer hydrological conditions were used.
5 Biomass
Biomass assessment can benefit remote sensing in a variety of ways. Thus for instance, accurate delineation of biomass distribution at scales from local and regional to global becomes significant in reducing the uncertainty of carbon emission and sequestration.79 It has been argued that biomass energy plantations and other types of energy cropping could be a more effective strategy for carbon mitigation than simply growing trees as a carbon store, particularly on higher productivity lands,80 albeit the issue remains controversial given the concomitant societal impacts.The use of municipal, agricultural and forest wastes82 seems less contentious as is the use of high-fire-risk wood as biomass, which could solve two problems (i) carbon emissions from forest fires are a net contributor to global warming, and (ii) high-fire-risk wood is known to be a determinant factor in the origin and spread of wildfires.
The remote estimation of biomass can be undertaken using a number of satellites. In large areas such as the Amazon basin, satellites are the only realistic technology to monitor extensive areas. Methods based on fine spatial resolution (aerial photographs, IKONOS or QuickBird satellites); medium spatial-resolution (Landsat TM/ETM+, SPOT); coarse resolution (IRS-1C WiFS, AVHRR, MODIS); airborne laser; lidar; and radar (SIR-C, SAR, AIRSAT, JERS, AeS-1 SAR) have been described to estimate above-ground biomass of for example sugar cane (see Lu83 for a comprehensive account). Indexes such as the Normalized Vegetation Differential Index (NDVI) are used.
The NDVI is the difference between the near-infrared and visible reflectances formulated as a fraction of their sum. Using the satellite bands corresponding to near-infrared (NIR) and red (R) wavelengths, the NDVI is calculated as:
 | (28) |
By construction, the NDVI varies from −1 to 1, with 1 indicating the greenest (photosynthetically-active) vegetation. Other indexes that have been used to correlate satellite measurements and biomass include the Leaf Area Index (LAI), or the Tasselet cap transformation.
Several satellites including GPS are also used in agronomy to reduce costs through a more efficient management of crops. Thus, precision agriculture techniques use spatial technology to estimate optimum sowing density, estimate fertilizers and other input needs at every location, and to more accurately predict crop yields and thus energy density. As Fig. 13 illustrates, the high spatial resolution of current satellites (less then 1 m) permits an accurate knowledge of the state of the field.
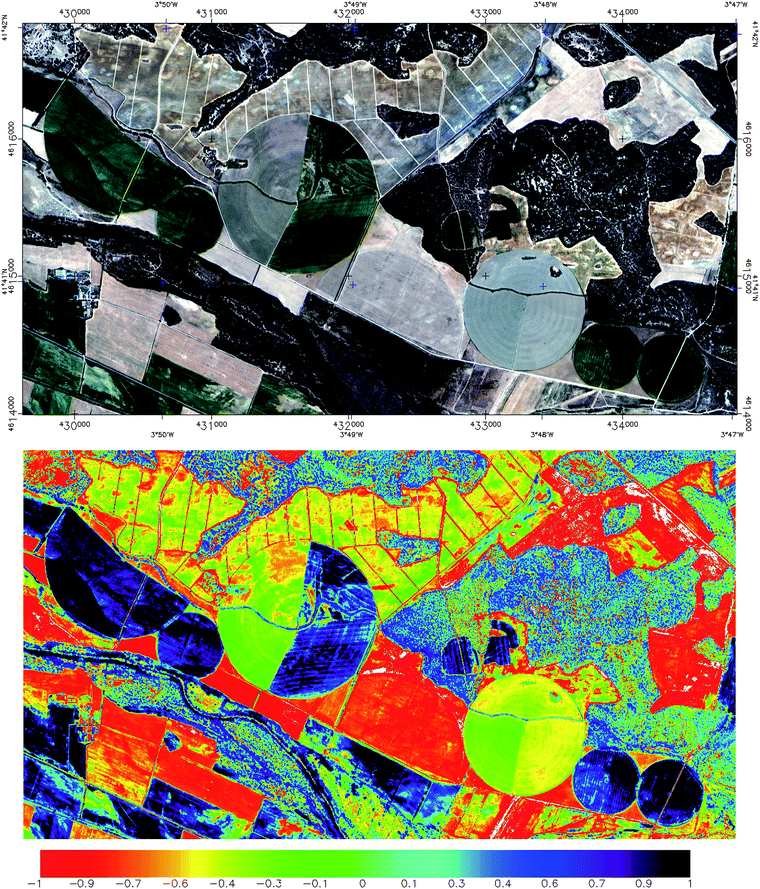 | ||
| Fig. 13 True colour (RGB combination) Ikonos satellite image (top) and NDVI (bottom). The spatial resolution is 1 meter (pan-sharpened using maximum entropy; see ref. 81). Differences in plant growth within the centre-pivot systems, individual trees, riparian vegetation and differences in biomass are clearly visible. Innermost geographical coordinates in the top image are UTM 30-N; units are in meters. | ||
Evaluating the energy potential of, for instance, corn for bio-ethanol over a large area can be done at reduced cost over high resolution sensors using moderate-resolution sensors such as LANDSAT or SPOT (Fig. 14).
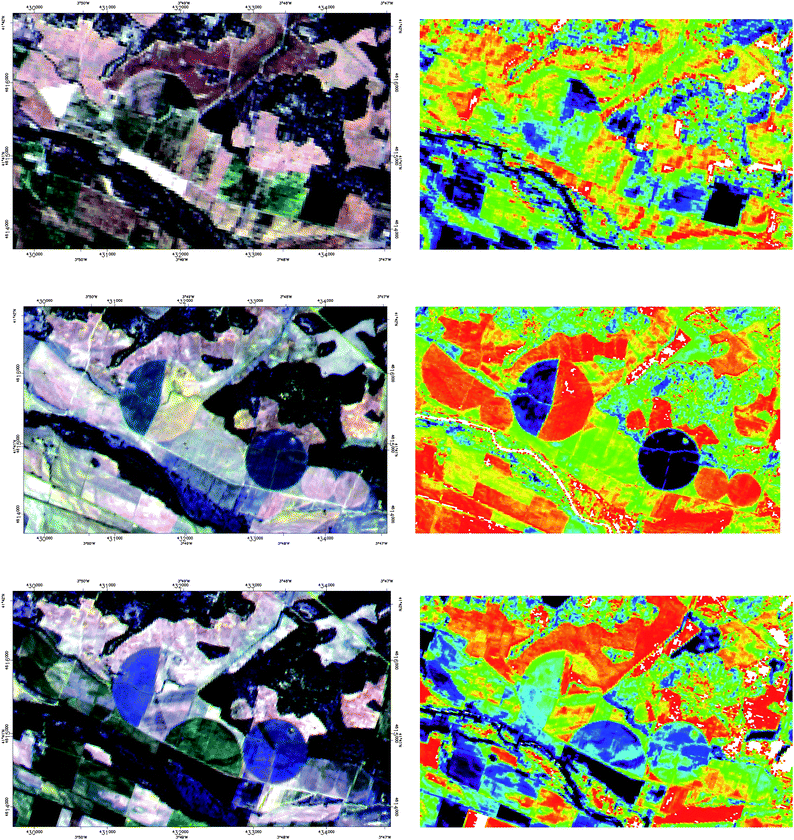 | ||
| Fig. 14 Same as Fig. 13 for Landsat-TM (30 m resolution, top), and two SPOT-HRV (20 m) images (middle and bottom). All the images are from different times of the year, so the phenological changes are noticeable. Colour scale for NDVI as forFig. 13. | ||
The availability of agricultural and forestal materials for use as biofuels depends upon growing conditions such as temperature, precipitation, and incident solar radiation. Therefore, the previous discussions on climate change issues are applicable here.
6 Geothermal
Geothermal energy is the only renewable energy totally unaffected by climate change. Although it is unevenly distributed, the potential of this energy is large enough to merit consideration given the large capacity factor of this resource (more than 75%; compare to 40% of wind farms). Notorious, well-known hot-spots have been long identified, but lower-grade resources also exist that might be commercially exploited.Satellite identification of these geothermal sources is an emergent research field. Infrared sensors such as those in ASTER are appropriate to map surface temperature over large extensions. Although this is a very cost-effective technology compared to fieldwork, the challenge for remote sensing methods is to discriminate a subsurface weak signal from the observed heat at surface where other heat sources bury the geothermal signal in noise. Therefore, it is necessary first to carefully eliminate the combined effects of solar irradiation, albedo, topographic effects and thermal inertia. The method is feasible because geothermal spots appear as a constant anomaly over the background.84
The LANDSAT-ETM sensor has also been used to map geothermal anomalies.85,86Fig. 15 shows the footprints of geothermal sources in a feasibility case study in the US. The horizontal bands of the figure correspond with those areas of increased geothermal activity.
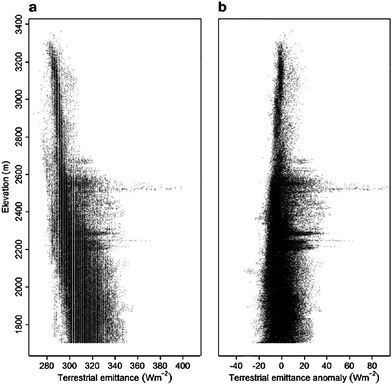 | ||
| Fig. 15 Terrestrial emittance (a) and its anomaly after accounting for elevation and solar effects (b). Horizontal bands of positive anomaly correspond to increased geothermal activity (from ref. 85). | ||
The results are promising, albeit the remote sensing of this energy is plagued with difficulties due to the very small signal, even for sites with large geothermal activity such as Yellowstone park, as in this case.
7 Conclusions
Satellites provide spatial correlation and resolution which are unobtainable using conventional surface based monitoring networks.13 The application of the advances in satellite science to improve the efficiency of renewable energies and to develop new energy resources has a twofold relationship with the environment. On the one hand, the environment defines the energy input, thus making a technology suitable in some places and unpractical in others.87 On the other hand, planning requires a good match between the technical solution and the environmental conditions. This fact is implicitly acknowledged when solving efficiency problems in a variety of environmental conditions,88 but a more precise quantification would lead to substantial savings given the large size of most renewable energy projects.This paper has shown that satellites and quantitative models are useful in assessing the potential of renewable energy sources such as solar, wind, hydropower, biomass and geothermal energies. Whilst satellites and models have numerous advantages on their own, it is the combination of high-resolution, global, homogenous observations from satellites, and the ability to quantify, forecast and provide physical insight into the processes from models which makes the joint use of those methods fertile ground for new scientific and technological developments. Regarding forthcoming challenges and opportunities, new satellites such as the GPM constellation, a new generation of hydrological models, new assimilation techniques, better parameterizations in the NWP model physics, and large computing power will improve the real-time assessment of the energy potential from renewable resources. The use of weather forecasting for energy integration will become of fundamental importance for daily operations as more and more intermittent resources supply energy to the grid. Knowing in advance the expected wind, and solar irradiation at high spatial resolution can provide a better picture of the potentially available power, thus providing managers with valuable information to satisfy energy demands.
Acknowledgements
The author wishes to thank Péter Kiss, David Sailor and Fred Watson for permitting the reproduction of their figures. This research has been funded through projects CGL2006-03611 (MEC), PAI06-0101 (JCCM) and the Ramon y Cajal program.Notes and references
- M. Muselli, P. Poggi, G. Notton and A. Louche, Sol. Energy, 1998, 62, 429–444 CrossRef.
- T. E. Drennen, J. D. Erickson and D. Chapman, Energy Policy, 1996, 24, 9–16 CrossRef.
- G. P. Harrison and A. R. Wallace, Renewable Energy, 2005, 30, 1801–1817 CrossRef.
- R. Verdejo, F. Barroso-Bujans, M. A. Rodriguez-Perez, J. A. de Saja, M. Arroyo and M. A. Lopez-Manchado, J. Mater. Chem., 2008, 18, 3933–3939 RSC.
- A. Y. Hou, S. Q. Zhang, A. M. da Silva, W. S. Olson, C. D. Kummerow and J. Simpson, Bull. Am. Meteorol. Soc., 2001, 82, 659–679 CrossRef.
- W. Durisch, J. Keller, B. Hofer, W. Bulgheroni, M. Brack and H. Riegraf, Sol. Energy Mater., 1991, 24, 333–347 CrossRef CAS.
- I. Palavras and G. C. Bakos, Renewable Energy, 2006, 31, 2422–2431 CrossRef CAS.
- S. Colle, S. L. d A and R. Rüther, Sol. Energy, 2001, 70, 11.
- D. R. Myers, Energy, 2004, 30, 14.
- D. Heinemann, JRC, 2004 Search PubMed.
- M. Muselli, G. Notton, J. L. Canaletti and A. Louche, Energy Convers. Manage., 1998, 39, 1–19 CrossRef.
- J. E. Hay, Renewable Energy, 1993, 3, 381–393 CrossRef.
- J. E. Hay, Renewable Energy, 1993, 3, 395–398 CrossRef.
- J. Boland, B. Ridley and B. Brown, Renewable Energy, 2008, 33, 575–584 CrossRef CAS.
- J. W. Spencer, Sol. Energy, 1982, 29, 19–32 CrossRef.
- M. Iqbal, An Introduction to Solar Radiation, Academic Press, New York, 1983, 390 Search PubMed.
- R. E. Dickinson, Adv. Geophys., 1983, 25, 47 Search PubMed.
- B. P. Briegleb, P. M, V. Ramanathan and E. Harrison, J. Appl. Meteorol., 1986, 25, 12 Search PubMed.
- R. Frouin, D. L, C. Gautier, K. S. Baker and R. C. Smith, J. Geophys. Res., 1989, 94, 11.
- R. J. Joyce, J. E. Janowiak, P. A. Arkin and P. P. Xie, J. Hydrometeorol., 2004, 5, 487–503 Search PubMed.
- F. J. Tapiador, Int. J. Remote Sens., 2008, 29, 5851–5862 CrossRef.
- Z. Pan, M. Segal, R. W. Arritt and E. S. Takle, Renewable Energy, 2004, 29, 1923–1928 CrossRef CAS.
- P. E. Glaser, IEEE Trans. Microwave Theory Tech., 1992, 40, 1230–1238 CrossRef.
- C. Carrington, H. F, IAC-02-R.P.12, 53rd International Astronautical Congress, 2002 Search PubMed.
- Y. Yamagiwa, Tr. Jpn Soc. Aeronaut., S, 1998, 41, 86–93 Search PubMed.
- R. Verdejo, P. Werner, J. Sandler, V. Altstadt and M. S. P. Shaffer, J. Mater. Sci., 2009, 44, 1427–1434 CrossRef CAS.
- R. Verdejo, F. Barroso-Bujans, M. A. Rodriguez-Perez, J. A. de Saja and M. A. Lopez-Manchado, J. Mater. Chem., 2008, 18, 2221–2226 RSC.
- N. Takeichi, H. Ueno and M. Oda, Acta Astronautica, 2005, 57, 698–706 CrossRef.
- J. Boutin, L. Siefridt, J. Etcheto and B. Barnier, Int. J. Remote Sens., 1996, 17, 2897–2913 CrossRef.
- M. Gökcek, A. B and S. Bekdemir, Renewable Energy, 2007, 32, 13.
- S. Akpinar and E. K. A, Energy Convers. Manage., 2007, 48, 9 CrossRef.
- S. C. Pryor, M. Nielsen, R. J. Barthelmie and J. Mann, J. Appl. Meteorol., 2004, 43, 739–750 Search PubMed.
- E. T. Jaynes, Proc. IEEE, 1982, 70, 939–952.
- M. Li and X. L, Int. J. Exergy, 2004, 1, 18 CrossRef.
- V. P. Singh, A. K. R and K. Singh, Adv. Water Resourc., 1986, 9, 15 Search PubMed.
- F. Pimenta, W. Kempton and R. Garvine, Renewable Energy, 2008, 33, 2375–2387 CrossRef.
- C. B. Hasager, H. P. Frank and B. R. Furevik, Can. J. Remote Sens., 2002, 28, 80–89 Search PubMed.
- C. B. Hasager, M. Nielsen, P. Astrup, R. Barthelmie, E. Dellwik, N. O. Jensen, B. H. Jorgensen, S. C. Pryor, O. Rathmann and B. R. Furevik, Wind Energy, 2005, 8, 403–419 CrossRef.
- W. T. Liu, W. Tang and X. Xie, Geophys. Res. Lett., 2008, 35, L17S07 CrossRef.
- M. B. Christiansen and C. B. Hasager, Remote Sens. Environ., 2005, 98, 251–268 CrossRef.
- D. W. Keith, J. F. DeCarolis, D. C. Denkenberger, D. H. Lenschow, S. L. Malyshev, S. Pacala and P. J. Rasch, Proc. Natl. Acad. Sci. U. S. A., 2004, 101, 16115–16120 CrossRef CAS.
- P. Kiss and I. M. J, Energy Convers. Manage., 2008, 49, 9.
- S. Basu, K. Satheesan, A. Sarkar and C. M. Kishtawal, Geophys. Res. Lett., 2005, 32 Search PubMed.
- D. Cornford, I. T. Nabney and C. M. Bishop, Neural Comput. Appl, 1999, 8, 206–217 CrossRef.
- S. Schreck, J. L; W. Shaw, NREL Technical Report, 2008 Search PubMed.
- R. J. Barthelmie and S. C. Pryor, J. Appl. Meteorol., 2003, 42, 83–94 Search PubMed.
- D. J. Sailor, T. Hu, X. Li and J. N. Rosen, Renewable Energy, 2000, 19, 359–378 CrossRef.
- D. J. Sailor, M. Smith and M. Hart, Renewable Energy, 2008, 33, 2393–2406 CrossRef.
- S. C. Pryor, J. T. Schoof and R. J. Barthelmie, Clim. Res, 2005, 29, 183–198 CrossRef.
- P. B. Breslow and D. J. Sailor, Renewable Energy, 2002, 27, 585–598 CrossRef.
- M. Deque, D. P. Rowell, D. Luthi, F. Giorgi, J. H. Christensen, B. Rockel, D. Jacob, E. Kjellstrom, M. de Castro and B. van den Hurk, Clim. Change, 2007, 81, 53–70 CrossRef.
- B. Rockel and K. Woth, Clim. Change, 2007, 81, 267–280 CrossRef.
- IPCC, Climate Change 2007: The Physical Science Basis, Cambridge University Press, 2007, 996 Search PubMed.
- G. P. Harrison, L. C. Cradden and J. P. Chick, Energy Source Part A, 2008, 30, 1286–1299 Search PubMed.
- J. G. Winther and D. K. Hall, Int. J. Remote Sens., 1999, 20, 2991–3008 CrossRef.
- S. Dudhani, A. K. Sinha and S. S. Inamdar, Energy Policy, 2006, 34, 3195–3205 CrossRef.
- E. N. Anagnostou, Surv. Geophys., 2004, 25, 511–537 CrossRef.
- E. N. Anagnostou, W. F. Krajewski and J. Smith, J. Atmos. Oceanic Technol., 1999, 16, 206–215 Search PubMed.
- E. N. Anagnostou, M. N. Anagnostou, W. F. Krajewski, A. Kruger and B. J. Miriovsky, J. Hydrometeorol., 2004, 5, 110–128 Search PubMed.
- A. Gruber et al., Assessment of Global Precipitation Products, WCRP Report, WCRP-128 WMO/TD-No. 1430, 2008, 57 pp Search PubMed.
- C. Kummerow, P. Poyner, W. Berg and J. Thomas-Stahle, J. Atmos. Oceanic Technol., 2004, 21, 624–638 Search PubMed.
- C. Kummerow, J. Simpson, O. Thiele, W. Barnes, A. T. C. Chang, E. Stocker, R. F. Adler, A. Hou, R. Kakar, F. Wentz, P. Ashcroft, T. Kozu, Y. Hong, K. Okamoto, T. Iguchi, H. Kuroiwa, E. Im, Z. Haddad, G. Huffman, B. Ferrier, W. S. Olson, E. Zipser, E. A. Smith, T. T. Wilheit, G. North, T. Krishnamurti and K. Nakamura, J. Appl. Meteorol., 2000, 39, 1965–1982 Search PubMed.
- V. Chandrasekar, A. Hou, E. Smith, V. N. Bringi, S. A. Rutledge, E. Gorgucci, W. A. Petersen and G. S. Jackson, Bull. Am. Meteorol. Soc., 2008, 89, 1127 CrossRef.
- F. S. Marzano, A. Mugnai, G. Panegrossi, N. Pierdicca, E. A. Smith and J. Turk, IEEE Trans. Geosci. Remote Sens., 1999, 37, 596–613 CrossRef.
- F. J. Tapiador, E. Sanchez and R. Romera, Tellus Series A: Dynamic Meteorology and Oceanography, 2009, 61, 57–71 Search PubMed.
- C. Kidd, D. R. Kniveton, M. C. Todd and T. J. Bellerby, J. Hydrometeorol., 2003, 4, 1088–1104 Search PubMed.
- F. J. Tapiador, C. Kidd, V. Levizzani and F. S. Marzano, Int. J. Remote Sens., 2004, 25, 4629–4639 CrossRef.
- F. J. Tapiador, C. Kidd, K. L. Hsu and F. Marzano, Meteorol. Appl., 2004, 11, 83–91 CrossRef.
- Y. Hong, K. L. Hsu, S. Sorooshian and X. G. Gao, Water Resourc. Res., 2005, 41 Search PubMed.
- J. E. Janowiak, V. E. Kousky and R. J. Joyce, J. Geophys. Res., 2005, 110 Search PubMed.
- G. P. Harrison and H. W. Whittington, IEE Proc., Generation Transmission and Distribution, 2002, 149, 249–255 Search PubMed.
- G. P. Harrison, H. W. Whittington and A. R. Wallace, IEEE Transactions on Power Systems, 2003, 18, 1324–1330 Search PubMed.
- P. J. Robinson, Int. J. Climatol., 1997, 17, 983–996 CrossRef.
- A. Frigon, M. Slivitzky, D. Caya and R. Roy, La Houille Blanche, 2007, 97 CrossRef.
- F. J. Tapiador, E. Sanchez and M. A. Gaertner, Geophys. Res. Lett., 2007, 34 Search PubMed.
- F. J. Tapiador and E. Sanchez, J. Clim., 2008, 21, 2540–2557 CrossRef.
- B. Schaefli, B. Hingray and A. Musy, Hydrol. Earth Syst. Sci., 2007, 11, 1191–1205 Search PubMed.
- S. Vicuna, R. Leonardson, M. W. Hanemann, L. L. Dale and J. A. Dracup, Clim. Change, 2008, 87(s1), 123–S137 CrossRef.
- G. M. Foody, Int. J. Remote Sens., 2003, 24, 11.
- D. O. Hall and J. I. House, Renewable Energy, 1994, 5, 58–66 CrossRef.
- F. J. Tapiador and J. L. Casanova, Int. J. Remote Sens., 2002, 23, 777–785 CrossRef.
- K. A. Vogt, D. J. Vogt, T. Patel-Weynand, R. Upadhye, D. Edlund, R. L. Edmonds, J. C. Gordon, A. S. Suntana, R. Sigurdardottir, M. Miller, P. A. Roads and M. G. Andreu, Renewable Energy, 2009, 34, 233–241 CrossRef CAS.
- D. S. Lu, Int. J. Remote Sens., 2006, 27, 1297–1328 CrossRef.
- M. F. Coolbaugh, C. Kratt, A. Fallacaro, W. M. Calvin and J. V. Taranik, Remote Sens. Environ., 2007, 106, 350–359 CrossRef.
- F. G. R. Watson, R. E. Lockwood, W. B. Newman, T. N. Anderson and R. A. Garrott, Remote Sens. Environ., 2008, 112, 471–481 CrossRef.
- R. L. Garwin, Bull. Am. Phys. Soc., 1981, 26, 467–467 Search PubMed.
- M. Balser, C. A. Mcnary, A. E. Nagy, R. Loveland and D. Dickson, J. Appl. Meteorol., 1976, 15, 50–58 Search PubMed.
- P. Beaucage, A. Glazer, J. Choisnard, W. Yu, M. Bernier, R. Benoit and G. Lafrance, Can. J. Remote Sens., 2007, 33, 368–377 Search PubMed.
| This journal is © The Royal Society of Chemistry 2009 |