Controlled synthesis and characterization of carbon-supported Pd4Co nanoalloy electrocatalysts for oxygen reduction reaction in fuel cells†
H.
Liu
and
A.
Manthiram
*
Electrochemical Energy Laboratory & Materials Science and Engineering Program, The University of Texas at Austin, Austin, TX 78712, USA. E-mail: rmanth@mail.utexas.edu; Fax: +1 512 4717681; Tel: +1 512 4711791
First published on 14th October 2008
Abstract
Carbon-supported Pd4Co nanoalloy samples (denoted as Pd4Co/C) have been synthesized by a modified polyol reduction process, involving a mixture of ethylene glycol (a polyol) and a small amount of sodium borohydride as reducing agents, and evaluated as electrocatalysts for the oxygen reduction reaction (ORR) in fuel cells. The synthesis process offers Pd4Co nanoparticles with an average particle size of 4.6 nm and a narrow size distribution, which increases to 7.3 and 11.0 nm on annealing, respectively, at 350 and 500 °C in 10% H2–90% Ar. Although the as-prepared Pd4Co/C sample exhibits instability during ORR, annealing at 350 and 500 °C enhances the stability significantly due to an increasing degree of alloying between Pd and Co and increasing particle size. While both Pd/C and Pt/C exhibit a drastic decline in catalytic activity on annealing at 350 and 500 °C due to a significant increase in particle size, the Pd4Co/C sample maintains high catalytic activity even after annealing at 350 °C due to an increase in the degree of alloying. The Pd4Co/C catalyst offers an added advantage of excellent tolerance to methanol poisoning and lower cost compared to the conventional Pt/C catalyst.
Broader contextRapid depletion of fossil fuels and growing environmental concerns pose serious scientific and technological challenges to address the increasing global demand for energy. Fuel cells are appealing in this regard, but the high cost of the currently used platinum electrocatalysts is an impediment to the commercialization of the fuel cell technology. Palladium-based alloy catalysts have recently been found to exhibit high catalytic activity for the oxygen reduction reaction in fuel cells, but with the multiple metals involved, synthesis and processing play a significant role on the degree of alloying, chemical homogeneity, particle size and distribution, and catalytic activity. To address this issue, we present here a novel modified polyol reduction method to obtain carbon-supported Pd4Co nanocrystals with a high degree of alloying and dispersion on the carbon support while keeping the particle size small. The Pd4Co catalysts thus obtained exhibit high catalytic activity for the oxygen reduction reaction with excellent tolerance to methanol in direct methanol fuel cells. |
1. Introduction
Platinum supported on carbon black is widely used as an electrocatalyst for the oxygen reduction reaction (ORR) in proton exchange membrane fuel cells (PEMFC) and direct methanol fuel cells (DMFC).1 However, the limited world's supply of platinum catalyst cannot support a widespread commercialization of the technologies. To address this critical challenge, alloying of Pt with other less expensive metals like Co or Ni,2–4reduction in the catalyst loading,5–10 and development of alternative electrocatalysts such as metal carbides,11 metal oxides,12 metal chalcogenides,13,14 enzymes,15,16 and platinum-free metal combinations17–19 have been widely pursed over the years for ORR.Recently, we reported that palladium-based alloy electrocatalysts such as Pd–Co–Au, Pd–Ti, and Pd–Co–Mo20–22 show catalytic activity comparable to that of Pt for ORR. However, for structure and surface sensitive reactions such as the ORR, particle size as well as dispersion and compositional homogeneity of the alloy clusters on the carbon support are important factors to obtain good catalytic activity in practical applications. Generally, the Pd-based alloys supported on carbon have been prepared by a conventional reduction of the metal ions with alkali metal borohydrides or by a reduction of the metal ions within microemulsions with borohydrides, followed by heat treatment at 500–900 °C in a reducing atmosphere or by simple thermal treatment of the constituents with H2 to promote alloy formation.20–23 Unfortunately, the faster reduction with the strongly reducing borohydrides and the high heating temperatures lead to undesired particle growth, which results in a decrease in surface area and catalytic activity. Development of novel, controlled synthesis approaches that can provide enhanced alloy formation at the lowest temperatures possible while keeping the particle size small at the nanoscale is critical to realize the full potential of the Pd-based alloy electrocatalysts.
Reduction of metal ions by polyols has been pursued by several groups for the synthesis of metal nanoparticles.24–30 The polyol process, which exploits high-boiling polyalcohol solvents as mild reducing agents at moderate temperatures, offers a facile route for obtaining multi-metallic alloy nanoparticles without requiring significant solid state diffusion over large atomic distances. Size and shape controlled nanocrystals with particle size as small as 2 nm has been obtained by the polyol process.28 However, the conventional polyol process often employs large amounts of stabilizers such as the poly(vinylpyrrolidone) (PVP) polymer to produce mono-dispersed, small particles, resulting in polymer-protected colloidal dispersions. It is difficult to remove the polymer completely from such colloidal dispersions, and the presence of polymer is undesirable for practical applications such as electrocatalysts in fuel cells. In addition, the large differences in the standard reduction potentials of ions like Pd2+ and Co2+ and the mild reducing power of polyols lead to the formation of hollow nanospheres of the easily reducible components like Pd with no Co.31 In other words, it is difficult to reduce ions like Co2+ with polyol due to their low reduction potential compared to that of Pd2+.
We present in this paper a modified polyol reduction process, involving a mixture of a polyol (ethylene glycol) and a small amount of sodium borohydride as reducing agents as well as much lower amounts of the protective polymer than that used in conventional polyol process. While the use of borohydride helps to reduce the Co2+ ions easily, the lower amount of polymer helps to obtain electrocatalysts nearly free from the protective polymer contamination. The reduction products formed are then annealed at a moderate temperature of 350 °C to obtain carbon-supported Pd4Co nanocrystals with a high degree of alloying and dispersion on the carbon support while keeping the particle size small. Characterization of the Pd4Co/C electrocatalysts by X-ray diffraction and transmission electron microscopy, an investigation of their electocatalytic activity for ORR in single cell PEMFC and DMFC and by rotating disk electrode (RDE) measurements, and an assessment of their stability in a three-electrode test cell in the presence and absence of methanol are presented.
2. Experimental
2.1 Synthesis
Carbon-supported Pd4Co electrocatalysts were prepared by a modified polyol reduction process. Required amounts of (NH4)2PdCl4 and CoCl2·6H2O were first dissolved in a mixture of ethylene glycol (EG, a polyol) and water, followed by dissolving poly(vinylpyrrolidone) (PVP) in it and adding an aqueous solution of NaBH4 into it. The mixture was then refluxed, cooled to room temperature, stirred with an appropriate amount of carbon (Vulcan XC 72R), filtered, washed, and dried overnight. The as-prepared powders thus obtained are hereafter designated as Pd4Co/C-Ap, and were examined by a Perkin Elmer FT-IR System (Spectrum BX) to detect if any PVP is present. The samples were then heated at 350 and 500 °C in a reducing atmosphere, which are denoted hereafter, respectively, as Pd4Co/C-350 and Pd4Co/C-500. For a comparison, Pd/C and Pt/C electrocatalysts were also prepared by a similar process and denoted as Pd/C-Ap, Pd/C-350, Pd/C-500, Pt/C-Ap, Pt/C-350 and Pt/C-500. Further details of these synthesis procedures are described in ESI.†2.2 Structural and microstructural characterizations
The samples synthesized were characterized with a Phllips X-ray diffractometer (XRD) using Cu Kα radiation and a FEI Tecnai G2 F20 X-Twin transmission electron microscope (TEM) equipped with energy dispersive spectroscopic (EDS) analysis. The average crystallite sizes of all the samples synthesized were assessed by analyzing the XRD data with the Jade 7.0 program. In addition, the average sizes of selected Pd4Co samples were also calculated based on a random selection of 70 particles in TEM.2.3 Electrochemical characterization
The electrocatalytic activity for ORR was also assessed in single cell DMFC. In this case, the anode catalyst was a commercial 40 wt% PtRu/C (E-TEK) and the cathode catalysts were Pd/C-350, Pt/C-350, Pd4Co/C-350, and a commercial 20 wt% Pt/C. The electrodes were prepared by the same procedure described above for PEMFC. The metal or alloy loadings in the anode and cathode were, respectively, 0.8 and 0.25 mg cm−2. The electrochemical performances in DMFC of the MEAs fabricated with Nafion 112 membrane (DuPont) were evaluated by feeding a preheated 1 M methanol solution into the anode and humidified oxygen into the cathode. The temperatures of the preheated methanol solution and humidified oxygen were same as that of the cell temperature (65 °C). Further details of the PEMFC and DMFC single cell evaluations are described in ESI.†
3. Results and Discussion
3.1 Structural and microstructural analysis
Fig. 1 compares the X-ray diffraction (XRD) patterns of the Pd4Co/C and Pd/C samples prepared by the modified polyol process before and after heat treatment at various temperatures in the reducing atmosphere. The data indicate the formation of single phase products with reflections characteristic of a face-centered cubic lattice. The reflections of Pd4Co/C are shifted to higher angles, particularly after annealing at 350 and 500 °C, compared to the reflections of Pd/C, confirming the substitution of smaller Co atoms for the larger Pd atoms and the formation of Pd–Co alloy. The movement of the reflections to higher angles on going from the as-prepared to the 350 and 500 °C Pd4Co/C samples also suggests an increasing degree of alloying on annealing. Table 1 also compares the crystallite size values obtained from the XRD data using Scherrer formula for Pd4Co/C, Pd/C, and Pt/C after annealing at various temperatures. The particle size increases with increasing annealing temperature, although the increase is much greater for Pt/C compared to that for both Pd4Co/C and Pd/C.| Sample | Average crystallite size from XRDa (nm) | Average particle size from TEMb (nm) |
Pd![[thin space (1/6-em)]](https://www.rsc.org/images/entities/char_2009.gif) : :![[thin space (1/6-em)]](https://www.rsc.org/images/entities/char_2009.gif) Co atom ratio from TEM-EDS analysis Co atom ratio from TEM-EDS analysis |
|---|---|---|---|
| a Obtained by using the (111) reflections; the numbers in parentheses give the standard deviation. b The numbers in parentheses give the standard deviation. | |||
| Pd4Co/C-Ap | 4.4 (0.2) | 4.6 (2.1) | 83![[thin space (1/6-em)]](https://www.rsc.org/images/entities/char_2009.gif) : :![[thin space (1/6-em)]](https://www.rsc.org/images/entities/char_2009.gif) 17 17 |
| Pd4Co/C-350 | 8.5 (0.3) | 7.3 (4.9) | 82![[thin space (1/6-em)]](https://www.rsc.org/images/entities/char_2009.gif) : :![[thin space (1/6-em)]](https://www.rsc.org/images/entities/char_2009.gif) 18 18 |
| Pd4Co/C-500 | 10.8 (0.2) | 11.0 (4.2) | 81![[thin space (1/6-em)]](https://www.rsc.org/images/entities/char_2009.gif) : :![[thin space (1/6-em)]](https://www.rsc.org/images/entities/char_2009.gif) 19 19 |
| Pd/C-Ap | 4.8 (0.2) | — | — |
| Pd/C-350 | 8.7 (0.3) | — | — |
| Pd/C-500 | 11.5 (0.3) | — | — |
| Pt/C-Ap | 4.5 (0.2) | — | — |
| Pt/C-350 | 12.1 (0.3) | — | — |
| Pt/C-500 | 18.3 (0.2) | — | — |
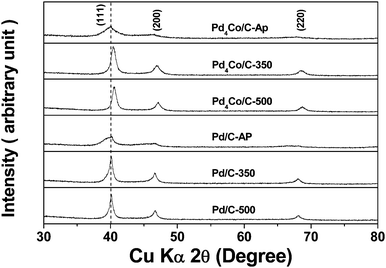 | ||
| Fig. 1 XRD patterns of the Pd4Co/C and Pd/C catalysts before and after annealing in 10% H2–90% Ar atmosphere at various temperatures. The dashed vertical line indicates the standard 2θ value corresponding to the (111) reflection of Pd metal. | ||
Fig. 2 and 3 compare the TEM photographs and the particle size distributions of the Pd4Co/C samples before and after annealing at various temperatures. As seen, the nanosize particles have predominantly spherical morphology with a uniform distribution on the carbon support. The histograms and a Gaussian fit of the TEM data in Fig. 3 indicate a narrow particle size distribution, although the 350 °C sample has a slightly broader distribution than the as-prepared and 500 °C samples. The data indicate an average particle size value of 4.6, 7.3, and 11.0 nm, respectively, for the Pd4Co/C-Ap, Pd4Co/C-350, and Pd4Co/C-500 samples, which agree closely with the crystallite size values obtained from the XRD data (Table 1).
 | ||
| Fig. 2 TEM micrographs of (a) Pd4Co/C-Ap, (b) Pd4Co/C-350, and (c) Pd4Co/C-500. | ||
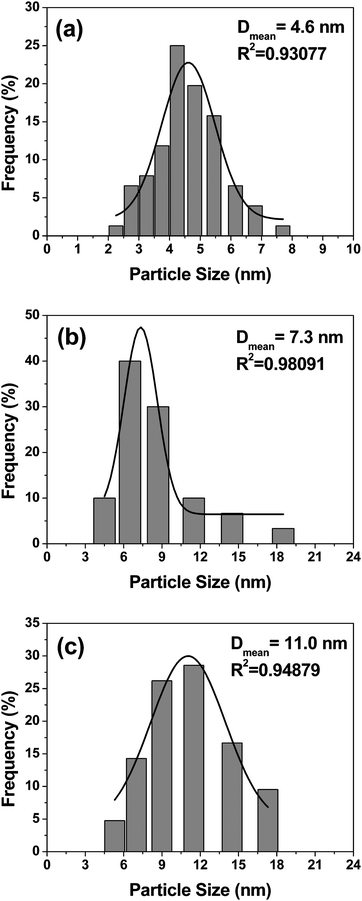 | ||
| Fig. 3 Particle size distribution histograms of (a) Pd4Co/C-Ap, (b) Pd4Co/C-350, and (c) Pd4Co/C-500. | ||
Fig. 4 shows the high resolution TEM (HRTEM) photographs of the Pd4Co/C-Ap, Pd4Co/C-350, and Pd4Co/C-500 samples. The data indicate the presence of predominantly twinned or polycrystalline nanocrystals. For each sample, the spacing between the (111) planes are also indicated in Fig. 4. The decrease in the (111) spacing from 0.2259 to 0.2222 nm with increasing annealing temperature confirm the substitution of smaller Co atoms for larger Pd atoms and an increase in the degree of alloying, which is consistent with the XRD data in Fig. 1. Moreover, EDS elemental analysis of the nanocrystals indicate a Pd![[thin space (1/6-em)]](https://www.rsc.org/images/entities/char_2009.gif) :
:![[thin space (1/6-em)]](https://www.rsc.org/images/entities/char_2009.gif) Co atom ratio of around 82
Co atom ratio of around 82![[thin space (1/6-em)]](https://www.rsc.org/images/entities/char_2009.gif) :
:![[thin space (1/6-em)]](https://www.rsc.org/images/entities/char_2009.gif) 18 (Table 1), which is close to the nominal composition of 80
18 (Table 1), which is close to the nominal composition of 80![[thin space (1/6-em)]](https://www.rsc.org/images/entities/char_2009.gif) :
:![[thin space (1/6-em)]](https://www.rsc.org/images/entities/char_2009.gif) 20.
20.
 | ||
| Fig. 4 High resolution TEM micrographs of the Pd4Co/C samples: (a) Pd4Co/C-Ap, (b) Pd4Co/C-350, and (c) Pd4Co/C-500. | ||
The TEM and XRD data thus indicate that the addition of a small amount of sodium borohydride to the polyol reduction process helps to reduce nearly all the Co2+ ions into Co, which is difficult to achieve by the conventional polyol reduction process employing polyol alone as a reducing agent. On the other hand, the controlled, slow reduction within the polymer-protected colloidal dispersions with the predominantly present mild reducing agent, polyol, offers small particle size with a narrow size distribution. The short diffusion distance within the small (∼5 nm), as-prepared nanoparticles helps to achieve a high degree of alloying at low annealing temperatures of 350–500 °C. The modified polyol method employing a mixture of a polyol and borohydride as reducing agents offers an effective approach to obtain Pd–Co alloys with a high degree of alloying while keeping the particle size small. In addition, FT-IR measurements revealed the absence of PVP in the samples.
3.2 Electrochemical studies
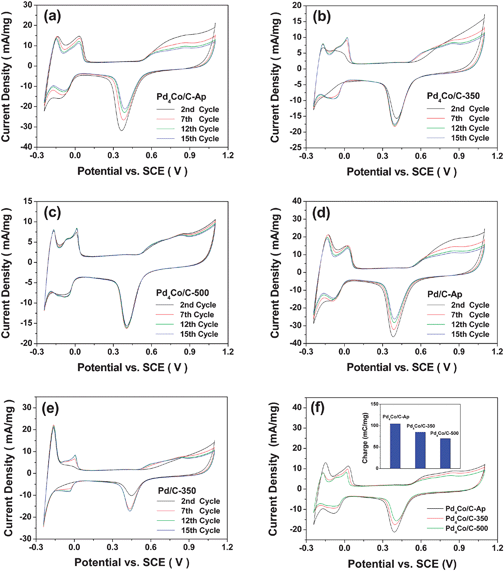 | ||
| Fig. 5 Cyclic voltammograms (CV) of the Pd4Co/C and Pd/C samples in 0.5 M H2SO4 solution at a sweep rate of 20 mV s−1 at room temperature: cycling data of (a) Pd4Co/C-Ap, (b) Pd4Co/C-350, (c) Pd4Co/C-500, (d) Pd/C-Ap, and (e) Pd/C-350 and (f) the 15th cycle data of Pd4Co/C-Ap, Pd4Co/C-350 and Pd4Co/C-500. The inset in (f) compares the 15th cycle electrochemical surface area of the three samples. | ||
The decline in electrochemical surface area with cycling becomes less pronounced with increasing annealing temperature, and the Pd4Co/C-500 sample exhibits little decline in electrochemical surface area on going from 2nd to 15th cycle. The faster decline in the electrochemical surface area of the Pd4Co/C-Ap sample on cycling in the acidic environment could be due to both the leaching out of the poorly alloyed Co and the smaller particle size (high particle surface area). The former is consistent with the increased degree of alloying between Pd and Co and improved homogeneity on annealing at 350 and 500 °C as indicated earlier by the XRD and TEM data as well as the recent theoretical calculations33 indicating that Co in Pd–Co alloy is likely to be stripped at lower potentials in acidic solutions. The latter is consistent with the faster decline in the electrochemical surface area of the Pd/C-Ap sample (with no Co) on cycling (Fig. 5(d)) due to smaller particle size while the annealed Pd/C-350 sample exhibits improved stability on cycling (Fig. 5(e)) due to larger particle size. However, the decline in electrochemical surface area on cycling is smaller for the Pd/C-Ap sample compared to that for the Pd4Co/C-Ap sample as both the leaching out of Co and the smaller particle size contribute to the instability. The decline in electrochemical surface area with smaller particle size (high particle surface area) could be due to either sintering of the smaller particles on potential cycling or easier dissolution in acid. Although one could differentiate these possibilities by a TEM evaluation of the catalyst after CV cycling, the use of Nafion in the microelectrode preparation makes it difficult to establish this unambiguously at the present time. Fig. 5(f) compares the CV scans recorded at the 15th cycle for Pd4Co/C-Ap, Pd4Co/C-350 and Pd4Co/C-500. The inset in Fig. 5(f) compares the peak area for the surface oxide reduction peak at the 15th cycle for the three samples. Although the onset potential does not vary significantly, the electrochemical surface area decreases with increasing annealing temperature due to an increase in particle size and a decrease in particle surface area.
![[thin space (1/6-em)]](https://www.rsc.org/images/entities/char_2009.gif) :
:![[thin space (1/6-em)]](https://www.rsc.org/images/entities/char_2009.gif) Co ratio at the surface and in the near-surface region could also influence the catalytic activity in addition to the particle size. Considering the cyclic voltammetry and single cell data, the Pd4Co/C-350 sample exhibits a combination of high catalytic activity for ORR and good stability.
Co ratio at the surface and in the near-surface region could also influence the catalytic activity in addition to the particle size. Considering the cyclic voltammetry and single cell data, the Pd4Co/C-350 sample exhibits a combination of high catalytic activity for ORR and good stability.
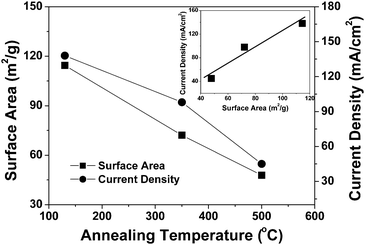 | ||
| Fig. 6 Variations with annealing temperature of the catalytic activity for ORR and the surface area of the Pd4Co/C sample. The inset shows the relationship between the electrochemical activity and surface area. | ||
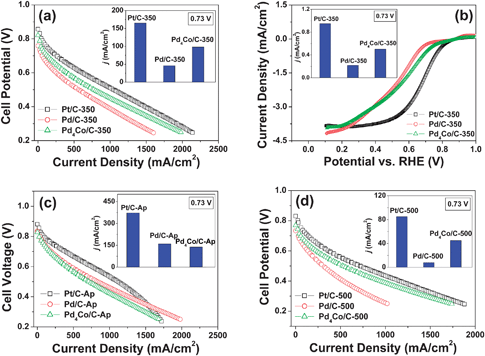 | ||
| Fig. 7 Comparison of the catalytic activities for ORR of the Pd4Co/C, Pd/C, and Pt/C samples before and after annealing at various temperatures: (a) comparison of the polarization curves recorded in single cell PEMFC of Pt/C-350, Pd/C-350 and Pd4Co/C-350 with the inset showing a comparison of the catalytic activity of the three samples at 0.73 V; (b) comparison of the linear polarization curves recorded with RDE of Pt/C-350, Pd/C-350 and Pd4Co/C-350 with the inset showing a comparison of the catalytic activity of the three samples at 0.73 V; (c) comparison of the polarization curves recorded in single cell PEMFC of Pt/C-Ap, Pd/C-Ap, and Pd4Co/C-Ap with the inset showing a comparison of the catalytic activities extracted from the single cell tests of the three samples at 0.73 V; and (d) comparison of the polarization curves recorded in single cell PEMFC of Pt/C-500, Pd/C-500, and Pd4Co/C-500 with the inset showing a comparison of the catalytic activities extracted from the single cell tests of the three samples at 0.73 V. | ||
As seen in Fig. 7(c), the as-prepared Pd/C-Ap and Pd4Co/C-Ap have lower catalytic activity for ORR than the as-prepared Pt/C-Ap although all of them have a similar particle size of ∼4.5 nm (Table 1). However, although all the three samples exhibit a decrease in catalytic activity on annealing at 350 °C (inset in Fig. 7(a)) and 500 °C (inset in Fig. 7(d)) due to an increase in crystallite size (Table 1), both the Pd/C and Pt/C samples exhibit a much faster decrease in catalytic activity compared to the Pd4Co/C sample. For example, despite a similar crystallite size of ∼8 nm after annealing at 350 °C (Table 1), the Pd4Co/C-350 sample exhibits higher catalytic activity than the Pd/C-350 sample and about 60% of the activity of Pt/C-350, indicating that the alloying of Pd with Co enhances the catalytic activity for ORR. This demonstrates that combining a metal like Co that cleaves the O–O bond easily due to the high negative free energy change for oxide formation with a metal like Pd that reduces the adsorbed oxygen easily due to the high positive standard oxidation potential offers an effective strategy to design low cost electrocatalysts.20,34 In addition, formation a core-shell structure for Pd-based alloys on annealing has been reported by Lima et al.35 due to the segregation of the noble metal Pd to the surface, which could also contribute to the variation in catalytic activity with annealing temperature. Besides, shifts in the Pd:4d band center and thus modifications in the Pd–O bond energy to a balanced level on alloying with Co so that the Pd–O bond is not too strong or too weak, as indicated by experimental and density functional theory (DFT) calculations,36 may make the ORR more facile on alloying. Thus, the slow decrease in the catalytic activity of the Pd4Co/C sample with annealing temperature compared to the Pd/C and Pt/C samples is due to a partial offset of the decrease in catalytic activity caused by the increasing particle size by the increasing degree of alloying between Pd and Co. Finally, the drastic, much faster decrease in the catalytic activity of Pt/C with annealing temperature is due to a rapid increase in crystallite size with annealing temperature (Table 1).
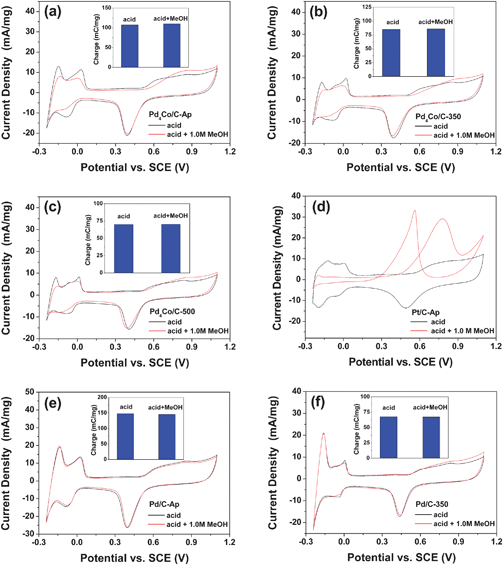 | ||
| Fig. 8 Comparisons of the cyclic voltammogram of (a) Pd4Co/C-Ap, (b) Pd4Co/C-350, (c) Pd4Co/C-500, (d) Pt/C-Ap, (e) Pd/C-Ap, and (f) Pd/C-350 in 0.5 M H2SO4 and in 0.5 M H2SO4 + 1 M methanol solution at a sweep rate of 20 mV s−1 at room temperature. The insets compare the electrochemical surface area in the presence and absence of methanol. | ||
To understand the origin of the methanol tolerance of the Pd4Co catalyst, we also recorded the CV plots of Pd/C-Ap and Pd/C-350 in the presence and absence of methanol, and Fig. 8(e) and (f) display those CV plots at 15th cycle. The Pd catalyst shows similar behavior in the presence and absence of methanol, indicating that Pd possesses high tolerance to methanol. Thus, while Pt is highly active for the methanol oxidation reaction (MOR), the inactivity of Pd for MOR avoids the adsorption of intermediates that could form during MOR on the active sites of Pd–Co alloys, resulting in a superior tolerance of Pd4Co to methanol during ORR.
Fig. 9 compares the stability of the Pd4Co/C-350 sample in presence of methanol on subjecting to 15 cycles in the CV scan. The sample exhibits excellent stability in presence of methanol similar to that observed in the absence of methanol in Fig. 5.
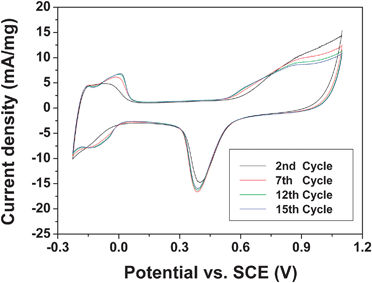 | ||
| Fig. 9 Cyclic voltammograms of the Pd4Co/C-350 sample recorded in a 0.5 M H2SO4 + 1 M methanol solution at a sweep rate of 20 mV s−1 at room temperature, illustrating the stability on cycling. | ||
Fig. 10 compares the polarization curves recorded in single cell DMFC of Pd/C-350, Pt/C-350, Pd4Co/C-350, and a commercial 20 wt% Pt in carbon electrocatalysts for ORR. As seen, Pd4Co-350 shows higher open-circuit voltage (OCV) and better catalytic activity with lower polarization loss in the activation polarization region than both the Pd/C-350 and Pt/C-350 electrocatalysts prepared by the same modified polyol process. The performance of Pd4Co-350 is comparable to that of a state-of-the-art commercial Pt/C catalyst. We believe the better performance of Pd4Co-350 compared to the Pt/C sample prepared by us by the same modified polyol method is due to both a higher tolerance of the former to methanol poisoning in addition to smaller particle size (Table 1). The combination of high catalytic activity and excellent tolerance to methanol together with a lower cost makes Pd4Co/C an attractive cathode catalyst for DMFC.
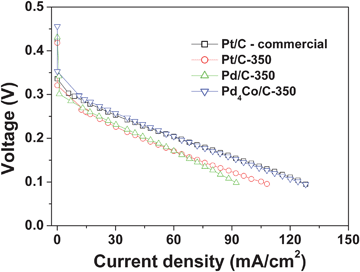 | ||
| Fig. 10 Comparison of the polarization curves recorded in single cell DMFC of Pd/C-350, Pt/C-350, Pd4Co/C-350, and a commercial 20 wt% Pt in carbon electrocatalysts for ORR at 65 °C. The methanol concentration was 1 M. | ||
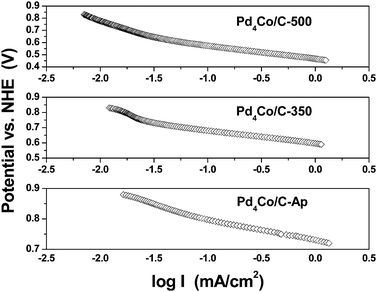 | ||
| Fig. 11 ORR Tafel plots of Pd4Co/C-Ap, Pd4Co/C-350, and Pd4Co/C-500 recorded in 0.5 M H2SO4 at a slow sweep rate of 5 mV s−1 at room temperature. | ||
4. Conclusions
Carbon-supported, nanostructured Pd4Co alloys with a controlled particle size and distribution have been synthesized by a modified polyol reduction process and evaluated as electrocatalysts for ORR. Annealing at 350 and 500 °C is found to enhance the stability (durability) significantly due to an increasing degree of alloying between Pd and Co as well as an increasing particle size. Compared to the single element (Pd and Pt) electrocatalysts, the increase in alloying also counteracts partly the decrease in catalytic activity caused by an increase in particle size during annealing at 350 and 500 °C. The sample annealed at 350 °C exhibits a combination of high catalytic activity for ORR and good stability. Linear polarization measurements indicate the ORR with the Pd4Co catalyst to involve a close to direct four electron process. In addition, the Pd4Co alloy catalysts exhibit superior tolerance to methanol poisoning compared to the conventional Pt catalysts, resulting in high catalytic efficiency for ORR in single cell DMFC. The high catalytic activity together with the low cost and high tolerance for methanol may make the Pd–Co alloys attractive as cathode electrocatalyst for DMFC.Acknowledgements
Financial support by the National Science Foundation grant CBET-0651929 and the Welch Foundation grant F-1254 is gratefully acknowledged. The authors thank Mr. Wen Li for his help in evaluating the catalysts in single cell DMFC.References
- N. Tian, Z. Zhou, S. Sun, Y. Ding and Z. Wang, Science, 2007, 316, 732 CrossRef CAS; V. R. Stamenkovic, B. Fowler, B. S. Mun, G. Wang, P. N. Ross, C. A. Lucas and N. M. Marković, Science, 2007, 315, 493 CrossRef CAS.
- M. Watanabe, K. Tsurumi, T. Mizukami, T. Nakamura and P. Stonehart, J. Electrochem. Soc., 1994, 141, 2659 CAS.
- L. Xiong and A. Manthiram, J. Mater. Chem., 2004, 14, 1454 RSC.
- L. Xiong and A. Manthiram, J. Electrochem. Soc., 2005, 152, A697 CrossRef CAS.
- S. H. Joo, S. J. Choi, M. Oh, J. Kwak, Z. Liu, O. Terasaki and R. Ryoo, Nature, 2001, 412, 169 CrossRef CAS.
- V. Raghuveer and A. Manthiram, Electrochem. Solid-State Lett., 2003, 7, A336.
- M. C. R. Martinez, D. C. Amoros, A. L. Salano, C. S. Martinez, H. Yamashita and M. Anpo, Carbon, 1995, 33, 3 CrossRef CAS.
- S. Mukerjee, S. Srinivasan and M. Soriaga, J. Electrochem. Soc., 1995, 142, 1409 CAS.
- T. Toda, H. Igarashi, H. Uchida and M. Watanabe, J. Electrochem. Soc., 1999, 146, 3750 CrossRef CAS.
- T. Toda, H. Igarashi and M. Watanabe, J. Electroanal. Chem., 1999, 460, 258 CrossRef CAS.
- J. G. Chen, Chem. Rev., 1996, 96, 1477 CrossRef CAS.
- J. M. Zen and C. B. Wang, J. Electrochem. Soc., 1994, 141, L51 CrossRef CAS.
- V. Trapp, P. Christensen and A. Hamnett, J. Chem. Soc., Faraday Trans., 1996, 144, 218 Search PubMed.
- N. A. Vante and H. Tributsch, Nature, 1986, 323, 431 CAS.
- N. Mano, J. L. Fernandez, Y. Kim, W. Shin, A. J. Bard and A. Heller, J. Am. Chem. Soc., 2003, 125, 15290 CrossRef CAS.
- N. Mano, H. H. Kim, Y. Zhang and A. Heller, J. Am. Chem. Soc., 2002, 124, 6480 CrossRef CAS.
- S. Ye and A. K. Vijh, Electrochem. Commun., 2003, 27, 272 CrossRef.
- R. Pattabhiraman, Appl. Catal., A, 1997, 153, 9 CrossRef CAS.
- O. Savadago, K. Lee, K. Oishi, S. Mitsushima, N. Kamiya and K. I. Ota, Electrochem. Commun., 2004, 105, 6.
- J. L. Fernandez, V. Raghuveer, A. Manthiram and A. J. Bard, J. Am. Chem. Soc., 2005, 127, 13100 CrossRef CAS.
- V. Raghuveer, A. Manthiram and A. J. Bard, J. Phys. Chem., 2005, 109, 22909 Search PubMed.
- V. Raghuveer, P. J. Ferreira and A. Manthiram, Electrochem. Commun., 2006, 8, 807 CrossRef CAS.
- M. H. Shao, K. Sasaki and R. R. Adzic, J. Am. Chem. Soc., 2006, 128, 3526 CrossRef CAS.
- C. Roychowdhury, F. Matsumoto, P. F. Mutolo, H. D. Abruna and F. J. Disalvo, Chem. Mater., 2005, 17, 5871 CrossRef CAS.
- Y. Sun, B. Wiley, Z. Y. Li and Y. Xia, J. Am. Chem. Soc., 2004, 126, 9399 CrossRef CAS.
- B. Wiley, T. Herricks, Y. Sun and Y. Xia, Nano Lett., 2004, 4, 1733 CrossRef CAS.
- N. Toshima and P. Lu, Chem. Lett., 1996, 9, 729.
- P. Lu, T. Teranishi, K. Asakura, M. Miyake and N. Toshima, J. Phys. Chem. B, 1999, 103, 9673 CrossRef CAS.
- R. E. Cable and R. E. Schaak, Chem. Mater., 2005, 17, 6835 CrossRef CAS.
- B. M. Leonard and R. E. Schaak, J. Am. Chem. Soc., 2006, 128, 11475 CrossRef CAS.
- H. P. Liang, H. M. Zhang, J. S. Hu, Y. G. Guo, L. J. Wan and C. L. Bai, Angew. Chem., Int. Ed., 2004, 43, 1540 CrossRef CAS.
- Y. Suo, L. Zhuang and J. Lu, Angew. Chem., Int. Ed., 2007, 46, 2862 CrossRef CAS.
- J. Greeley and J. K. Nørskov, Electrochim. Acta, 2007, 52, 5829 CrossRef CAS.
- J. L. Fernandez, D. Walsh and A. J. Bard, J. Am. Chem. Soc., 2005, 127, 357 CrossRef CAS.
- F. H. B. Lima, J. Zhang, M. H. Shao, K. Sasaki, M. B. Vukmirovic, E. A. Ticianelli and R. R. Adzic, J. Solid State Electrochem., 2008, 12, 399 CrossRef CAS.
- A. Ruban, B. Hammer, P. Stoltze, H. L. Skriver and J. K. Nørskov, J. Mol. Catal., 1997, 115, 421 CrossRef CAS; J. Greeley and J. K. Nørskov, Surf. Sci., 2005, 592, 104 CrossRef CAS; J. R. Kitchin, J. K. Nørskov, M. A. Barteau and J. G. Chen, Phys. Rev. Lett., 2004, 93, 156801 CrossRef CAS.
- V. I. Birss, A. Damjanovic and P. G. Hudson, J. Electrochem. Soc., 1986, 133, 1621; A. Damjanovic, Electrochim. Acta, 1992, 37, 2533 CrossRef CAS; A. Parthasarathy, S. Srinivasan, A. J. Appleby and C. R. Martin, J. Electrohcem. Soc., 1992, 139, 2530 Search PubMed; D. B. Sepaa, L. M. Vracara, M. V. Vojnovica and A. Damjanovicb, Electrochim. Acta, 1986, 31, 1401 CrossRef.
Footnote |
| † Electronic Supplementary Information (ESI) available: Experimental details describing synthesis and electrochemical characterization of the electrocatalysts. See DOI: 10.1039/b814708f |
| This journal is © The Royal Society of Chemistry 2009 |
