Probing the surface-enhanced Raman scattering properties of Au–Ag nanocages at two different excitation wavelengths†
Matthew
Rycenga
,
Kirk K.
Hou
,
Claire M.
Cobley
,
Andrea G.
Schwartz
,
Pedro H. C.
Camargo
and
Younan
Xia
*
Department of Biomedical Engineering, Washington University, St. Louis, 63130, Missouri, USA. E-mail: xia@biomed.wustl.edu
First published on 23rd April 2009
Abstract
The surface-enhanced Raman scattering (SERS) properties of bimetallic Au–Ag nanocages has been thoroughly investigated by changing the nanocage composition, localized surface plasmon resonance (LSPR) peak position and excitation wavelength. We found a significant dependency on excitation wavelength for the Au–Ag nanocages, independent of the underlying LSPR, which can be extended to other bimetallic SERS substrates. While it is well-understood that plasmon damping can occur for Au nanoparticles when their LSPR peaks are close to interband transition frequencies and thereby attenuate SERS intensities, this study probes an additional aspect and shows that SERS intensities are reduced when the excitation light source is near interband transition frequencies regardless of the LSPR location.
1. Introduction
Understanding the photonic properties of metal nanoparticles remains one of the most important and fascinating subjects in materials science and beyond. One of the well-known and actively studied properties is the so-called localized surface plasmon resonance (LSPR).1 Surface plasmons (SPs) are collective electronic excitations at the interface between a metal and a dielectric where conduction electrons will oscillate in resonance with light. SPs display a prominent optical resonance due to this coupling, which also generates intense local electromagnetic fields (E-fields). The LSPRs have been the focus of a great deal of research, particularly with respect to their tunability to various regions in the electromagnetic spectrum, their sensitivity for detection, and control of the intense local-fields they create.2 A common strategy for tuning the LSPR, and modifying the local-fields, has been control over the shape of the nanoparticle.3,4 Shape control is clearly important in terms of tailoring the LSPR of nanoparticles, but for catalysis and sensing applications, composition (i.e.bimetallic nanoparticles) is a useful handle for control of electronic properties and often a necessity in applied applications.5Applications of LSPRs rely on a weak plasmon damping or a slow dephasing of the optical polarization associated with the electron oscillation. A thin linewidth for an LSPR peak indicates a weak plasmon damping and is more sensitive for detection applications compared with broader linewidths.6Surface-enhanced Raman scattering (SERS) is another example of such an application that is very sensitive to LSPRs, and works best with a ‘strong’ LSPR.7,8 In SERS the intense E-fields near the surface of a metal nanoparticle, a product of the LSPR, greatly enhance Raman signals of molecules within the vicinity of the nanoparticle's surface, allowing for trace detection.9 When the oscillating plasmon dephases, which is inevitable, the E-fields also diminish and thus attenuate the SERS signals. Therefore, for SERS applications, the dephasing of the LSPR should be as slow as possible. However, this matter is typically ignored in SERS studies, and fundamental studies of LSPR dephasing, while establishing the mechanisms of plasmon decay,10–12 are relatively immature with respect to engineering nanoparticles to control LSPR damping.
Bimetallic or multicomponent nanoparticles are typically seen in systems where particles take on several functional roles including SERS.13–15 This study provides insight to some of the relationships of nanoparticle composition to SERS in terms of plasmon damping. Specifically, bimetallic Au–Ag nanocages, Ag nanocubes, and Au and Ag colloids are used to establish the importance of composition with respect to the excitation wavelength for SERS. While there have been many studies concerning the SERS of bimetallic metal nanoparticles, none seems to connect the importance of excitation wavelength with metal composition.16–18 Tuning the LSPR to coincide with the excitation wavelength is readily understood in the SERS community,19,20 but we find that the excitation wavelength, not just in terms of the location of the LSPR, can have a significant effect on the SERS of bimetallic nanoparticles which can, in turn, be readily understood in terms of plasmon damping.
2. Experimental
2.1 Materials
Silver nitrate (AgNO3, 99.8%), poly(vinyl pyrrolidone) (PVP, Mn≈ 55![[thin space (1/6-em)]](https://www.rsc.org/images/entities/char_2009.gif) 000), and chloroauric acid (HAuCl4·3H2O, 99.9%) were all obtained from Sigma-Aldrich and used as received. Ethylene glycol (EG), sodium sulfide (Na2S·9H2O, 99%), and sodium chloride (NaCl) were obtained from J. T. Baker. 1,4-Benzenedithiol (1,4-BDT, 98%) was obtained from Alfa Aesar. The Au colloid of 50 nm in size was obtained from Ted Pella. Ethanol (200 proof) was purchased from Pharmco Products. All aqueous solutions were prepared with deionized water (18.1 MΩ cm).
000), and chloroauric acid (HAuCl4·3H2O, 99.9%) were all obtained from Sigma-Aldrich and used as received. Ethylene glycol (EG), sodium sulfide (Na2S·9H2O, 99%), and sodium chloride (NaCl) were obtained from J. T. Baker. 1,4-Benzenedithiol (1,4-BDT, 98%) was obtained from Alfa Aesar. The Au colloid of 50 nm in size was obtained from Ted Pella. Ethanol (200 proof) was purchased from Pharmco Products. All aqueous solutions were prepared with deionized water (18.1 MΩ cm).
2.2 Synthesis and characterization
The Ag nanocubes were synthesized using the polyol method where AgNO3 is reduced in EG to elemental Ag and directed to grow into a specific shape. The polyol synthesis of Ag nanocubes has been developed into a robust method and a detailed protocol can be found elsewhere.21 In brief, the Ag nanocubes were synthesized by reduction of AgNO3 with glycoaldehyde (a product due to the oxidation of EG in air) in the presence of PVP and Na2S. Following synthesis, the Ag nanocubes were isolated by centrifugation, washed with water to remove EG and excess PVP and finally, dispersed in water for storage. For the Au–Ag nanocages, a detailed protocol can also be found elsewhere21 and is summarized below. In a typical synthesis, a suspension of the as-prepared Ag nanocubes was added to a preheated aqueous PVP solution, then aqueous HAuCl4 was titrated into this suspension of nanocubes with the use of a syringe pump. The reaction was monitored by UV-vis spectroscopy and the volume of HAuCl4 was adjusted to achieve the desired wavelength for the LSPR peak. The resulting product was washed with a concentrated NaCl solution to remove any AgCl that formed, and then with water or a water–ethanol mixture to remove excess PVP before being dispersed in water for further analysis. The Ag colloid was originally prepared using a polyol method for the synthesis of Ag nanospheres;22 however, the sample degraded over a period of 30 days and lost its well defined spherical shape but maintained sample homogeneity.The nanoparticles were characterized by both transmission electron microscopy (TEM) and scanning electron microscopy (SEM). An FEI TEM (Tenai G2 Spirit Twin, Hillsboro, OR) operated at 120 kV was used to take images of the nanocubes and nanocages. An FEI field-emission SEM (Nova NanoSEM 230, Hillsboro, OR) with an accelerating voltage of 15 kV was used to image the particles as well as to take energy-dispersive X-ray spectroscopy (EDX) measurements on the Au–Ag nanocages. Nanoparticle dimensions were obtained from the TEM and SEM images using ImageJ (Wayne Rasband, NIH) software. The LSPR spectra of the nanoparticles were recorded with a Varian Cary 50 UV-Vis spectrophotometer equipped with a tungsten lamp. For each sample, the nanoparticle concentration was estimated by determining the Ag+ and/or Au+ concentration with an inductively coupled plasma spectrometer (ICP-MS, Agilent 7500ce) and using this knowledge with the nanoparticle dimensions from TEM/SEM imaging and elemental compositions from EDX analysis. For this study, particle concentrations were determined in order to remove the effect of concentration on SERS, as more concentrated samples would report higher intensities.
2.3 Surface-enhanced Raman scattering
The nanoparticles were functionalized with a 1 mM ethanol solution of 1,4-BDT over a period of 24 h. Ethanol was used to wash the samples several times before resuspension in water to achieve a concentration of 3–6 nM of Ag nanocubes or Au–Ag nanocages. The Raman spectra were recorded from a solution phase using a Renishaw in Via confocal Raman spectrophotometer coupled to a Leica microscope with a 50× objective (N.A. = 0.90) in backscattering configuration. The 514 nm wavelength was generated from an argon cw laser and used with a holographic notch filter based on a grating of 1200 lines per millimetre. The 785 nm excitation was from a semiconductor cw diode laser and used with a holographic notch filter with a grating of 1200 lines per millimetre. The backscattered Raman signals were collected on a thermoelectrically cooled (−60 °C) CCD detector. Sample cells were constructed by attaching the cap of a microcentrifuge tube to a glass slide. The cap acted as a vessel for the liquid sample, and a glass cover slip (0.17–0.13 mm) was carefully placed on top to eliminate solvent evaporation and to act as a reference point from which the focal volume was lowered to a depth of 200 μm into the sample. SERS data was collected with λex = 514 nm, Plaser≈ 3.1 mW and t = 60 s; and λex = 785 nm, Plaser≈ 6.1 mW and t = 60 s.Processing of the Raman spectra and all data analysis was done with IGOR Pro software (Portland, OR). All data was baseline-corrected before normalization. For the baseline correction a fourth order polynomial was fitted to the raw Raman spectrum and subtracted. Vector normalization was done by calculating the sum of the squared intensity values of the spectrum and using the squared root of this sum as the normalization constant.23 The spectra were also corrected for differences in nanoparticle concentration.
3. Results and discussion
The objective of this study is to evaluate the SERS activity of Au–Ag bimetallic nanoparticles known as nanocages. Nanocages are bimetallic as a result of their synthesis. Nearly all kinds of hollow nanostructures require the use of templates for their formation,13,24,25 for nanocages, the template is a nanocube made entirely of Ag. The Au–Ag nanocages are formed from the Ag nanocubes through the galvanic replacement reaction. Upon reduction of the metal salt precursor HAuCl4, Au is deposited epitaxially on the surface of the Ag nanocube, while the interior of the Ag nanocube is oxidized and removed.26 Although many different kinds of Ag nanoparticles can be used to form the hollow structures,27Ag nanocubes are easy to make and impart numerous desirable qualities to the nanocages. Fig. 1A shows the Ag nanocubes that were used to form the nanocages utilized in this study. The evolution of the galvanic replacement reaction can be controlled by manipulating several variables, so that the porosity, composition, and shape associated with the nanocages can be steered for specific applications.28Fig. 1B–D show electron micrographs of the nanocages used in this study that were formed from the nanocubes by changing the amount of HAuCl4 added to the reaction. The nanocages all had approximately the same size (47 ± 7 nm in edge length), and all of them were hollow. The porosity and wall thicknesses were different, as evident from Fig. 1, with the nanocages in Fig. 1B having only a single pit and thick walls, and the other cages having more pores, predominately located at the corners with thinner walls (∼4 nm). These changes are expected, and well-documented elsewhere,26 they are not quantified here because our interest lies with the main differences of these nanocages as they relate to SERS: elemental composition and LSPR peak position. Furthermore, while porosity is often cited as a feature that should give rise to large SERS,29 in this experiment, we find no relationship between porosity and SERS intensities.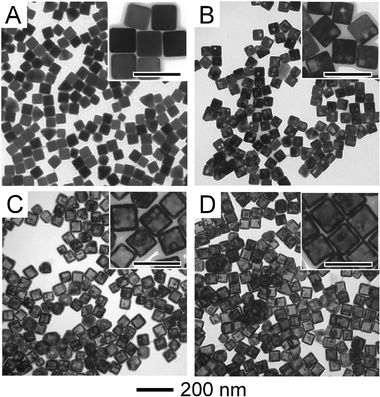 | ||
| Fig. 1 TEM images of the Ag nanocubes and Au–Ag nanocages used in this study. The scale bars in the insets are 100 nm. Nanocubes with an edge length of 45 ± 6 nm are shown in (A). These particles served as templates for the production of the Au–Ag nanocages. Nanocages with an LSPR of 525 nm and a composition of 85% Ag and 15% Au are shown in (B); nanocages with an LSPR of 685 nm and a composition of 45% Ag and 55% Au are shown in (C); nanocages with an LSPR of 760 nm and a composition of 9% Ag and 91% Au are shown in (D). TEM images of the nanocages with an LSPR of 585 nm and a composition of 73% Ag and 27% Au can be found in the ESI.† | ||
The most useful dynamic property of the nanocages is their LSPR frequency. The LSPR peak can be tuned anywhere from 500 to 1200 nm, by simply changing the molar ratio between Ag and the HAuCl4 precursor.21Fig. 2 shows the LSPR spectra of the Ag nanocubes and Au–Ag nanocages involved in this study. What is immediately noticeable is the large change in linewidth of the LSPR peaks for the Au–Ag nanocages as compared to the Ag nanocubes. This is a result of plasmon damping, which has been investigated for Au–Ag nanocages.30,31 At a rudimentary level this broadening is expected to affect the SERS of the nanocages. Broad linewidths imply a short dephasing time of the particle plasmon (the SP of a nanoparticle) which in turn means more damping for the plasmon.32 The particle plasmon is responsible for strong local E-fields which are essential for SERS measurements.8 Therefore, because the local-field enhancement factor is proportional to the plasmon dephasing time (T2), the effective SERS cross-section is then proportional to the plasmon damping by T24, as SERS scales with the fourth-power of the electric field enhancement.32 Consequently, we expect that the nanocages will have a lower SERS intensity than the nanocubes.
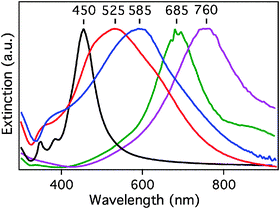 | ||
| Fig. 2 UV-Vis-NIR extinction spectra recorded from the aqueous suspensions of Ag nanocubes (LSPR at 450 nm) and Au–Ag nanocages used in this study. As the Ag/Au ratio decreased, the LSPR band of the nanocages was red-shifted. The broadening of the LSPR linewidth for the nanocages is due to dephasing of the LSPR by the introduction of Au. | ||
Fig. 3 shows the SERS spectra taken from the Ag nanocubes and Au–Ag nanocages with two different excitations. What is readily evident is the difference between the SERS spectra of the two excitations, even though these spectra were taken with identical samples in sequence. For both excitations, the Ag nanocubes reported a considerably stronger SERS when compared with the nanocages as expected by the LSPR linewidths. The SERS intensities for the 514 nm excitation diminished for nanocages with LSPR peaks at 525 and 585 nm. A low signal (signal-to-noise = 1.4) was reported for the nanocages with an LSPR peak at 685 nm and no signal was detected for the nanocages with an LSPR peak at 760 nm. For the 785 nm excitation this trend is not evident and the SERS intensities of the nanocages decrease, initially, from the nanocages with an LSPR peak at 525 nm to the nanocages with an LSPR peak at 585 nm, but then are essentially equal (see ESI†). For both excitations, the nanocages with an LSPR peak at 525 nm reported the strongest SERS.
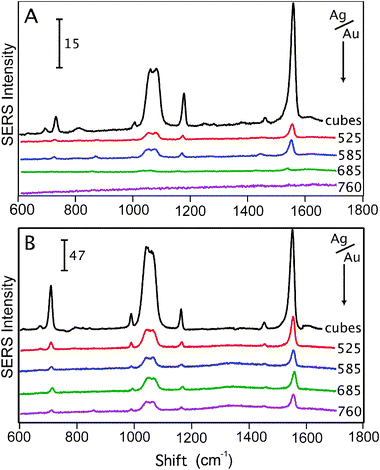 | ||
| Fig. 3 The SERS spectra of 1,4-benzenedithiol (1,4-BDT) taken from Ag nanocubes (labeled ‘cubes’ in the Figure) and nanocages where the wavelength (in nm) next to each spectrum indicates the LSPR of the nanocage sample. The spectra in (A) are from a 514 nm excitation source and in (B) a 785 nm excitation was used. The composition of the Au–Ag nanocages is governed by Au at longer wavelength LSPRs. The SERS spectra show the clear dominance of composition on the SERS intensity of a Au–Ag nanocage where the presence of more Ag increases the SERS intensity regardless of the LSPR. For the 514 nm excitation, the SERS signal decreases rapidly with increasing Au concentration in contrast to the 785 nm excitation. The SERS spectra are normalized for differences in concentration. The number and scale bar in each graph corresponds to ADU mW−1 s−1. | ||
The insensitivity of the SERS intensity to the LSPR peak position and the sensitivity to excitation wavelength is surprising, and indicates that for bimetallic nanoparticles composition is much more important than LSPR properties in terms of SERS capability. As mentioned above, the nanocages change composition considerably as their LSPR peaks are tuned to the near-infrared, becoming more inundated with Au. The question is how does this fact relate to the decreased SERS intensities? In Fig. 4, we show a mechanism that explains plasmon damping, the cause of weak SERS intensities. While the processes that induce damping are not well understood, damping of the plasmon, or plasmon dephasing, is generally thought to have two different pathways: (i) the plasmon decay occurs via transformation of particle plasmons to photons (radiative damping)33 and (ii) via non-radiative decay. The second process can involve either intraband excitations (within the conduction band) or interband excitations due to transitions between other bands like the d-orbitals of a noble metal and its conduction band.34,35 Because the particles in this study have a similar morphology and small-size, the contribution from radiative decay will be relatively the same.36 We have previously reported in single-particle Au–Ag nanocage studies that radiative decay does play a role in plasmon damping (as well as non-radiative), but for this study the similarity in nanoparticle size will eliminate this variable as spatial dimensions need to change over 10 nm for differences in radiative decay to be significant.30 However, the changing composition of the Au–Ag nanocages can introduce new dependencies to the interband excitations as a route for plasmon damping.
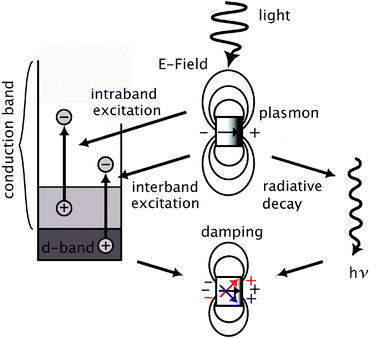 | ||
| Fig. 4 Simplified representation of radiative (right) and non-radiative (left) decay of plasmons in noble-metal nanoparticles. The non-radiative decay occurs via excitation of electron–hole pairs either within the conduction band (intraband excitation) or between the d-band and the conduction band (interband excitations). Radiative decay is proportional to the volume of the nanoparticle while non-radiative decay is inversely proportional. Plasmon decay, or damping, is manifested as the dephasing of the plasmon over the nanoparticle surface. | ||
For Au, the interband transitions have an edge at 2.5 eV (∼500 nm) compared to Ag with an edge at 3.8 eV (∼330 nm).37 The higher energy of interband transitions for Ag makes the plasmon resonance for Ag nanoparticles stronger (see Fig. 2), as it is not a route for plasmon decay. This is not the case for Au which has a relatively low energy threshold for interband transitions. Our results suggest that, even though the LSPR of the nanocages are tuned far from this edge, excitation at the interband transition frequency of Au attenuates the SERS intensities. Other reports have found dependencies relating plasmon damping to optical excitation of interband excitations,38 and more generally the sensitivity of plasmon relaxation times to the probe wavelength.39 These studies have been done with single nanoparticles where linewidths can be accurately measured as opposed to bulk systems where linewidths are broadened due to differences in particle size and local dielectric environments.
This study does not deal with single particles, but it can glean information about plasmon damping through SERS. Fig. 3 shows that SERS signals are attenuated when the excitation wavelength is close to the interband transition wavelength of Au (∼500 nm) for nanocages with a high Au content. This is readily seen in Fig. 3A where, as the Au content of the nanocages increases from 15% to 91%, the SERS signals derived from the 514 nm excitation decreased to a point where bands cannot be distinguished from the background. The fact that the LSPR of these particles is tuned far away from the interband transitions of Au does not matter. The relationship between the Au content, excitation wavelength, and SERS intensities suggests that plasmon damping is occurring non-radiatively, through interband excitations, a phenomenon commonly seen for single nanoparticles.38–41
Comparisons of the SERS of bimetallic nanoparticles (core–shell and alloy), as well as between gold and silver nanoparticles, has been done in numerous studies.16–18,42–45 These studies vary in their explanations as to why nanoparticle composition affects SERS intensities. Studies that use multiple excitations and different particles typically invoke plasmon damping from interband transitions to explain their results.17,46 Our observations are generally consistent with the results presented in these papers, however, none of these studies connect the sensitivity of nanoparticle composition to incident excitation wavelength. It is easy to show, with an expression for the dielectric function of a metal nanoparticle, that interband transitions will play a role in their polarizabilty, or SERS capability.6 However, the dependence of the excitation wavelength to interband damping, independent of the LSPR, while noted for numerous single particle studies cited above, has not been connected to SERS systems. Despite that, the role of interband damping with respect to LSPR frequency, and indirectly SERS, has been investigated at the single particle level.32,36 In these cases the importance has been tuning the LSPR away from the window of interband excitations in Au which extends from 1.8 eV (∼600 nm) to 2.5 eV (∼500 nm).37 Our data suggests that not only is it advantageous to engineer particles with a LSPR outside interband transmission windows, but also that the excitation wavelength should be outside this window as well. Fig. 3B shows the SERS from the Au–Ag nanocages with the use of 785 nm excitation. The 785 nm excitation is not in the Au interband transition window and all these bimetallic nanoparticles report measurable SERS intensities, regardless of the Au content.
We have further verified this with pure Au and Ag colloids. Fig. 5 shows the SERS of 1,4-BDT with both the 514 and 785 nm excitation. For the 785 nm excitation, both samples showed appreciable SERS signals with the Ag colloid reporting a higher SERS intensity. For the 514 nm excitation there was no SERS signal for the Au colloid; however, there was a very strong signal for the Ag colloid. For these systems, these dependencies are well-understood because the LSPR of the Au colloid (530 nm, see ESI†) is essentially on the edge of the interband transition window for Au, and the LSPR of the Ag colloid (∼440 nm) is far from the Ag interband transition edge of 380 nm. This is not the case for the Au–Ag nanocages, which have LSPRs approaching the near-infrared. This comparison is important with respect to the Au–Ag nanocages in light of their bimetallic nature. The nanocages are currently believed to be alloys.24,26,27 Alloys can alter the interband transitions as well as much of the electronic properties of the constituent metals, although to what extent is still unknown.47 In the case of Au–Ag alloys the interband contribution to the dielectric function of the metal system differs from both Ag and Au, but rapidly approaches Au with increasing Au content.48 Our results support the idea that with increasing Au content in the bimetallic nanocages, the interband transition frequencies approach that of Au even though the LSPR approaches the near-infrared. This is readily seen in Fig. 5, where the Au colloid, like the Au–Ag nanocages with high Au content, have no appreciable SERS intensities for the 514 nm excitation, which lies in the Au interband transition window. The difference is that for Au–Ag nanocages the LSPR lies outside the interband transitions for Au. While it is possible the interband transition window is modified in light of the bimetallic nature of the Au–Ag nanocages to include lower energy transitions, this explanation does not fit with other reports of bimetallic nanoparticles of Au–Ag giving appreciable SERS signals for ∼650 nm excitation and, similar to this study, low intensities or nothing for excitations near the high-energy interband frequency edge of Au.17,42 Our work suggests a strong relationship between the SERS activity of a bimetallic system with respect to the wavelength of excitation regardless of the underlying LSPR.
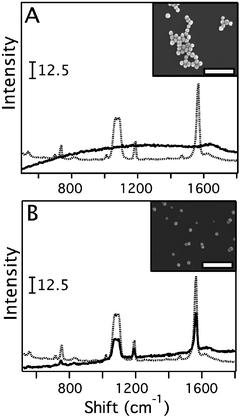 | ||
| Fig. 5 The SERS spectra of 1,4-benzenedithiol (1,4-BDT) recorded from a Au colloid (A) and a Ag colloid (B) with 514 nm excitation (solid line) and 785 nm excitation (dotted line). The insets show SEM images of the particles, where the scale bars represent 300 nm. For the Au colloid (LSPR 530 nm), no SERS spectrum was detected with 514 nm excitation due to the presence of interband excitations which have an edge at ∼2.5 eV (500 nm) for Au. With 785 nm excitation the SERS spectrum was readily detectable. For the Ag colloidal both excitation wavelengths gave detectable signals. | ||
4. Conclusion
This study shows experimentally the relationship between SERS intensities and the composition of Ag–Au bimetallic nanoparticles. We found, interestingly, that the wavelength of excitation, independent of the LSPR, plays a decisive role in determining the SERS capability of a bimetallic nanoparticle. The relationship between the Au composition and excitation wavelength is clear: the more Au in the particle, the weaker the SERS intensity with the 514 nm excitation, regardless of the LSPR. This trend was not observed for the 785 nm excitation and clearly suggests the involvement of Au interband transitions as a damping mechanism for the LSPR, which in turn attenuates the SERS intensities. The fact that this damping occurs for the Au–Ag nanocages with high Au contents even though the LSPR is tuned to a number of frequencies shows the optically induced nature of this damping. More work needs to be done in order to fully understand this dependence; particularly single particle pump–probe studies where LSPR linewidths can be measured accurately over short time scales. This report aims to establish not only the connection between SERS and plasmon damping, but also more specifically the importance of excitation wavelength, not just LSPR frequencies, in terms of engineering SERS systems for optimum performance.Acknowledgements
This work was supported in part by the NSF through a research grant from DMR (0804088) and the NIH through a 2006 Director’s Pioneer Award (5DP1OD000798-04). We thank the Jens Environmental Molecular and Nanoscale Analysis Laboratory at Washington University in St. Louis for the ICP-MS analysis.References
- U. Kreibig and M. Vollmer, Optical Properties of Metal Clusters, vol. 25, Springer-Verlag, Berlin, Germany, 1995 Search PubMed.
- (a) M. Cooper, Nat. Rev. Drug Discovery, 2002, 1, 515 CrossRef CAS; (b) S. Lal, S. Link and N. Halas, Nat. Photonics, 2007, 1, 641 Search PubMed; (c) E. Larsson, J. Alegret, M. Kall and D. Sutherland, Nano Lett., 2007, 7, 1256 CrossRef CAS; (d) S. Maier, P. Kik, H. Atwater, S. Meltzer, E. Harel, B. Koel and A. Requicha, Nat. Mater., 2003, 2, 229 CrossRef CAS.
- B. Wiley, S. Im, Z.-Y. Li, J. McLellan, A. Siekkinen and Y. Xia, J. Phys. Chem. B, 2006, 110, 15666 CrossRef CAS.
- Y. Xia and N. Halas, MRS Bull., 2005, 30, 338 CAS.
- (a) Z. Chen, S. Tabakman, A. Goodwin, M. Kattah, D. Daranciang, X. Wang, G. Zhang, X. Li, Z. Liu, P. Utz, K. Jiang, S. Fan and H. Dai, Nat. Biotechnol., 2008, 26, 1285 CrossRef CAS; (b) V. Stamenkovic, B. Mun, M. Arenz, K. Mayrhofer, C. Lucas, G. Wang, P. Ross and N. Markovic, Nat. Mater., 2007, 6, 241 CrossRef CAS; (c) A. Salem, P. Searson and K. Leong, Nat. Mater., 2003, 2, 668 CrossRef CAS; (d) A. Aricò, P. Bruce, B. Scrosati, J.-M. Tarascon and W. van Schalkwijk, Nat. Mater., 2005, 4, 366 CrossRef CAS; (e) F. Frederix, J.-M. Friedt, K.-H. Choi, W. Laureyn, A. Campitelli, D. Mondelaers, G. Maes and G. Borghs, Anal. Chem., 2003, 75, 6894 CrossRef CAS.
- A. Haes and R. P. Van Duyne, Anal. Bioanal. Chem., 2004, 379, 920 CrossRef CAS.
- A. Wokaun, J. Gordon and P. Liao, Phys. Rev. Lett., 1982, 48, 957 CrossRef CAS.
- K. Kneipp, Y. Wang, H. Kneipp, L. Perelman, I. Itzkan, R. Dasari and M. Feld, Phys. Rev. Lett., 1997, 78, 1667 CrossRef CAS.
- M. Moskovits, J. Raman Spectrosc., 2005, 36, 485 CrossRef CAS.
- T. Pakizeh, C. Langhammer, I. Zorić, P. Apell and M. Käll, Nano Lett., 2009, 9, 882 CrossRef CAS.
- T. Shahbazyan and I. Perakis, Chem. Phys., 2000, 251, 37 CrossRef CAS.
- B. Balamurugan and T. Maruyama, Appl. Phys. Lett., 2005, 87, 143105 CrossRef.
- G. Liu, Y. Lu, J. Kim, J. Doll and L. Lee, Adv. Mater., 2005, 17, 2683 CrossRef CAS.
- H. Gu, P.-L. Ho, K. Tsang, L. Wang and B. Xu, J. Am. Chem. Soc., 2003, 125, 15702 CrossRef CAS.
- X. Zhang, J. Zhao, A. Whitney, J. Elam and R. VanDuyne, J. Am. Chem. Soc., 2006, 128, 10304 CrossRef CAS.
- N. Flynn and A. Gewirth, J. Raman Spectrosc., 2002, 33, 243 CrossRef CAS.
- R. Alvarez-Puebla, D. Ross, G.-A. Nazri and R. Aroca, Langmuir, 2005, 21, 10504 CrossRef CAS.
- S. Hunyadi and C. Murphy, J. Mater. Chem., 2006, 16, 3929 RSC.
- G. Baker and D. Moore, Anal. Bioanal. Chem., 2005, 382, 1751 CrossRef CAS.
- A. McFarland, M. Young, J. Dieringer and R. Duyne, J. Phys. Chem. B, 2005, 109, 11279 CrossRef CAS.
- S. E. Skrabalak, L. Au, X. Li and Y. Xia, Nat. Protoc., 2007, 2, 2182 Search PubMed.
- M. Kim, X. Lu, B. Wiley, E. Lee and Y. Xia, J. Phys. Chem. C, 2008, 112, 7872 CrossRef CAS.
- N. Afseth, V. H. Segtnan and J. P. Wold, Appl. Spectrosc., 2006, 60, 1358 CrossRef CAS.
- Y. Sun and Y. Xia, Nano Lett., 2003, 3, 1569 CrossRef CAS.
- C. Loo, L. Hirsch, M.-H. Lee, E. Chang, J. West, N. Halas and R. Drezek, Opt. Lett., 2005, 30, 1012 Search PubMed.
- S. Skrabalak, J. Chen, Y. Sun, X. Lu, L. Au, C. Cobley and Y. Xia, Acc. Chem. Res., 2008, 41, 1587 CrossRef CAS.
- Y. Sun and Y. Xia, J. Am. Chem. Soc., 2004, 126, 3892 CrossRef CAS.
- J. Chen, D. Wang, J. Xi, L. Au, A. Siekkinen, A. Warsen, Z.-Y. Li, H. Zhang, Y. Xia and X. Li, Nano Lett., 2007, 7, 1318 CrossRef CAS.
- (a) S. Oldenburg, S. Westcott, R. Averitt and N. Halas, J. Chem. Phys., 1999, 111, 4729 CrossRef CAS; (b) E. Hao, S. Li, R. Bailey, S. Zou, G. Schatz and J. Hupp, J. Phys. Chem. B, 2004, 108, 1224 CrossRef CAS.
- M. Hu, C. Novo, A. Funston, H. Wang, H. Staleva, S. Zou, P. Mulvaney, Y. Xia and G. Hartland, J. Mater. Chem., 2008, 18, 1949 RSC.
- M. Hu, H. Petrova, A. Sekkinen, J. Chen, J. McLellan, Z.-Y. Li, M. Marquez, X. Li, Y. Xia and G. Hartland, J. Phys. Chem. B, 2006, 110, 19923 CrossRef CAS.
- T. Klar, M. Perner, S. Grosse, G. Plessen, W. Spirkl and J. Feldmann, Phys. Rev. Lett., 1998, 80, 4249 CrossRef CAS.
- D. Pines, Rev. Mod. Phys., 1956, 28, 184 CrossRef CAS.
- A. Pinchuk, G. Plessen and U. Kreibig, J. Phys. D: Appl. Phys., 2004, 37, 3133 CrossRef CAS.
- J. Marton and B. Jordan, Phys. Rev. B: Solid State, 1977, 15, 1719 CrossRef CAS.
- C. Sönnichsen, T. Franzl, T. Wilk, G. Plessen, J. Feldmann, O. Wilson and P. Mulvaney, Phys. Rev. Lett., 2002, 88, 077402 CrossRef CAS.
- P. Johnson and R. Christy, Phys. Rev. B: Solid State, 1972, 6, 4370 CrossRef CAS.
- M. Perner, P. Bost, U. Lemmer, G. von Plessen, J. Feldmann, U. Becker, M. Mennig, M. Schmitt and H. Schmidt, Phys. Rev. Lett., 1997, 78, 2192 CrossRef CAS.
- J. Bigot, J. Merle, O. Cregut and A. Daunois, Phys. Rev. Lett., 1995, 75, 4702 CrossRef CAS.
- E. Dulkeith, T. Niedereichholz, T. Klar, J. Feldmann, G. Plessen, D. Gittins, K. Mayya and F. Caruso, Phys. Rev. B: Condens. Matter Mater. Phys., 2004, 70, 205424 CrossRef.
- V. Kruglyak, R. Hicken, P. Matousek and M. Towrie, Phys. Rev. B: Condens. Matter Mater. Phys., 2007, 75, 035410 CrossRef.
- L. Rivas, S. Sanchez-Cortes, J. Garcia-Ramos and G. Morcillo, Langmuir, 2000, 16, 9722 CrossRef CAS.
- R. Freeman, M. Hommer, K. Grabar, M. Jackson and M. Natan, J. Phys. Chem., 1996, 100, 718 CrossRef CAS.
- N. Jana, Analyst, 2003, 128, 954 RSC.
- P.-P. Fang, J.-F. Li, Z.-L. Yang, B. Li and Z.-Q. Tian, J. Raman Spectrosc., 2008, 39, 1679 CrossRef CAS.
- Z. Wang, B. Lukyanchuk, W. Guo, S. Edwardson, D. Whitehead, L. Li, Z. Liu and K. G. Watkins, J. Chem. Phys., 2008, 128, 094705 CrossRef CAS.
- V. Belotelov, G. Carotenuto, L. Nicolais, A. Longo, G. Pepe, P. Perlo and A. Zvezdin, J. Appl. Phys., 2006, 99, 044304 CrossRef.
- M. Moskovits, I. Srnova-Sloufova and B. Vlckova, J. Chem. Phys., 2002, 116, 10435 CrossRef CAS.
Footnote |
| † Electronic supplementary information (ESI) available: TEM images, UV-vis-NIR extinction spectra and SERS intensity graphs. See DOI: 10.1039/b903533h |
| This journal is © the Owner Societies 2009 |