Modelling energy level alignment at organic interfaces and density functional theory
F.
Flores
*a,
J.
Ortega
a and
H.
Vázquez
b
aDepartamento de Física Teórica de la Materia Condensada, Universidad Autónoma de Madrid, 28049, Spain. E-mail: fernando.flores@uam.es; Fax: +34 91![[thin space (1/6-em)]](https://www.rsc.org/images/entities/char_2009.gif) 497
497![[thin space (1/6-em)]](https://www.rsc.org/images/entities/char_2009.gif) 4950; Tel: +34 91
4950; Tel: +34 91![[thin space (1/6-em)]](https://www.rsc.org/images/entities/char_2009.gif) 497
497![[thin space (1/6-em)]](https://www.rsc.org/images/entities/char_2009.gif) 5043
5043
bDTU-Nanotech, Technical University of Denmark, DTU, DK-2800, Lyngby, Denmark
First published on 12th August 2009
Abstract
A review of our theoretical understanding of the band alignment at organic interfaces is presented with particular emphasis on the metal/organic (MO) case. The unified IDIS (induced density of interface states) and the ICT (integer charge transfer) models are reviewed and shown to describe qualitatively and semiquantitatively the barrier height formation at those interfaces. The IDIS model, governed by the organic CNL (charge neutrality level) and the interface screening includes: (a) charge transfer across the interface; (b) the “pillow” (or Pauli) effect associated with the compression of the metal wavefunction tails; and (c) the molecular dipoles. We argue that the ICT-model can be described as a limiting case of the unified IDIS-model for weak interface screening. For a fully quantitative understanding of the band alignment at organic interfaces, use of DFT (density functional theory) or quantum chemistry methods is highly desirable. In this Perspective review, we concentrate our discussion on DFT and show that conventional LDA or GGA calculations are limited by the “energy gap problem of the organic materials”, because the LDA (or GGA) Kohn–Sham energy levels have to be corrected by the self-interaction energy of the corresponding wavefunction, to provide the appropriate molecule transport energy gap. Image potential and polarization effects at MO interfaces tend to cancel these self-interaction corrections; in particular, we show that for organic molecules lying flat on Cu and Ag, these cancellations are so strong that we can rely on conventional DFT to calculate their interface properties. For Au, however, the cancellations are weaker making it necessary to go beyond conventional DFT. We discuss several alternatives beyond conventional LDA or GGA. The most accurate approach is the well-known GW-technique, but its use is limited by its high demanding computer time. In a very simple approach one can combine conventional DFT with a “scissor” operator which incorporates self-interaction corrections and polarization effects in the organic energy levels. Hybrid potentials combined with conventional DFT represent, probably, the best alternative for having a simple and accurate approach for analyzing organic interfaces. The problem then is to find an appropriate one for both the metal and the organic material in a plane-wave formulation; we show, however, how to overcome this difficulty using a local-orbital basis formulation. As examples of these alternatives, we present some DFT-calculations for several organic interfaces, using either the scissor operator or a hybrid potential, which can be interpreted in terms of the unified IDIS-model.
 F. Flores F. Flores | Fernando Flores received his PhD from the Polytechnic University of Madrid in 1970. He was a postdoctoral fellow in Lille (France), Imperial College (London) and the Research Council in Madrid. A Full Professor in the Autonomous University of Madrid from 1980 until now, he has been Head of Department for more than 25 years and has supervised 26 PhD theses. His research interests extend over the field of condensed matter and solid state physics and he is currently interested in organic interfaces and nanoscience. A Fellow of the American Physical Society, he has also received the Spanish National Prize of Physics. |
 J. Ortega J. Ortega | José Ortega received his PhD in 1991 from the Universidad Autónoma de Madrid (UAM). In 1992–1993 he was a postdoctoral researcher in Arizona State University, and in 1993–1994 a postdoctoral researcher in the University of Cambridge. From 1995 up to now he is an Associate Professor in the UAM. His research interests include the development and application of local-orbital first-principles techniques for the atomistic simulation of complex materials, such as organic interfaces, reversible phase transitions on semiconductor surfaces, van der Waals interactions, etc. |
 H. Vázquez H. Vázquez | Héctor Vázquez received his PhD in physics from the Universidad Autónoma de Madrid in 2006. His thesis, entitled Energy level alignment at organic semiconductor interfaces, was supervised by Fernando Flores. In 2007–2008, he was a postdoc in the group of Mads Brandbyge and Antti-Pekka Jauho at the Technical University of Denmark, working on single-molecule transport. His research interests include electronic structure at organic interfaces and molecular quantum transport. In 2009, he will join Latha Venkataraman’s group at Columbia University. |
1. Introduction
New electronic devices based on organic materials, like OFETs, OLEDs and photovoltaic cells, have already started to appear in the market. The growing field of organic and spin-based electronics relies on the use of organic conjugated molecules and polymers as active components in multilayer device applications.1 The performance of these organic devices depends crucially on the different energy barriers that control carrier injection into, and transport between, different layers. These energy barriers are key quantities for organic thin film devices and are determined by the relative positions of molecular levels across metal–organic (MO) and organic-organic (OO) semiconductor interfaces.1–4Fig. 1 shows the energy diagram for an organic light emitting diode (OLED) with three interfaces. In this device, electrons and holes are injected across MO interfaces into the two organic films of the system; these charges are collected at the OO interface, where electron-hole recombination creates the emitted photon. The performance of this device depends on how electrons and holes are injected into the organic materials and on the way those charges are collected and recombine at the OO interface: this is determined by the barriers at the different MO and OO interfaces. Since the barriers are one of the most important physical parameters defining device behaviour, understanding interface mechanisms and predicting energy level alignment is therefore highly relevant to engineering new devices and designing new functionalities.
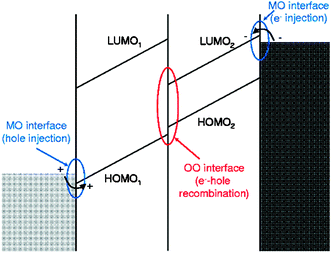 | ||
| Fig. 1 Schematic energy level diagram for an organic light-emitting diode. Two organic thin films are placed in between metal electrodes; electrons and holes are injected across the MO interfaces into the two organic films of the system. These charges are collected at the OO interface, where electron-hole recombination creates the emitted photon. | ||
Molecular level alignment at organic junctions has been extensively investigated over the last decade.5–8 In particular, vacuum evaporation of molecular films on clean metal surfaces has been shown experimentally9,10 to yield intimate MO interfaces that depart from the Schottky–Mott limit (where the vacuum level alignment rule is used) due to the formation of a substantial interface dipole (section II will be devoted to presenting this experimental evidence). Fig. 2 shows the energy diagram for such an interface with and without the interface dipole. Many different physical mechanisms take place, in some cases simultaneously, in the level alignment at MO interfaces, contributing to the interface dipole: chemical reaction and the formation of gap states in the organic material;8,11–14 orientation of molecular dipoles;15,16 or compression of the metal electron tails at the MO interface due to Pauli repulsion.13,17–19 We also suggested20,21 that an additional important mechanism (discussed in section IV) is the tendency of the charge neutrality level (CNL) of the organic material to align with the metal Fermi level (or with the CNL of the other organic material at OO interfaces22); this mechanism is associated with the rearrangement of charge at the interface, and this is why the model is called the induced density of interface states (IDIS) model. More recently, this model has been extended19 to include Pauli repulsion and intrinsic molecular dipoles.23 While in the IDIS model the mechanism associated with the barrier formation is mainly due to the rearrangement of charge at the interface, in the integer charge transfer (ICT) model24 polaronic states in the organic material are assumed to modify the transfer mechanism, creating spontaneous integer charge transfer at the interface (see section V).
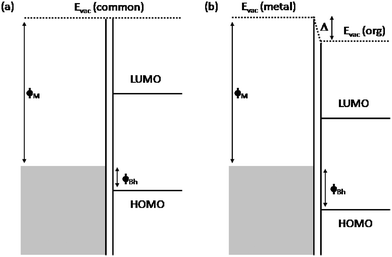 | ||
| Fig. 2 Band alignment at a MO junction. In the Schottky–Mott limit (left) there is no induced electrostatic dipole at the interface, and the vacuum levels (Evac) are aligned. The alignment of the energy levels of the organic and metal in the presence of an interface dipole (Δ) is shown on the right. | ||
Chemical reactions at organic interfaces, as well as the unified IDIS model, with Pauli repulsion and molecular dipoles included are, in principle, amenable to DFT-calculations; the ICT-model, which can be expected to appear during an important electron–phonon interaction in the organic material, should be analyzed going beyond DFT, by introducing an appropriate electron–phonon self-energy. However, a conventional-DFT calculation (a Kohn–Sham DFT calculation using e.g. the LDA or GGA exchange–correlation functionals) for organic interfaces would not allow an accurate determination of the charge transfer at the interface, since organic molecular energy gaps in the gas phase can be underestimated by several eVs25–33 (the situation at interfaces will be discussed below). This is the “organic energy gap problem” that is related to the fact that Kohn–Sham eigenvalues are not a proper representation of quasiparticle excitation energies: in conjugated organic molecules, the difference between the Kohn–Sham HOMO and LUMO eigenvalues is significantly smaller that the transport gap measured experimentally.34–36 This discrepancy largely arises from the fact that the Kohn–Sham DFT gap refers to the N-electron calculation, while the transport gap Et involves total energy differences with the molecule in a charged state. Et is given by the difference between the ionization (I) and affinity (A) levels: Et = I−A, where
| I = E[N] −E[N− 1]; A = E[N + 1] −E[N] | (1) |
2. Experiments
This is a very brief presentation of the experiments carried out to measure the interface properties of the organic interfaces (for a more complete presentation of these experiments, see ref. 37–41). The main techniques used in these systems are ultraviolet photoemission spectroscopy (UPS) and inverse photoemission electron spectroscopy (IPES). In UPS either synchrotron radiation or a helium discharge lamp (with energies of 21.22, HeI, or 40.8 eV, HeII) are used to excite electrons from the valence band; the UPS-spectrum (see Fig. 3) characterizes the different molecular levels and, in particular, the highest occupied molecular orbital (HOMO), the closest (red in Fig. 3) to the Fermi energy, which is measured separately on a metallic electrode.37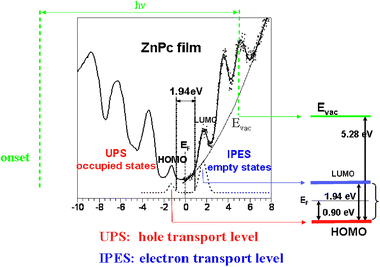 | ||
| Fig. 3 UPS and IPES data for a ZnPc-film; the onset of the UPS-spectrum is also shown.5,37–41 The vacuum level, as well as the LUMO and HOMO levels of the organic film, are extracted from these experiments. The right panel shows the HOMO and LUMO levels as extracted from the combined UPS and IPES spectroscopic measurements as well as the interface Fermi level.42 Figure reprinted, from ref. 97, with permission from Elsevier. Copyright 2002. | ||
Empty states are studied using IPES in the isochromat mode, changing the electron energy while keeping the detected photon energy fixed.38–41 This spectrum defines the empty density of states (see Fig. 3) and, in particular, the lowest unoccuppied molecular orbital (LUMO), the blue one in Fig. 3. The right panel of Fig. 3 shows, for a ZnPc material, the HOMO and LUMO levels as extracted from the UPS and IPES spectroscopic measurements (aligned using the metal Fermi edge), as well as the interface Fermi level and the different barriers, for electrons and holes, at the interface.42
When an organic film is deposited on a metal, the induced interface electrostatic dipole, Δ, can also be measured using UPS. This dipole is determined by the shift of the photoemission spectrum onset (associated with electron secondary emission) as shown in Fig. 437 for the case of α-NPD on Au: the shift, Δ, in the spectrum onset yields the interface dipole. The lower panel of Fig. 4 shows how this interface dipole can be combined with the UPS-spectrum to obtain the full diagram of the metal/organic interface.37
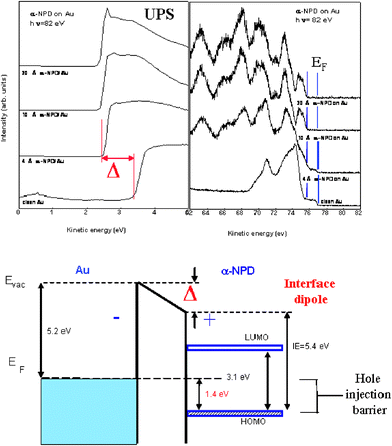 | ||
| Fig. 4 UPS-spectra for a Au/α-NPD interface as a function of the organic deposition. The change in the onset of the photoemission spectrum yields the interface dipole.5,37–41 The lower panel shows how this interface dipole can be combined with the UPS-spectrum to obtain the energy level diagram of the metal/organic interface.37 Figure reproduced, from ref. 28, with permission from Marcel Dekker. Copyright 2002. | ||
The use of photoemission to analyze organic band offsets, pioneered by the groups of Kahn, Salaneck and Seki, thus provides essential information about the level alignment. Fig. 5 shows a summary of the main results37 for different MO interfaces. In this figure, the interface Fermi level (in red) is shown, for a given organic compound, as a function of the metal workfunction; the blue line shows the value one would expect to have for the Fermi level if the Schottky–Mott limit would define the interface behaviour. Different experimental values seem to fall in a straight line whose slope is S (see below for a theoretical definition of S). On the other hand, Fig. 6 shows the interface dipoles and the barrier heights, as obtained with UPS and IPS,for different O/O interfaces.43
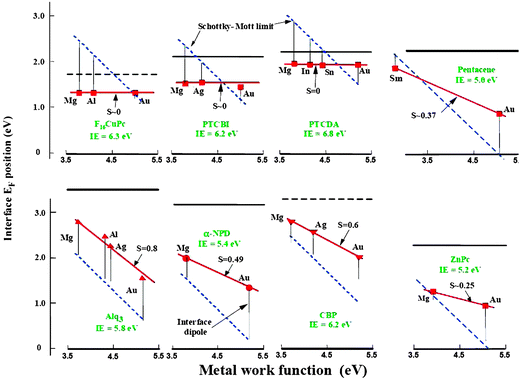 | ||
| Fig. 5 Experimental evidence for metal/organic interfaces: interface Fermi level (in red) for different organic compounds, as a function of the metal workfunction. The blue lines show the Schottky–Mott limit result.5,37,43 Reprinted, from ref. 98, with permission of John Wiley & Sons, Inc. Copyright 2003. | ||
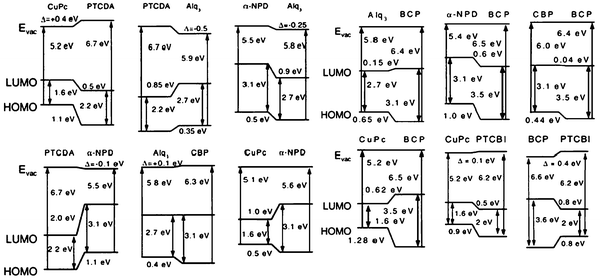 | ||
| Fig. 6 Energy level diagrams and interface dipoles for different organic/organic hetero-junctions obtained from UPS and IPES experiments.5,43 Figure reprinted, from ref. 34, with permission from Elsevier. Copyright 2000. | ||
3. The energy gap problem in organic materials. Calculation of the molecular transport gap and image potential effects
3.1 Transport energy gap and corrections to the molecular levels
As mentioned above, the transport energy gap for organic molecules cannot be correctly described by conventional DFT calculations. We are going to illustrate how a particular formulation of DFT, the so called LCAO-OO method,44,45 can be useful to formulate corrections to the DFT level positions. The OO method uses a local orthogonal orbital basis, ϕiασ, and instead of using a functional, E[ρ(![[r with combining right harpoon above (vector)]](https://www.rsc.org/images/entities/i_char_0072_20d1.gif) )], of the charge density, ρ(
)], of the charge density, ρ(![[r with combining right harpoon above (vector)]](https://www.rsc.org/images/entities/i_char_0072_20d1.gif) ), a function E[niασ] of the orbital occupancies (OO), niασ, is used.46 In this approach, an orthogonal basis, ϕiασ, defined by the Lowdin’s transformation46 is used, so that niασ is the charge associated with the Lowdin’s orbital iασ. The first step in formulating the OO-method is to write down all the significant contributions to the total energy E[niσ] as an explicit function of niασ. For this purpose, the following many-body Hamiltonian is introduced:
), a function E[niασ] of the orbital occupancies (OO), niασ, is used.46 In this approach, an orthogonal basis, ϕiασ, defined by the Lowdin’s transformation46 is used, so that niασ is the charge associated with the Lowdin’s orbital iασ. The first step in formulating the OO-method is to write down all the significant contributions to the total energy E[niσ] as an explicit function of niασ. For this purpose, the following many-body Hamiltonian is introduced: | (2) |
![[n with combining circumflex]](https://www.rsc.org/images/entities/i_char_006e_0302.gif) iασ and Ĉiασ+Ĉjασ =
iασ and Ĉiασ+Ĉjασ = ![[n with combining circumflex]](https://www.rsc.org/images/entities/i_char_006e_0302.gif) iασ,jασ define the density matrix operator with mean values niασ and niασ,jβσ, respectively; Eiασ is the one electron contribution to the energy of the orbital iασ; and
iασ,jασ define the density matrix operator with mean values niασ and niασ,jβσ, respectively; Eiασ is the one electron contribution to the energy of the orbital iασ; and ![[T with combining circumflex]](https://www.rsc.org/images/entities/i_char_0054_0302.gif) iασ,jβσ the hopping between orbitals iασ and jβσ.44 In eqn (2), Ui,αβ(Jiα,jβ) are intraatomic (interatomic) electron–electron integrals which represent the most important contributions to the two body interaction. The term δĤ0 is small and it is not going to be discussed in detail here (see ref. 44). In this approach the most important contribution to the exchange–correlation energy, Exc, comes from the Coulomb one-center U and two-center J terms. The exchange hole contribution is obtained46 using a mean-field approximation such that:
iασ,jβσ the hopping between orbitals iασ and jβσ.44 In eqn (2), Ui,αβ(Jiα,jβ) are intraatomic (interatomic) electron–electron integrals which represent the most important contributions to the two body interaction. The term δĤ0 is small and it is not going to be discussed in detail here (see ref. 44). In this approach the most important contribution to the exchange–correlation energy, Exc, comes from the Coulomb one-center U and two-center J terms. The exchange hole contribution is obtained46 using a mean-field approximation such that: | (3) |
 | (4) |
| Vxciασ = δExc/δniασ | (5) |
![[n with combining circumflex]](https://www.rsc.org/images/entities/i_char_006e_0302.gif) iασ) to the effective one-electron Hamiltonian of the system.
iασ) to the effective one-electron Hamiltonian of the system.
Then, neglecting contributions from δĤ0, the effective one-electron Hamiltonian associated with the LCAO-OO approach is the following:
 | (6) |
 ; solving this Hamiltonian self-consistently yields niσ and, in a further step, the total energy, E[niασ], of the system.
Calculations using this LCAO-OO approach and a DFT method,25,47 which use the standard LDA functional for the exchange–correlation energy48–50 or the GGA approximation,28,29 were performed for several organic molecules. Results for the benzene and PTCDA molecules (using a minimal basis set in the case of ref. 25) are given in Table 1.
| Benzene | HOMO | LUMO | Gap |
|---|---|---|---|
| Benzene | |||
| OO LDA 25 | −3.6 | 2.0 | 5.6 |
| Fireball LDA25 | −6.1 | −0.7 | 5.4 |
| GGA28 | 4.7 | ||
| GGA29 | 4.7 | ||
| Plane Wave LDA33 | 5.1 | ||
| LDA 47 | 5.16 | ||
| GW 47 | 10.51 | ||
| OO LDA incl. level corrections [eqn (16)] | −7.3 | 5.7 | 13.0 |
| OO LDA and eqn (1) | 11.9 | ||
| Exp.26 | −9.2 | 1.1 | 10.3 |
| PTCDA | |||
| OO LDA | −4.0 | −2.4 | 1.6 |
| Fireball LDA25 | −5.8 | −4.3 | 1.5 |
| GGA31 | 1.6 | ||
| Fireball LDA incl. level corrections [eqn (16)] | −6.2 | −0.2 | 6.0 |
| Fireball using LDA and eqn (1) | 5.5 | ||
| LDA 30 | 1.5 | ||
| B3LYP | 2.6 | ||
| GW 30 | 4.9 | ||
| LDA and eqn (1)30 | 5.0 | ||
| B3LYP and eqn (1)30 | 5.2 | ||
| GGA and eqn (1)27 | −7.8 | −2.6 | 5.2 |
In Table 1, energy gaps are defined as the difference between the LUMO and the HOMO levels. When analyzing the values of the gap given by Table 1, notice first that, even though the use of a minimal basis25 yields larger values for benzene, the LDA and GGA gaps are very similar, all falling around 5.0 eV for benzene and 1.6 eV for PTCDA. But notice too that these values are significantly below the ‘appropriate’ gap values, given in the last lines by experiment and the use of GW or eqn (1).
As seen above, LDA or GGA molecular gaps are very small compared with either experiments or with energy gaps calculated from total energy differences involving the molecule in charged configurations, as given by eqn (1). To overcome this limitation, we now discuss a simple scheme32,51 to calculate the electronic spectrum of an organic molecule from a DFT calculation for the neutral molecule, by approximating its total energy with either N + 1 or N− 1 electrons.32 We do so by considering the corresponding many-body contributions to the total energy in the charged state using the wavefunctions of the uncharged (N-electron) case; this is done by calculating the effect on the total energy of adding an electron to, or removing it from, a certain molecular orbital and neglecting the electron rearrangement that takes place upon charging (in analogy with Koopmans’ theorem in Hartree–Fock theory).
The addition or removal of an electron from a system is analyzed by looking at the contributions to the total energy from the one-electron, (intra- and inter-site) Hartree, and exchange–correlation (eqn (3) and (4)) contributions within the LCAO-OO method.
 | (7) |
| niα↑→niα↑ + δniα↑ |
| niα↓→niα↓ | (8) |
The total energy for this N + 1 electron case is obtained by approximating the Hartree and exchange–correlation energies by an expansion up to second order in δn, and substituting (8) in (7). The affinity level is then given by:
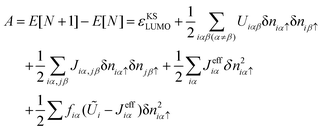 | (9) |
 | (10) |
In this approximation, the N-electron Kohn–Sham orbitals are used to describe the wavefunctions of the excitations. This implies that the variations in the orbital populations are simply given by the projection of the corresponding wavefunction on the basis orbitals ϕi; for the ionization and affinity energies, these are:
| δn′i↑ = −|〈ψi↑|HOMO〉|2 |
| δni↑ = |〈ψi↑|HOMO〉|2 | (11) |
By considering electrons or holes being added to different molecular levels, the above corrections to the DFT molecular levels can be extended not just for the ionization and affinity levels but for all molecular orbitals, Φ(a).
Eqn (9) and (10) (and similar equations for the other molecular levels) express the energies of the molecular levels as a bare Kohn–Sham eigenvalue, plus a correction which is evaluated using the corresponding N-electron wavefunction. These corrections yield the basic difference between the conventional DFT-levels and the appropriate molecular levels of the system. Importantly, while approximations are made in the exchange and correlation energies, the gap is obtained from total energies from N, N− 1 and N + 1 electrons. At variance with standard DFT, the calculation of the gap involves charged configurations of the molecule. Notice too that these corrections can be interpreted (see eqn (9) and (10)) as the self-interaction energy (with a ½-factor) associated with the molecular wavefunction charge distribution. Then, the appropriate transport energy gap for the isolated molecule is given as the (underestimated) Kohn–Sham gap plus the self-interaction corrections:
| Etmol = EKSmol + ESImol (isolated molecule) | (12) |
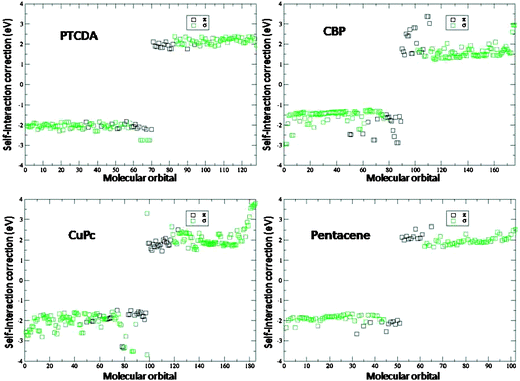 | ||
| Fig. 7 Value of the corrections, see eqn (9) and (10), to the DFT levels as a function of the molecular level. Black (green) squares correspond to states of π(σ) symmetry. Positive (negative) values correspond to occupied (empty) states. | ||
Secondly, large deviations in the magnitude of the corrections in general correspond to rather strongly localized orbitals, such as the four occupied σ orbitals of PTCDA, just below the HOMO, which are centered on the oxygen atoms. Another paradigmatic example is the Cu-localized orbital in the CuPc molecule, whose relative position with respect to the CuPc HOMO (of π symmetry) can be incorrectly predicted by DFT calculations.30 These large corrections given by eqn (9) and (10) counter the self-interaction errors that are present in the calculation of strongly-localized level positions,30,47 such as those mentioned above.
Also, notice how the OO-molecular level corrections provide a surprisingly good approximation to calculations involving the charged configurations (eqn (1)) or those obtained using the GW approximation. The latter includes the computationally very costly non-local correlation, and yields appropriate quasiparticle energies: this is approximated in our level corrections (eqn (9) and (10)), though in our case, no orbital relaxation due to charging is considered. These relaxation effects are not negligible, especially in smaller molecules like benzene, reducing the energy gap by 1.1 eV (benzene) and 0.5 eV (PTCDA). Further differences to the GW calculations are attributed to the use of a minimal basis.
3.2 Organic/metal interfaces. Image potential effects
Up to now, we have just considered the case of isolated organic molecules. We have seen that the gap is substantially underestimated by DFT and that the DFT molecular levels should be somehow corrected. When an organic molecule is near a metal surface, another, related, effect takes place due to the image potential created by the image charge (see Fig. 8): this is a correlation effect that opposes the self-interaction correction and tends to reduce the energy gap, making it more similar to the results of the DFT-calculations.30,53,54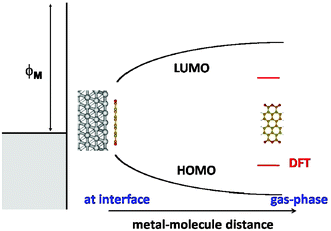 | ||
| Fig. 8 Scheme showing the evolution of the affinity and ionization levels as a function of the metal/molecule distance, due to the image potential. | ||
Classically, the affinity (ionization) level moves down (up) by a quantity, Vim, due to the image charge potential.55 This effect has been recently analyzed quantum mechanically by Louie and collaborators in two different systems.52,53 In the first one,52benzene on graphene (a semimetal), this group studied using GW methods the energy band spectrum of the molecule, with its plane parallel to the surface, as a function of the molecule/metal distance. From this detailed calculation, it can be seen that, for this particular system, the classical view applied to the benzene molecular levels works quite well. In particular, benzene is located 3.25 Å from the graphene-layer and e2/4d = 1.58 eV, so that the energy gap is reduced by 3.16 eV in good agreement with GW-calculations, which yield a reduction of around 2.9–3.0 eV). Notice again that the LDA gaps are very different from the GW values, both for the free molecule and on graphene (5.16 vs. 10.51 eV, and 5.05 vs. 7.35 eV, respectively).
In the second paper,53 this group analyzed C60 on Au(111). In these calculations, the LDA-energy gap for C60 in the gas phase is 1.6 eV; the self-interaction correction amounts to 3.2 eV and the gas-transport energy gap is 4.8 eV. At the equilibrium distance between C60 and Au (d = 2.5 Å), the classical image potential would reduce the gap by 1.45 eV. GW calculations show that, at that distance, this reduction is 2.3 eV, suggesting an extra reduction of the gap of 0.85 eV, which could be partially attributed to a reduction of the intra-molecular exchange-hole that becomes delocalized upon adsorption (this point will be discussed later on in section VI) or molecule polarization. Again the transport gap at the equilibrium distance 4.8–2.3 = 2.5 eV, which is 0.9 eV larger than the DFT value.
We now consider a series of organic molecules (PTCDA, PTCBI, CBP, pentacene, anthracene and benzene, see Fig. 9). Table 2 shows an estimation, using the classical image potential, of how image effects change the energy gap of these molecules when deposited parallel to the surface on Au(111), Ag(111) and Cu(111). While molecules can experience adsorption-induced deformations, we neglect these here for the purpose of our discussion. In this Table, the image plane has been taken from Smith et al.,56 and its distance to the molecule, has been taken from experimental evidence when available (the value for PTCDA57 is also used for PTCBI and CBP; that for pentacene,57 extrapolated to Ag and Au from the pentacene/Cu case and the differences in the PTCDA-metal distances is also used for benzene and anthracene). Image potential effects are compared in Table 2 with self-interaction corrections: in this Table, we also include the range of energy gaps afforded by LDA, GGA or GW, except for benzene where the experimental value is quoted. Self-interaction corrections are defined in Table 2 as the difference between the transport energy gaps and the DFT-energy gaps.
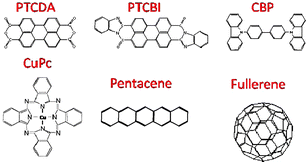 | ||
| Fig. 9 Some of the low-weight organic semiconductors that are discussed in this paper. | ||
For the isolated molecule, the corrections to the energy gap, eqn (9) and (10), are associated with the exchange-hole, and can be calculated using a Hartree–Fock (or hybrid) approximation (see section VI below for a discussion of this point). At interfaces, the intra-molecular exchange-hole is reduced since the metal–molecule interaction delocalizes the molecular states over the metal. This hole has been calculated for the benzene/Au(111) system as a function of the distance;58 these results suggest that the fraction of the hole localized on the molecule is reduced to around 65–85%: this makes ESI smaller by a factor γ, which typically is: γ = 0.65, 0.70 and 0.85 for Cu(111), Ag(111) and Au(111), respectively (for smaller metal/molecule distances, delocalization will increase and γ will decrease). This shows that, due to these surface effects, the molecular energy gap is reduced and eqn (12) should be replaced by:
| Et = EKS + γESI−Vim (interface) | (13) |
Table 3 shows how, across the molecules considered, γESI is clearly larger than Vim for Au, while both values are similar for Ag and Cu, thus cancelling each other out (see eqn (13)). These results suggest that conventional DFT might be appropriate for the Ag and Cu cases (since both corrections to the gap tend to cancel out), while for Au it would yield a too small energy gap. Corrections to the DFT-gap at the interface are between 0.8 eV for pentacene or PTCBI, and 1.3–1.6 eV for anthracene or benzene. This is also related to the molecule reactivity which is important for Ag or Cu, but small for Au;57,59 in the reactive cases, one expect Kohn–Sham DFT to be an appropriate approach for calculating the metal/molecule interaction.
We end up this section by comparing in Table 4 the experimental energy gaps obtained by Kahn’s and Umbach’s groups for different molecules on Au, with the theoretical estimations given above. It is remarkable that our theoretical values are within Kahn’s37 and Umbach’s60 results.
4. The IDIS-model
Simple but accurate models are useful in understanding the physics behind the calculations. For organic interfaces this is more necessary as, in the case of the least reactive interfaces, LDA or GGA calculations do not yield an accurate description of the metal/organic gap or, in the case of van der Waals forces, the interaction between them. The IDIS-model20–22 has been very successful in explaining the behaviour of those non-reactive interfaces and, in this section, we present in detail its most important properties.Within the IDIS model, the central quantity is the organic CNL, a kind of electronegativity marker which defines the direction and magnitude of charge transfer to other materials. This concept is closely related to Pauling’s electronegativity as shown in the next table taken from The Nature of the Chemical Bond.61
Table 5 illustrates with a few examples how Pauling’s atomic electronegativity is closely related to (I + A)/2,13 the average of the first ionization level and electron affinity, a quantity that should be a measure of the electron attraction by the neutral atom. In DFT, electronegativity is described as minus the average of the ionization and affinity levels, −(I + A)/2,62,63 a value that has been used to analyze molecular level alignment at organic interfaces.64 While using the midgap energy already provides a good description of charge transfer, we believe using the CNL position can provide more insight, since the CNL (which reflects the molecule at the interface) is not always near the midgap. Moreover, notice that the proper calculation of I and A implies the molecule in its charged configuration (eqn (1)), rather than the average of the (DFT) HOMO and LUMO energies. The difference between these quantities is related to the discontinuity in the derivative of the total energy with respect to the (continuous) number of electrons.63
While it can be intuitively understood how the donor or acceptor character of an organic molecule is directly related to its HOMO and LUMO positions, the organic CNL generalizes this concept to an organic material and takes into account not only its HOMO and LUMO levels but the whole energy spectrum of the system.20 At a MO interface, within the IDIS model electron charge should flow between the two materials depending on the sign of (ΦM− CNL), in such a way that a dipole, Δ, will be induced at the interface. The effect of this dipole is to screen (ΦM− CNL) to SMO(ΦM− CNL), where SMO is a screening parameter (0 < S < 1) that depends on the interface properties.20 The interface dipole is then given by: (1 −SMO)(ΦM− CNL). At an OO interface,22 the relevant energy is (CNL1–CNL2) and the screening parameter SOO can be approximated by ½(1/ε1 + 1/ε2), where ε1 and ε2 are the static dielectric constants of both media.65,66
4.1 MO interfaces
Let us now discuss how the CNL position of the organic material is calculated, by considering an organic molecule (such as, say, PTCDA or CuPc, see Fig. 9) adsorbed on an unreactive metal, say Au. In this case there is a weak chemical interaction between the noble metal (Au) and a closed-shell organic molecule separated a distance ≈3–3.5 Å, and as discussed above a conventional DFT calculation does not describe properly the electronic properties of this interface. Thus, in our analysis we start with a LDA-calculation of the isolated molecule and include in a first step many-body corrections to the molecular energy levels, as discussed in section III; then, these corrections are introduced using a scissor operator (see section VI) acting on the molecular Hamiltonian, shifting each LDA-eigenenergy by an amount which depends on the energy associated with adding an electron (empty states) or a hole (occupied states) to that particular molecular orbital.The CNL position is then calculated by introducing the interaction between the molecule and the metal using perturbation theory; in this calculation, the molecular energy levels (already shifted by the self-interaction correction as well as image charge effects) are broadened by their interaction with the metal, and an ‘induced density of interface states’ is created in the molecular energy gap (see Fig. 10). The organic CNL is calculated by integrating the density of states in the molecule up to its neutral number of electrons. It should be stressed that the CNL position should be calculated by using the LDA energy spectrum after these many-body corrections, as well as the reduction of the gap by image charge effects, have been introduced. In practice, this is equivalent to using the experimental transport gap (provided by Kahn’s data, see Table 4). In this way, we approximate the relevant contributions when a charge is added to the molecule at the interface, and reproduce the transport gap, a situation which a LDA calculation for a weakly-interacting interface would not describe satisfactorily.
| E t (interface) | PTCDA | CuPc | PTCBI | CBP | PEN |
|---|---|---|---|---|---|
| Kahn | 3.2 ± 0.4 | 2.3 ± 0.4 | 3.1 ± 0.4 | 4.6 ± 0.4 | 2.95 ± 0.4 |
| Umbach | 2.5 | 1.82 | — | — | — |
| This work | 2.4 ± 0.2 | 2.2 ± 0.2 | 2.2 ± 0.2 | 3.7 ± 0.2 | 2.1 ± 0.2 |
| I | A | (I + A)/2 | Electronegativity | |
|---|---|---|---|---|
| F | 17.4 | 3.6 | 10.5 | 4.0 |
| Cl | 13.0 | 3.8 | 8.4 | 3.0 |
| Br | 11.9 | 3.5 | 7.7 | 2.8 |
| H | 13.6 | 0.8 | 7.2 | 2.1 |
| Li | 5.4 | 0.0 | 2.7 | 1.0 |
| Na | 5.2 | 0.0 | 2.6 | 0.9 |
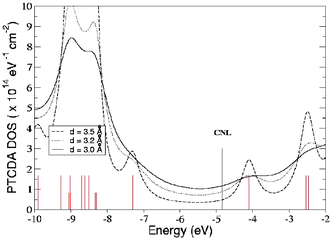 | ||
| Fig. 10 Density of states (DOS) for PTCDA at a Au(111)/PTCDA interface for different MO distances.20 The molecular energy levels (red vertical lines) are broadened by their interaction with the metal. The organic CNL (black line)is calculated by integrating the density of states in the molecule up to its neutral number of electrons. | ||
To gain some insight into the alignment, before discussing the unified IDIS model, we first consider an organic molecule on a metal, characterised respectively by CNL and ΦM. To try to equalise this initial potential difference, a dipole is induced across the interface, whose magnitude is calculated according to the IDIS theory as:
| ΔIDIS = (ϕM− CNL −ΔIDIS)4πe2D(EF)d/A | (14) |
| SMO = 1/(1 + 4πe2D(EF)d/A) | (15) |
| ΔIDIS = (1 −SMO)(ϕM− CNL) | (16) |
| (EF − CNL) = SMO(ϕM− CNL) | (17) |
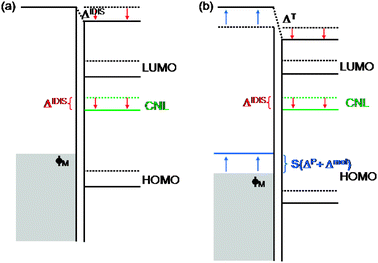 | ||
| Fig. 11 Energy level alignment for a MO interface: (a) original IDIS model; (b) unified IDIS model, including the effects of the Pauli (ΔP) and molecular (Δmol) dipoles at the interface, screened by the S parameter (see text). | ||
This analysis can be extended to include Pauli (exchange) effects and molecular permanent dipoles at the interface (see Fig. 11b). The Pauli repulsion can be described by the ‘pillow’ dipole, ΔP, which is associated with the compression of the metal electron tails at the interface.17–19 We calculate the charge rearrangement due to the orthogonalization of the organic and metal orbitals by expanding the organic–metal many-body interactions up to second order in the organic-metal overlap; this rearrangement corresponds to the ‘push-back’ effect experienced by the tail of the metal wave function and changes the value of ΦM, so that it effectively behaves as a dipole at the interface.19 This can be approximated as:
 | (18) |
![[d with combining right harpoon above (vector)]](https://www.rsc.org/images/entities/i_char_0064_20d1.gif) ii′ the vector joining atoms i and i′; Δ
ii′ the vector joining atoms i and i′; Δ![[r with combining right harpoon above (vector)]](https://www.rsc.org/images/entities/i_char_0072_20d1.gif) ′ a vector whose origin is the ii′-midpoint; and
′ a vector whose origin is the ii′-midpoint; and ![[u with combining right harpoon above (vector)]](https://www.rsc.org/images/entities/i_char_0075_20d1.gif) a unitary vector in the direction perpendicular to the surface.
a unitary vector in the direction perpendicular to the surface.
The effect of having molecules with a permanent dipolar moment, P0, with a non-zero component perpendicular to the interface can also be taken into account as a modification of the metal work-function; within the Topping model67 this effect is described by means of the dipole Δmol:
| Δmol = Δ0/(1 + α) | (19) |
A similar analysis as before (eqn (14)–(17)) yields:
| ΔTMO = SMO(ΔP + Δmol) + (1 −SMO)(ϕM− CNL) | (20) |
| EF− CNL = SMO(ΔP + Δmol) + SMO(ϕM− CNL) | (21) |
The magnitudes of the Pauli (‘pillow’) and molecular permanent dipoles are obtained from respective separate first-principles calculations: P0 is obtained from the isolated molecule and the Pauli-pillow dipole from eqn (18).
Notice also that the CNL position does not necessarily coincide with the Fermi level of the junction; instead, it is a useful energy marker measuring ‘organic electronegativity’ and indicating the magnitude and direction of charge transfer. The final (mis)alignment between the CNL and the Fermi level (or the other CNL) depends on their initial offset and on how efficiently potential differences are screened at the interface (S parameter). Only if S is very small (S≈ 0), EF≈ CNL. On the other hand, if S≈ 1 (no screening at all) ΔTMO = ΔP + Δmol, and the Fermi level is given by: EF = ϕM + (ΔP + Δmol).
Eqn (14)–(21) have been applied to several weakly-interacting interfaces;19–23Table 6 shows the results for junctions between Au and PTCDA, PTCBI, CBP and CuPc, and between Cu and a full monolayer of benzenethiolate (S-Bt) (see also Fig. 9). The Table details the different contributions (see eqn (20)) to the interface dipole, as well as a comparison with experiments of the total dipole.
| CNL | S(th.) | S(exp) | SΔP | (1 −S)(ΦM− CNL) | SΔmol | ΔT(th.) | ΔT(exp.) | |
|---|---|---|---|---|---|---|---|---|
| Au/PTCDA | −4.8 | 0.16 | ∼0 | 0.12 | 0.25 | — | 0.39 | ∼0.25 |
| Au/PTCBI | −4.4 | 0.16 | ∼0 | 0.17 | 0.50 | — | 0.67 | 0.4 |
| Au/CBP | −4.05 | 0.50 | ∼0.6 | 0.21 | 0.43 | — | 0.64 | 0.5 |
| Au/CuPc | −3.8 | 0.30 | ∼0.25 | 0.22 | 1.05 | — | 1.27 | ∼1.2 |
| Au/S-Bt | −3.75 | 0.28 | — | 0.11 | 0.26 | 0.63 | 1.00 | 1.00 |
The first four cases exhibit no molecular dipole in the direction perpendicular to the interface (PTCDA, for instance has polar C–O bonds, but the molecule is adsorbed on Au parallel to the surface68). For these cases, the IDIS (charge transfer) term is seen to yield the strongest contribution to the dipole. The Pauli-pillow term also represent an important contribution, but not as strong; this explains why our early analysis where the Pauli-pillow term was not included20 already resulted in a good agreement with experiment (in fact, it provides in some cases a better agreement than the combined IDIS-Pauli expression).
The Cu/S-Bt interface,23 on the other hand, illustrates a case where there is a strong molecular dipole. In agreement with previous studies,15,16,69 the effect of molecular dipoles is found to be important, contributing around 0.6 eV to a total dipole of 1.0 eV for a full monolayer (see also section VI). This description was also used to determine the Bt orientation on the surface as a function of coverage.23
4.2 OO-Interfaces
One of the advantages of the IDIS model is its description of MO and OO junctions within the same formalism. The analysis of molecular band offsets within DFT requires careful interpretation due to the large intermolecular distances and weak interaction.Within our formulation,22 the alignment at OO interfaces is determined by the tendency of the CNLs of both materials to align (as determined from their initial CNL offset), and follows eqn (23) with the simplification that some terms are now negligible: the Pauli (pillow) term, for instance, does not appear because of the similar size of the orbitals in both organic materials.
The screening parameter for organic heterojunctions, SOO, can in this case be calculated as:65,66
 | (22) |
| ΔTOO = SOOΔmol + (1 −SOO)(CNL1− CNL2) | (23) |
Organic heterojunctions show a weak interaction and the energy level alignment at these interfaces is characterised by exhibiting no interface dipole (vacuum level rule) in the majority of cases, while at the same time the large dipoles that have been measured at several interfaces constitute a few significant exceptions (see Fig. 6). The fact that the vacuum level rule is followed in most cases is consistent with the unreactive nature of the interface and the large bandgap of organic semiconductors. As for the exceptions, large (∼0.5 eV) dipoles have been measured,43 which are not easy to rationalise in terms of either the HOMO or LUMO relative positions, yet clearly appeal to the ‘donor’ or ‘acceptor’ character of the organic materials.
When applied to OO interfaces, our model yields good agreement with the observed interfacial dipoles:22 the direction of the dipole is always correctly predicted, and its magnitude is in good agreement with the experimental values (see Fig. 12), within 0.15 eV of the measured dipoles. SOO is around 0.5 in the cases presented in this Figure;66 this points in the direction of poor screening and is consistent with experimental observation of small or zero interface dipole (SOO = 1 would correspond to vacuum level alignment). Thus, the initial offset between the CNL positions is not efficiently screened once the junction is formed.
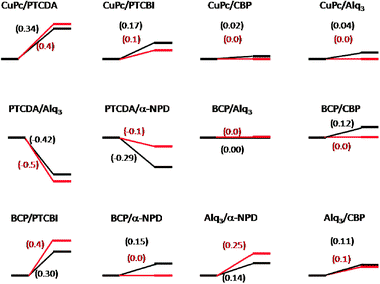 | ||
| Fig. 12 Molecular band offsets at several organic heterojunctions. The Figure gives the theoretical66 (black) and experimental22 (grey) values for the interface dipole. Notice that the vacuum alignment rule is followed in most cases, but large dipoles are observed at some interfaces. | ||
Thus, when considering molecular band offsets of low-weight organic molecules, we believe our approach in terms of the CNL to be very useful. The puzzling observation of vacuum level alignment at most heterojunctions, coexisting with large dipoles in a few interfaces can be easily understood within the CNL picture: only interfaces with very large initial CNL offsets (such as those involving PTCDA or PTCBI) will give rise to large dipoles at the interface. This allows for the understanding and prediction of molecular band offsets of organic semiconductors in a general and intuitive manner.
In addition to the theoretical calculation of the CNL as outlined above, the CNL position of several organic materials has recently been extracted from experimental results for several metal/organic interfaces.70,71 In the case of Molodtsova et al.,70 by analyzing a set of interfaces of CuPc and its fluorinated derivative, the authors used the IDIS eqn (20) and (23) (with Δmol = 0 in this case) to solve for the CNLs of both materials, the screening parameters and the ‘pillow’contribution. Also, Salomon et al.71 obtained the CNL position for THAP (tris2,5-bis3,5-bis-trifluoromethylphenylthieno-3,4-b,h,n−1,4,5,8,9,12-hexaazatriphenylene) from their analysis of the alignment at the Au/THAP interface.
The good agreement of the CNL values estimated in this manner with the calculated values suggests the usefulness of the IDIS model in understanding molecular level offsets at these weakly-interacting interfaces, which, as mentioned previously, may not be easily understood from standard DFT calculations.
5. The integer charge transfer model
We now discuss the integer charge transfer (ITC) model, which offers an alternative view of weakly-interacting interfaces24,72–75 involving luminescent polymers.The main characteristic of these materials is that they are very soft (with a very strong electron–phonon interaction), in such a way that creating an electron or a hole in the system (as corresponds to the molecule affinity or ionization levels) will induce a geometric relaxation leading to the formation of polaronic states. Examples of these polymers are PFO (poly(9,9-dioctylfluorene); P3HT (poly(3-hexylthiophene)); TFB (poly(dioctylfluorene-co-N-(4-butylphenyl)diphenylamine)); and P10AF (poly(9-(1′-decylundecylidene)fluorene)).76,77
The ICT model describes the energy level alignment as being governed by polaron states: when the substrate work function is within the polaronic levels (EP+ < ΦM < EP−), no charge is transferred and the vacuum level rule is observed. When, on the other hand, the work function reaches the energy of an organic polaronic state (ΦM > EP− or ΦM < EP+, complete charge transfer takes place and the Fermi level is completely pinned at this energy. The organic DOS corresponds to sharp peaks at the polaronic energies and zero between them (Fig. 13).
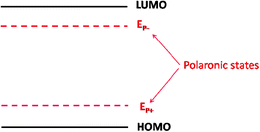 | ||
| Fig. 13 HOMO and LUMO levels, as well as the polaronic states EP− and EP+, of an electroluminescent polymer. | ||
Experimental data for interfaces of luminiscent polymers clearly follows the behaviour predicted by the ICT model (see Fig. 14).
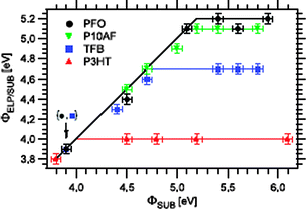 | ||
| Fig. 14 Dependence of work function of polymer coated substrate, ΦELP/SUB, on the work function of bare substrate, ΦSUB, for four materials studied, namely P3Ht, TFB, P10AF, and PFO. Reprinted, from ref. 24, with permission from IOP Publishing Limited. Copyright 2007. | ||
Fig. 14 shows, for different luminiscent materials, their work function (difference between their Fermi level and the vacuum level) as a function of the substrate (metal) workfunction.24 In all the cases these data show a linear behaviour, except when the substrate has a workfunction, ΦM, outside the interval (EP+,EP−). From this Figure, Salaneck and collaborators extracted the ionization energy (HOMO level), the polaronic level and the relaxation energy shown in Table 7.
| ELP | IP/±0.1 eV | Polaronicenergy/±0.1 eV | Relaxation energy/±0.1 eV |
|---|---|---|---|
| P3HT | 4.5 | 4.0 | 0.5 |
| TFB | 5.4 | 4.7 | 0.7 |
| P10AF | 5.5 | 5.1 | 0.4 |
| PFO | 5.8 | 5.2 | 0.6 |
An important point to notice is that these luminescent organic materials are assumed to form very weakly interacting interfaces “when surfaces and/or film depositions have been prepared in high-to-low vacuum and ambient atmosphere/glovebox conditions”,24 even weaker than the ones formed between Au and, say, CuPc or CBP.
We end up this section by commenting that, in our opinion, ICT is complementary to the IDIS-model. First, we note that, even in the absence of polarons, if the metal workfunction were outside the energy gap, the Fermi level would be pinned by either the HOMO or the LUMO levels. Then, the behaviour described by the ICT model would correspond to the case of very weakly interacting interfaces (S = 1) in the IDIS-case, with an effective transport gap defined by the levels EP+, EP−, instead of the usual HOMO or LUMO. As commented in ref. 78“when there is a significant overlap between the orbitals of the interacting [media], a partial charge transfer is always a consequence of their orbital mixing; …a full electron transfer becomes an option when the interaction between the two [media] is very weak.”
6. DFT-approach: hybrid potentials
6.1 DFT-approach and the “scissor”-Hamiltonian
DFT has been used in the literature to study MO interfaces, in many cases not addressing or even completely ignoring the organic energy gap problem. As discussed in section III this may present serious limitations for interfaces with Au, where image potential effects and self-interaction corrections for the transport energy gap do not cancel out. In this section, we discuss in detail C60, PTCDA and benzene on noble metals to illustrate how the “organic energy gap problem” may affect our understanding of the barrier height formation.Let us first consider the Au(111)/C60 interface: as discussed in section III, Louie and collaborators52 have shown how the organic transport energy gap depends on the M/O distance. At the equilibrium distance, 2.5 Å, this gap is 2.5 eV, significantly (0.9 eV) larger than the LDA-gap of 1.6 eV. Detailed LDA-calculations on this interface, using a ( )R30° surface unit cell, has been presented by Wang and Cheng;79 the most favourable adsortion site is a hcp position with a chemisorption energy of 1.27 eV per molecule (no van der Waals interaction is introduced in this calculation).
Our group has recalculated this interface,80 for the equilibrium distance of Wang and Cheng,79 using a local orbital basis LDA-approach, combined with a “scissors” operator that fits the LDA gap to the experimental value by rigidly shifting the empty and occupied parts of the spectrum by the same amount.81 In agreement with experimental and theoretical evidence,82,83 the metal workfunction is initially located 0.15 eV above the molecule midgap. Fig. 15 shows the molecule density of states (DOS) for an energy gap fitted to 2.5 eV; the molecule CNL, the metal workfunction, and the HOMO and LUMO levels as well as the Fermi energy level are also shown. The Fermi level is located 0.1 eV above the CNL and the total dipole, ΔT, is calculated to be 0.75 eV; moreover, in these calculations the bare “pillow” dipole is ΔP = 1.9 eV and S = 0.07 (yielding SΔP = 0.14 eV). For this small value of S, the Fermi level is practically aligned with the organic CNL (see eqn (26)), and the total dipole, ΔT, is close to (CNL −ΦM) (0.65 eV in these calculations). The experimental dipole has been found to be 0.6 eV.82
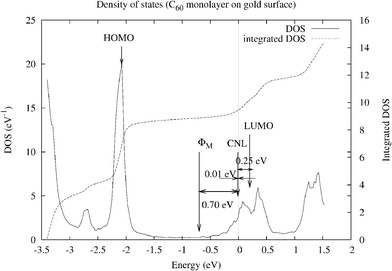 | ||
| Fig. 15 DOS and integrated DOS projected on the C60 molecule for the C60/Au(111) interface. EF is the origin of energy. The origin for the integrated DOS is arbitrary. The energy gap is fitted to 2.5 eV. The molecule CNL, the metal workfunction, and the HOMO and LUMO levels as well as the Fermi energy level are shown. The Fermi level is located 0.1 eV above the CNL and the total dipole, Δ, is calculated to be 0.75 eV. | ||
It is worth considering the same interface within the IDIS-model using the DFT-gap of 1.6 eV. A gap smaller by 0.9 eV, makes the LUMO lower by 0.45 eV and changes (LUMO − CNL) to 0.17 eV ((LUMO − CNL) scales roughly with the gap). Then, we find (CNL −ΦM) = 0.33 eV. This makes the total interface dipole smaller by around 0.3 eV than by using the appropriate gap of 2.5 eV; slight modifications in the value of S introduces no appreciable changes in this conclusion.
We now consider the Cu(111)/C60 interface. LDA-calculations by Wang and Chen83 yield a Cu/molecule equilibrium distance of 2.0 Å; this is 0.5 Å smaller than the Au/C60 distance and suggests, in view of the discussion presented in section III, that the Cu/C60 interface can be accurately analyzed using LDA. The experimental dipole for this interface is found to be 0.08 eV,82 much smaller than the one measured for Au(111)/C60. In terms of the IDIS-model, this can be understood from the smaller workfunction for Cu (4.95 eV instead of 5.25 eV of Au), and the smaller energy gap for C60 on Cu (1.6 eV instead of 2.5 eV on Au). In this case CNL −ΦM = 0.13 eV, which is 0.57 eV smaller than the Au case (from which 0.3 eVcome from the smaller ΦM, and 0.27 from the smaller energy gap). A similar argument for Ag(111)/C60 yields a value of −0.37 eV for CNL −ΦM (ΦM is above the CNL), indicating that the interface dipole in this case increases the metal workfunction.79
We now turn our attention to the metal/PTCDA interfaces. We first consider the Ag(111)/PTCDA case which has been theoretically analyzed by Picozzi et al.31 using a GGA-DFT approach; in these calculations the molecule was not allowed to relax and its distance to the surface was fixed to 2.8 Å, following the experimental evidence.84 In our discussion of section III we showed that, for this interface, the self-interaction corrections were practically cancelled out by image potential effects, and concluded that a GGA-DFT approach would yield an appropriate description of the gap. In ref. 31, the transport energy gap was calculated to be ≈1.6 eV at the interface of the Ag/PTCDA junction, and the interface Fermi level was found to be very close to the LUMO. These results can be understood by means of the IDIS model in the following way: consider first the discussion presented in section IV for PTCDA on Au; in this case, the gap at the interface is 3.2 eV,5 and the CNL was located 0.9 eV above the LUMO level (see Fig. 10). Extrapolating these results to the Ag-case, the CNL for PTCDA on Ag would be located 0.45 eV from the LUMO (the energy gap is 1.6 eV), and 5.35 eV from the vacuum level (this value is 4.8 eV for the Au/PTCDA interface, see Fig. 10). Since the Ag-workfunction is about 4.6 eV, we find (taking S≈ 0.10; in Au/PTCDA, S was found ≈0.17) EF− CNL = S(ΦM− CNL) = 0.08 eV; in addition, the “pillow” dipole has to be considered: for Au/PTCDA its value is 0.8 eV so that, assuming it to be around 1.5 eV for the Ag/PTCDA interface (due to the smaller metal–organic distance), we would get SΔP≈ 0.15eV (which we assume to have an uncertainty of ±0.1 eV). This suggests that the Fermi level is around 0.23 ± 0.1 eV above the CNL, namely, 0.22 eV from the LUMO level in good agreement with Picozzi et al.’s results.
Hauschild et al.85,86 have also analyzed the PTCDA/Ag(111) interface by means of a fully consistent GGA-DFT-calculations, where the full structure was allowed to relax. Their calculations yield a molecule–substrate distance of 3.38 Å, and a binding energy of 0.075 eV/molecule; this clearly indicates that still van der Waals forces should be included to obtain a reliable equilibrium distance (experimentally ≈2.85 Å57). It is interesting to comment that in these calculations a DFT-energy gap of 1.6 eV is expected, since no self-interactions or image potential effects were introduced. This DFT-calculation shows, however, an important chemical interaction between Ag and PTCDA, with the LUMO being partially filled (the LUMO-derived peak is 1.4 eV broad), contributing to the adsorption energy. This Ag–LUMO interaction introduces some distortion of the molecule but, in spite of all these effects, the Fermi level is still found to be close to the center of the LUMO level (0.6 electrons are transferred from the metal to the molecule) as in the undistorted molecule case; results that have been confirmed by the experimental evidence.60,84
For the sake of completeness, we also mention the work of Carr et al.,87 and Baratoff et al.88 for PTCDA or similar molecules. In these calculations, GGA-DFT has been used to analyze the reaction of PTCDA and Ti87 or the interaction of NTCDA (a molecule very similar to PTCDA) on Ag(110).88 In this last case, the authors interpreted the charge transfer (and the interface dipole) between the molecule and Ag in terms of the IDIS model (see also ref. 13).
Finally, we discuss some metal/benzene interfaces.89 Bagus and collaborators18,90 have analyzed the noble metal/benzene cases with an ab initio wave-function based method using self-consistent field theory with second order Møller–Plesset correction. The advantage of this method, compared with LDA or GGA calculations, is the inclusion of van der Waals forces that are mandatory to obtain an appropriate metal/molecule distance, and the possibility to relax the organic or metal basis wavefunctions independently. In particular, for the Au/benzene interface, this distance was found to be 3.8 Å, a value that might be thought to be a little too large when compared with other organic molecules.90 Another important quantity obtained from these calculations is the induced interface dipole, that amounts to 0.87 eV for Au(111)/benzene, in reasonable agreement with the experimental evidence of ≈1.1 eV.90
More importantly, Bagus et al.18,90 have argued that this induced dipole comes mainly from the interface “pillow” dipole. However, their sophisticated description of exchange effects at the interface, results in a very high computational cost, which limits the description of the metal substrate to a cluster, which might prevent the formation of the full screening process operating at the interface, as well as the full image potential, both of which reduce the organic energy gap. Using the IDIS-model language, this would be reflected in the value of the total induced dipole that can be written as:
| ΔT = ΔP + (1 −S)(CNL −ΦM−ΔP) | (24) |
Although benzene has been analyzed when deposited on Al28,29 using GGA, we do not know of equivalent calculations for benzene on Au, Ag or Cu. For Al/benzene, LDA yields28 a weak chemisorption energy of ≈0.35 eV, at a distance of ≈4.0 Å, indicating that van der Waals forces might be necessary to better understand this system. LDA-calculations for the Au(111)/benzene interface, using the scissors operator which fits the gap to its appropriate value, were performed by our group in ref. 81 taking a Au/benzene distance of ≈3 Å, following X-rays experiments for pentacene.57 In these calculations, an energy gap of 4.7 eV was taken (GGA), and an interface dipole of ≈2 eV was found; modifying that energy gap to 6.3 eV, as suggested in section III, do not substantially change the value of this large dipole, indicating that probably the Au/benzene distance is much larger than 3 Å, closer to 3.8 Å as suggested by Bagus and collaborators.90 More work in this system using DFT is necessary to fully understand the role played by the charge transfer and the pillow dipoles in the formation of the interface barrier.
6.2 Hybrid potentials
Since, as we have seen, conventional DFT cannot describe the energy gap of the molecule or at certain interfaces, other approaches have been explored. Hybrid potentials where LDA is combined with a HF-approximation are a fashionable approach (see ref. 91 for a general overview). The main problem with this approach is that, at M/O interfaces, it is not easy to have an appropriate hybrid potential for both the molecule and the metal.92 The advantage of using a local orbital basis as discussed above, is that one can more easily combine hybrid potentials which are valid for both materials.It is convenient to discuss at this point how one can introduce, in the LCAO-OO approach, a Hartree–Fock approximation.54 We start our discussion using eqn (3), (4) and (6). Eqn (6) defines the effective Hamiltonian for electrons with the exchange and correlation energies given by eqn (3) and (4).45 The exchange energy is a kind of “local” approximation for the exchange term:
 | (25) |
| Tiαβσ = −Uiαβσniβασ |
| Tiα,jβσ = −Jiα,jβσnjβ,iασ | (26) |
The advantage of using this approach is that one recovers a better description of the molecule transport energy gap. This is easily seen by considering eqn (3) and (9) and replacing the exchange contribution, ½∑iαJeffiαδniα↑2, by the following one −½∑iαβσUi,αβδniαβσδniβασ−½∑iαjβσJiα,jβσδniα,jβσδniσ,iα. This yields, in this approximation, the following affinity level:
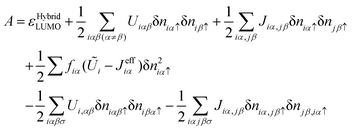 | (27) |
 | (28) |
 | (29) |
We should stress that we are assuming throughout that the system (molecule) does not relax when creating either an electron or a hole. Notice also that this HF-approximation eliminates (except for the correlation term) the self-interaction error introduced by DFT in the molecular levels because of the molecular exchange-hole introduced in this approach.
An extension of this approach consists in combining both the local and the non-local exchange energies. Then, the exchange energy looks like:
 | (30) |
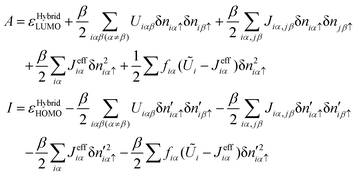 | (31) |
| A = εHybridLUMO |
| I = εHybridHOMO(β≠ 0) | (32) |
We end up this section by discussing the interface properties of a self-assembled monolayer of benzenethiolate (C6H5S–) adsorbed on the Cu(001) surface, using the hybrid-potential approach we have just discussed. Different self-assembled monolayers of a π-conjugated thiol have been analyzed, trying to tune the interface properties of the sulfur–Au bond by modifying the molecule ionization potential. In particular, Bredas, Zojer and collaborators have analyzed the molecules S(CH4)2X, with X = NH2, CN and SH;86–88 also, De Renzi et al.94 have considered the (CH3S)2 and the (CH3S) cases. These studies seem to show that the level alignment associated with the S–Au bond are insensitive to the self-assembled molecule deposited on the metal. We believe the results presented below for (C6H5S–) in the framework of the IDIS-model54 confirm these findings.
Fig. 16 shows the DOS on the sulfur and one of the C atoms of the (C6H5S–)-molecule. In these calculations the molecule has been assumed to be located in an upright position on the Cu(001)-surface forming a 2 × 3-structure,23 and use of a local basis LDA-approach, combined with the hybrid potential discussed above, has been made to analyze the interface charge transfer, the Fermi level and the interface dipole. In Fig. 16, we also show the initial metal workfunction, ΦM, the interface Fermi level, EF, the CNL and the free molecule energy levels before the contact is established (taking into account self-interaction correction).
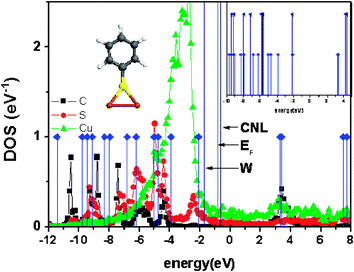 | ||
| Fig. 16 DOS in the C (black), S (red) and Cu (green) atoms shown in the inset, for the (C6H5S–) molecule adsorbed on Cu(100); the levels of the isolated molecule after including self-interaction and image potential corrections (blue) are also shown. In the right inset, these levels are compared with the ones calculated including only self-interaction corrections. In these calculations, a spin-restricted approximation has been used, so that the level located at −2.1 eV is half occupied. | ||
Notice the following: (a) the HOMO-level is mainly a sulfur-derived state, while the LUMO-level is C-like; this fact explains the LUMO-level dependence on the different chemical substituents of the molecule.51,54,95,96 (b) The interface Fermi level, EF, is about 1.1 eV above the HOMO, while the CNL is 0.15 eV above EF. (c) Our calculations also show that the interface has a low screening, with S≈ 0.5. In particular, it is found that: ΔP + ΔM = 0.85 eV, and CNL −ΦM) = 1.10 eV, so that ΔT = (1 −S)(CNL −ΦM) + S(ΔP + ΔM) = 0.95 eV, in good agreement with experimental evidence.23 The screened pillow and molecular dipole contributions as well as the IDIS-dipole are here very similar (SΔP≈ 0.42 eV and SΔM≈ 0.53 eV, respectively) to those obtained in ref. 23, (0.40 eV and 0.60 eV). (d) More importantly, these results show that the interface Fermi level and the organic CNL are critically determined by the sulfur-derived density of states, fixing the hole barrier. This is a clear evidence that for any thiol molecule adsorbed on the metal surface, the interface barrier is a very local property governed by the metal/sulfur bond; this fact explains the insensitivity of the barrier formation to the changes in the rest of the molecule.51,54,95,96
7. Final remarks and conclusions
In this review, we have presented a discussion of our actual theoretical understanding of the barrier height formation at organic interfaces, with particular emphasis on the metal/organic case. In this regard, we have commented that using DFT-theory to calculate MO and OO interfaces would be highly desirable; however, as discussed in detail in section III, those calculations are limited by the so called “energy gap problem for organic materials”. This is related to the fact that Kohn–Sham DFT levels do not provide the appropriate transport energy gap for those materials: in particular, in organic molecules, this energy gap is much larger than the one calculated in conventional DFT (LDA or GGA), and we have discussed in section III this discrepancy in terms of the self-energy interaction associated with the corresponding level.Organic molecules deposited on metals present a case where image potential effects partially compensate this self-interaction correction; in particular, we have analyzed different molecules on noble metals and have found that, for Cu (and probably Ag), image potential effects are so strong that we can rely on conventional DFT to calculate MO interfaces; however, Au presents the other limit where still self-interaction corrections are large enough to make conventional DFT inaccurate. This is very interesting from the point of view of the physics of DFT and many-body theory, because the organic/noble metal interface offers a benchmark for studying how one can move from a limit where the electron screening is so high that Kohn–Sham LDA levels are a good approximation to the energy levels of the system, to the case where one has to go beyond conventional DFT.91
In section VI, we have discussed some alternatives to deal with the energy gap problem for organic interfaces (using either a scissors operator or a hybrid potential) without having to pay the prize of using accurate but very demanding computational methods such as GW. This is the most reliable approach we nowadays have to solve the “energy gap problem for organic materials”,52,53 but its broad use is limited by its high computational cost; this suggests that the use of hybrid potentials91 is probably the best way of having a simple but accurate approach to analyze systematically MO and OO interfaces. The problem here is that these hybrid potential approaches are not easy to use for both the metal and the organic material in a plane-wave formalism;90 however, our discussion in section VI shows an alternative for solving this difficulty using a local orbital basis.
On the other hand, simple models are convenient for understanding the physics behind the calculations. For organic interfaces this is more necessary because of the problems with conventional DFT-methods. In sections IV and V we have presented two approaches, the unified IDIS-model and the ICT-model, which have been found to offer a qualitative and semiquantitative description of the barriers at organic interfaces. We have argued that the ICT-model can be considered as a limiting case of the IDIS-approach, corresponding to very weak interaction between the metal and the organic material.
Regarding the unified IDIS-model (section IV) we have shown that an organic material is characterized by its CNL; this is a kind of electronegativity level which defines the magnitude and direction of charge transfer to (or from) other materials. The other quantity defining the amount of charge transferred at the interface is the screening parameter, either SMO or SOO; then the IDIS-dipole is given by (1 −SMO)(CNL −ΦM) or (1 −SOO)(CNL1− CNL2). In the unified IDIS-model the “pillow”, ΔP, and the molecular, ΔM, dipoles are introduced in such a way that the total dipole for a MO-interface is (1 −SMO)(CNL −ΦM) + SMO(ΔP + ΔM); at an OO-interface ΔP is negligible and the total dipole is reduces to (1 −SOO(CNL1–CNL2) + SOOΔM. We have shown that this approach is in good agreement with the experimental evidence and with some DFT-calculations presented in section VI. In particular, LDA or GGA-calculations for C60/Cu(111), PTCDA/Ag(111) and benzenethiol/Cu(001) can be well-understood within the unified IDIS-model.
We conclude that, although the IDIS and the ICT-models provide satisfactory approaches for understanding qualitatively and semiquantitatively the physics behind the barrier formation at organic interfaces, the main problem in this area is the development of new DFT-methods (beyond LDA or GGA) which afford the possibility of performing reliable calculations for all organic interfaces, without the computational demands of GW. In order to reach this goal, an extra difficulty not discussed in this paper should be addressed: the incorporation of van der Waals forces in those calculations to determine accurately the most favourable organic interface geometries.
Acknowledgements
This work has been supported by the Spanish MEyC under contracts NAN-2004-09183-C-10-07 and MAT2007-60966, the CAM under contract 0505/MAT/0303, and the Danish Research Council under project FTP 65212.References
-
Conjugated Polymer and Molecular Interfaces, ed. W. R. Salaneck, K. Seki, A. Kahn and J. J. Pireaux, Marcel Dekker, New York, 2001 Search PubMed
.
-
W. R. Salaneck, S. Stafström and J. L. Brèdas, Conjugated Polymer Surgaces and Interfaces: Electronic and Chemical Structure of Interfaces for Polymer Light Emitting Diodes, Cambridge University Press, Cambridge, 1996 Search PubMed
.
- N. Koch, ChemPhysChem, 2007, 8, 1438 CrossRef CAS
.
- J. C. Scott, J. Vac. Sci. Technol., A, 2003, 21, 521 CrossRef CAS
.
-
H. Ishii and K. Seki, in Conjugated Polymer and Molecular Interfaces, ed. W. R. Salaneck, K. Seki, A. Kahn and J. J. Pireaux, Marcel Dekker, New York, 2001, pp. 293–350 Search PubMed
.
-
C. Shen, A. Kahn and L. G. Hill, in Conjugated Polymer and Molecular Interfaces, ed. W. R. Salaneck, K. Seki, A. Kahn and J. J. Pireaux, Marcel Dekker, New York, 2001, pp. 351–400 Search PubMed
.
- D. Cahen, A. Kahn and E. Umbach, Mater. Today, 2005, 8, 32 CrossRef
.
- H. Ishii, K. Sugiyama, E. Ito and K. Seku, Adv. Mater., 1999, 11, 605 CrossRef CAS
.
- S. Narioka, H. Ishii, D. Yoshimura, M. Sei, Y. Ouchi, K. Seki, S. Hasegawa, T. Miyazaki, Y. Harima and K. Yamashita, Appl. Phys. Lett., 1995, 67, 1899 CrossRef
.
- I. G. Hill, A. Rajagopal, A. Kahn and Y. Hu, Appl. Phys. Lett., 1998, 73, 662 CrossRef CAS
.
- I. G. Hill, J. Schwartz and A. Kahn, Org. Electron., 2000, 1, 5 CrossRef CAS
.
- C. Shen and A. Kahn, Org. Electron., 2001, 2, 89 CrossRef CAS
.
- X. Crispin, V. Geskin, A. Crispin, J. Cornil, R. Lazzaroni, W. R. Salaneck and J. L. Brèdas, J. Am. Chem. Soc., 2002, 124, 8131 CrossRef CAS
.
- M. Eremtchenko, D. Bauer, J. A. Shaefer and F. S. Tautz, New J. Phys., 2004, 6, 4 CrossRef
.
- S. Kera, Y. Yabuuchi, H. Yamane, H. Setoyama, K. K. Okufaira, A. Kahn and N. Ueno, Phys. Rev. B: Condens. Matter Mater. Phys., 2004, 70, 085304 CrossRef
.
- M. Knupfer and G. Paasch, J. Vac. Sci. Technol., A, 2005, 23, 1072 CrossRef CAS
.
- P. S. Bagus, V. Staemmler and C. Wöll, Phys. Rev. Lett., 2002, 89, 096104 CrossRef
.
- G. Witte, S. Lukas, P. S. Bagus and C. Wöll, Appl. Phys. Lett., 2005, 87, 263502 CrossRef
.
- H. Vázquez, Y. J. Dappe, J. Ortega and F. Flores, J. Chem. Phys., 2007, 126, 144703 CrossRef CAS
.
- H. Vázquez, R. Oszwaldowski, P. Pou, J. Ortega, R. Pérez, F. Flores and A. Kahn, Europhys. Lett., 2004, 65, 802 CrossRef CAS
.
- H. Vázquez, F. Flores, R. Oszwaldowski, J. Ortega, R. Pérez and A. Kahn, Appl. Surf. Sci., 2004, 234, 107 CrossRef CAS
.
- H. Vázquez, W. Gao, F. Flores and A. Kahn, Phys. Rev. B: Condens. Matter Mater. Phys., 2005, 71, 041306 CrossRef
; H. Vazquez, F. Flores and A. Kahn, Org. Electron., 2007, 8, 241 CrossRef CAS
.
- M. G. Betti, A. Kanjilal, C. Mariani, H. Vazquez, Y. J. Dappe, J. Ortega and F. Flores, Phys. Rev. Lett., 2008, 100, 027601 CrossRef CAS
.
- M. Fahlman, A. Crispin, X. Crispin, S. K. M. Henze, M. P. de Jong, W. Osikowicz, C. Tengstedt and W. R. Salaneck, J. Phys.: Condens. Matter, 2007, 19, 183202 CrossRef
.
-
H. Vázquez, Energy level alignmennt at organic semiconductor interfaces, PhD Thesis, Universidad Autónoma de Madrid, Spain, 2006 Search PubMed
.
-
Handbook of Chemistry and Physics, ed. D. R. Lide, Chemical Rubber Company Press, Boca Raton, FL, 1998 Search PubMed
.
- M. Andrzejak, J. Mol. Struct. (THEOCHEM), 2000, 527, 91 CrossRef CAS
.
- R. Duschek, F. Mittendorfer, R. I. R. Blyth, F. P. Netzer, J. Hafner and M. G. Ramsey, Chem. Phys. Lett., 2000, 318, 43 CrossRef CAS
.
- Y. Nakano, S. Susumu, I. Hamada and Y. Morikawa, Surf. Interface Anal., 2008, 40, 1059 CrossRef CAS
.
- N. Dori, M. Menon, L. Kilian, M. Sokolowski, L. Kronik and E. Umbach, Phys. Rev. B: Condens. Matter Mater. Phys., 2006, 73, 195208 CrossRef
.
- S. Picozzi, A. Pecchia, M. Gheorghe, A. di Carlo, P. Lugli, B. Dellay and M. Elstner, Phys. Rev. B: Condens. Matter Mater. Phys., 2003, 68, 195309 CrossRef
.
- R. Oszwaldowski, H. Vazquez, P. Pou, J. Ortega, R. Perez and F. Flores, J. Phys.: Condens. Matter, 2003, 15, S2665 CrossRef CAS
.
- H. Vázquez, P. Jelínek, M. Brandbyge, A. P. Jauho and F. Flores, Appl. Phys. A, 2009, 95, 257 CrossRef CAS
.
- I. G. Hill, A. Kahn, Z. G. Soos and R. A. Pascual, Jr, Chem. Phys. Lett., 2000, 327, 181 CrossRef CAS
.
- T. Schwieger, H. Peisert, M. S. Golden, M. Knupfer and J. Fink, Phys. Rev. B: Condens. Matter Mater. Phys., 2002, 66, 155207 CrossRef
.
- D. R. T. Zahn, G. N. Gavilla and M. Gorgoi, Chem. Phys., 2006, 325, 99 CrossRef CAS
.
- C. Shen, A. Kahn and I. Hill, in ref. 1, p. 351.
- I. G. Hill, J. Schwartz and A. Kahn, Org. Electron., 2000, 1, 5 CrossRef CAS
.
- C. I. Wu, Y. Hirose, H. Sirringhause and A. Kahn, Chem. Phys. Lett., 1997, 272, 43 CrossRef CAS
.
- I. G. Hill, A. Kahn, J. Cornill, D. A. dos Santos and J. L. Bredas, Chem. Phys. Lett., 2000, 317, 444 CrossRef CAS
.
- I. G. Hill, A. Kahn, Z. G. Soos and R. A. Pascal, Jr, Chem. Phys. Lett., 2000, 327, 181 CrossRef CAS
.
-
W. Gao, Electrical doping of organic molecular semiconductors, PhD Thesis, Princeton University, NJ, 2004 Search PubMed
.
- I. G. Hill, D. Milliron, J. Schwartz and A. Kahn, Appl. Surf. Sci., 2000, 166, 354 CrossRef CAS
.
- Y. J. Dappe, R. Oszwaldowski, P. Pou, J. Ortega, R. Perez and F. Flores, Phys. Rev. B: Condens. Matter Mater. Phys., 2006, 73, 235124 CrossRef
.
- P. Pou, R. Perez, F. Flores, A. Levy Yeyati, A. Martin-Rodero, J. M. Blanco, F. J. Garcia-Vidal and J. Ortega, Phys. Rev. B: Condens. Matter Mater. Phys., 2000, 62, 4309 CrossRef CAS
.
- F. J. Garcia-Vidal, A. Martin-Rodero, F. Flores, J. Ortega and R. Perez, Phys. Rev. B: Condens. Matter Mater. Phys., 1991, 44, 11412 CrossRef CAS
.
- N. Marom, O. Hod, G. E. Scuseria and L. Kronik, J. Chem. Phys., 2008, 128, 164107 CrossRef
.
- O. F. Sankey and D. J. Niklewski, Phys. Rev. B: Condens. Matter Mater. Phys., 1989, 40, 3979 CrossRef
.
- A. A. Demkov, J. Ortega, O. F. Sankey and M. P. Grumbach, Phys. Rev. B: Condens. Matter Mater. Phys., 1995, 52, 1618 CrossRef CAS
; P. Jelinek, Hao Wang, J. P. Lewis, O. F. Sankey and J. Ortega, Phys. Rev. B: Condens. Matter Mater. Phys., 2005, 71, 235101 CrossRef
.
- J. P. Lewis, K. R. Glaesemann, G. A. Voth, J. Fritsch, A. A. Demkov, J. Ortega and O. F. Sankey, Phys. Rev. B: Condens. Matter Mater. Phys., 2001, 64, 195103 CrossRef
.
- G. Heimel, L. Romaner, J. L. Bredas and E. Zojer, Surf. Sci., 2006, 600, 4548 CrossRef CAS
.
- J. D. Sau, J. B. Neaton, H. J. Choi, S. G. Louie and M. L. Cohen, Phys. Rev. Lett., 2008, 101, 026804 CrossRef
.
- J. B. Neaton, M. S. Hybertsen and S. G. Louie, Phys. Rev. Lett., 2006, 97, 216405 CrossRef CAS
.
- E. Abad, C. Gonzalez, J. Ortega and F. Flores, to be published.
- E. V. Tsiper, Z. G. Zoos, W. Gao and A. Kahn, Chem. Phys. Lett., 2002, 360, 47 CrossRef CAS
.
- N. V. Smith, C. T. Chen and M. Weinert, Phys. Rev. B: Condens. Matter Mater. Phys., 1989, 40, 7565 CrossRef CAS
.
- N. Koch, J. Am. Chem. Soc., 2008, 130, 7300 CrossRef CAS
.
- E. Abad, J. Ortega and F. Flores, in press.
- Y. Zou, L. Kilian, A. Scholl, T. Schmidt, R. Fink and E. Umbach, Surf. Sci., 2006, 600, 1240 CrossRef CAS
.
- S. Krause, M. B. Casu, A. Scoll and E. Umbach, New J. Phys., 2008, 10, 085001 CrossRef
.
-
L. Pauling, The Nature of the Chemical Bond, Cornell University Press, Ithaca, NY, 3rd edn, 1960 Search PubMed
.
-
R. Parr and W. Yang, Density Functional Theory of Atoms and Molecules, Oxford University Press, 1989 Search PubMed
.
- J. P. Perdew, R. G. Parr, M. Levy and J. L. Balduz, Phys. Rev. Lett., 1982, 49, 1691 CrossRef CAS
.
- See, for example, X. Crispin, V. Geskin, A. Crispin, J. Cornil, R. Lazzaroni, W. R. Salaneck and J. L. Brédas, J. Am. Chem. Soc., 2002, 124, 8131 Search PubMed
.
- J. Tersoff, Phys. Rev. B: Condens. Matter Mater. Phys., 1985, 32, 6968 CrossRef CAS
.
- H. Vázquez, F. Flores and A. Kahn, Org. Electron., 2007, 8, 241 CrossRef CAS
.
- J. Topping, Proc. R. Soc. London, Ser. A, 1927, 114, 67 CrossRef
.
- P. Fenter, F. Schreiber, L. Zhou, P. Eisenberger and S. R. Forrest, Phys. Rev. B: Condens. Matter Mater. Phys., 1997, 56, 3046 CrossRef CAS
.
- S. Yanagisawa and Y. Morikawa, Chem. Phys. Lett., 2006, 420, 523 CrossRef CAS
.
- O. V. Molodtsova, M. Grobosch, M. Knupfer and V. Yu. Aristov, Appl. Phys. Lett., 2007, 91, 244103 CrossRef
.
- Eric Salomon, Qing Zhang, Stephen Barlob, Seth R. Marder and Antoine Kahn, Org. Electron., 2008, 9, 944 CrossRef CAS
.
- P. S. Davids, A. Saxena and D. L. Smith, J. Appl. Phys., 1995, 78, 4244 CrossRef CAS
.
- P. S. Davids, A. Saxena and D. L. Smith, Phys. Rev. B: Condens. Matter Mater. Phys., 1996, 53, 4823 CrossRef CAS
.
- I. H. Campbell, T. W. Hagler, D. L. Smith and J. P. Ferraris, Phys. Rev. Lett., 1996, 76, 1900 CrossRef CAS
.
- C. Tengstedt, W. Osikowicz, W. R. Salaneck, I. D. Parker, C.-H. Hsu and M. Fahlman, Appl. Phys. Lett., 2006, 88, 053502 CrossRef
.
- G. Greczynski, M. Fahlman and W. R. Salanek, Chem. Phys. Lett., 2000, 321, 379 CrossRef CAS
.
- W. Osikowicz, M. P. de Jong, S. Braun, C. Tengstedt, M. Fahlman and W. R. Salaneck, Appl. Phys. Lett., 2006, 88, 193504 CrossRef
.
- I. Avilov, V. Geskin and J. Cornil, Adv. Funct. Mater., 2008, 18, 1
.
- L. L. Wang and H.-P. Cheng, Phys. Rev. B: Condens. Matter Mater. Phys., 2004, 69, 165417 CrossRef
.
- E. Abad, J. Ortega and F. Flores, J. Vac. Technol. Search PubMed
, submitted.
- E. Abad, J. Ortega, Y. J. Dappe and F. Flores, Appl. Phys. A: Mater. Sci. Process., 2009, 95, 119 CrossRef CAS
.
- C. T. Tzeng, W. S. Lo, J. Y. Yuh, R. Y. Chu and K. D. Tsuei, Phys. Rev. B: Condens. Matter Mater. Phys., 2000, 61, 2263 CrossRef CAS
.
- L. L. Wang and H.-P. Cheng, Phys. Rev. B: Condens. Matter Mater. Phys., 2004, 69, 045404 CrossRef
.
- N. Koch, J. Phys.: Condens. Matter, 2008, 20, 184008 CrossRef
.
- A. Hauschild, K. Karki, B. C. C. Corie, M. Rohlfing, F. S. Tautz and M. Sokolowski, Phys. Rev. Lett., 2005, 94, 036106 CrossRef CAS
.
- A. Hauschild, K. Karki, B. C. C. Corie, M. Rohlfing, F. S. Tautz and M. Sokolowski, Phys. Rev. Lett., 2005, 95, 209602 CrossRef
.
- A. Palma, A. Pasquarello and R. Carr, Phys. Rev. B: Condens. Matter Mater. Phys., 2002, 65, 155314 CrossRef
.
- A. A. Alkauskas, A. Baratoff and C. Bruder, Phys. Rev. B: Condens. Matter Mater. Phys., 2006, 73, 165408 CrossRef
.
- P. Han, B. A. Mantooth, E. C. H. Sykes, Z. J. Donhauser and P. S. Weiss, J. Am. Chem. Soc., 2004, 126, 10787 CrossRef CAS
.
- P. S. Bagus, K. Hermann and C. Woll, J. Chem. Phys., 2005, 123, 184109 CrossRef
.
- S. Kummel and L. Kronik, Rev. Mod. Phys., 2007, 79 Search PubMed
.
- J. Paier, M. Marsma and G. Kresse, J. Chem. Phys., 2007, 127, 024103 CrossRef
.
- Similar results have been obtained by K. S. Thygesen and A. Rubio, Phys. Rev. Lett., 2009, 102, 46802 Search PubMed
, using a GW-approach.
- V. De Renzi, R. Rousseau, D. Marchetto, R. Biaggi, S. Scandolo and U. Del Pennino, Phys. Rev. Lett., 2005, 95, 046804 CrossRef CAS
.
- G. Heimel, L. Romaner, J. L. Bredas and E. Zojer, Phys. Rev. Lett., 2006, 96, 196806 CrossRef
.
- G. Rangger, L. Romaner, G. Heimel and E. Zojer, Surf. Interface Anal., 2008, 40, 371 CrossRef CAS
.
- W. Gao and A. Kahn, Org. Electron., 2002, 3, 53 CrossRef CAS
.
- A. Kahn, N. Koch and W. Gao, J. Polym. Sci., Part B: Polym. Phys., 2003, 41, 2529 CrossRef CAS
.
| This journal is © the Owner Societies 2009 |
