Fluorescent method for platinum detection in buffers and serums for cancer medicine and occupational hazards†
Amanda L.
Garner
and
Kazunori
Koide
*
Department of Chemistry, University of Pittsburgh, 219 Parkman Avenue, Pittsburgh, Pennsylvania 15260, USA. E-mail: koide@pitt.edu; Fax: +1 412-624-8611; Tel: +1 412-624-8767
First published on 17th November 2008
Abstract
Herein we demonstrate fluorescence detection of total platinum species in buffers and serums by a Pt0-catalyzed Tsuji–Trost type reaction to yield a fluorescent compound.
Platinum is a widely used precious metal in various materials including commercial drinking water, anticancer drugs, artificial tissues, dental crowns, catalytic converters, fuel cells, and jewelry. For example, platinum-containing drinking water and skin-care products are sold for their potential benefits to human health.1Cisplatin and its analogues are widely used as anticancer drugs, and additional platinum-based compounds are emerging.2 Despite the medical benefits of platinum compounds, other forms of platinum are considered potential health hazards. Platinum intake occurs frequently because significant amounts of the metal are emitted from automobiles (∼0.8 μg km−1 per car),3a and such pollution products may account for the metal’s presence in human bodies.3b,c Moreover, although controversial,4a–cplatinum residue in silicone-based artificial tissues may leach into blood.4dPlatinum is also an important catalytic component in fuel cells, and monitoring dissolved platinum species from Pt/C electrocatalysts is an important aspect of fuel cell studies.5
Currently the concentrations of platinum in aqueous media including human samples (e.g., blood) are determined primarily by inductively coupled plasma mass spectrometry (ICP-MS).6a,b This method requires a large and expensive instrument and highly skilled individuals to operate it. ICP-MS operations also require great caution because the instrument can be contaminated by previous samples.6c The linear nature of the ICP-MS analysis does not allow for high throughput analysis. A fluorescent method would be more desirable because the measurement requires a far less expensive bench-top or hand-held fluorometer that hospitals, academic laboratories, and platinum product manufacturers can afford. Moreover, fluorescent methods do not suffer from cross-contamination because disposable cuvettes and multi-well plates are readily available (∼10 cents per cuvette; 340–800 nm), also facilitating high throughput analysis. Therefore, if a fluorescent method can be developed to monitor platinum quantities, such a method might change the paradigm of platinum analysis.
We previously reported a fluorescent method for palladium7 based on the Tsuji–Trost allylic oxidative insertion mechanism (Fig. 1).8 In this fluorometric detection system, the starting stable metal species, MII/IV (in our previous work, PdII; in this paper, PtII and PtIV) is reduced by phosphine to form M0L4. Since this species is an 18-electron species, it needs to first dissociate from the ligand to form M0L4−n to make the d-orbitals available for the next reaction. This metal species then undergoes an oxidative insertion into the allylic ether bond of compound 1 to form π-complex 3, which is then attacked by a nucleophile to regenerate M0 species and the fluorescent compound 2. Thus, this pathway consists of four steps (reduction, ligand dissociation, oxidative insertion, and nucleophilic attack). In our palladium method, the third step appeared to be the rate-determining step, resulting in a correlation between the fluorescence intensity of the reaction solution and the palladium concentration. However, it would be premature to expect a similar correlation between the fluorescence signal and platinum concentrations because these metals are different with respect to the rate of ligand substitution and affinity for phosphine (size difference), and as such should have different reactivities.9a,b Additionally, there is no precedence for a general platinum-catalyzed Tsuji–Trost reaction.9c Thus, these questions warranted independent and rigorous studies on the Pt-catalyzed Tsuji–Trost reaction.
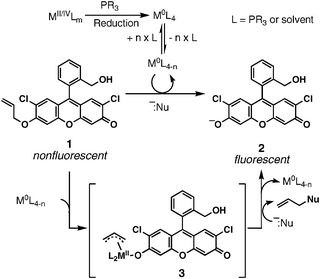 | ||
| Fig. 1 Catalytic mechanism of Pd and Pt detection by fluorescence. | ||
To investigate the Pt-catalyzed deallylation reaction, we first wished to determine the oxidation state of platinum necessary for the allyl ether cleavage. Toward this end, 1 was subjected to Pt(PPh3)4 and PtCl2 (0.5 mol% for each reaction) in the presence of morpholine (1.1 equiv.) at 24 °C in THF. After 10 min, the reaction with Pt(PPh3)4 was complete (i.e., turnover frequency (TOF) >1200 h−1), while that with PtCl2 did not proceed, showing that the conversion of 1 to 2 can be catalyzed by Pt0 but not by PtII. The reaction with PtCl2 was driven to completion by the addition of a reducing agent such as Ph3P or NaBH4, indicating that this method can be applied to detecting total platinum upon in situreduction.
In order to develop a fluorescent method for platinum, we performed the conversion of 1 to 2 in aqueous media in the presence of PtCl2 (625 nM; 125 ppb) and Ph3P. We screened buffers in the pH 4–10 range, which is the optimal pH range for 210 and found that the Pt-catalyzed deallylation was most effective using pH 7–9 buffers (Fig. 2a). As Fig. 2b shows, regardless of the initial oxidation states of platinum (0, +2, and +4) we were able to obtain nearly the same results.
![Fluorescence analysis of Pt. In these graphs, the y-axis is fluorescence intensity (a.u. × 105) at 525 nm. For example, “5” means 5 × 10⁵. In all cases, [ 1] = 12.5 μM and [PPh3] = 250 μM, and the assays were performed for 1 h at 24 °C. (a) The pH-dependent deallylation of 1 in the presence of PtCl2 (625 nM) in 1 : 4 DMSO–buffer. (b) Fluorescence induction by Pt at various oxidation states and in Pt drink in 1 : 4 DMSO–pH 7 buffer. In Pt(PPh3)4, PtCl2, H2PtCl6, and cisplatin solutions, [Pt] = 625 nM. In platinum nanocolloid sample, [Pt] = 750 nM. (c) Initial rate analysis for deallylation of 1 in the presence of PtCl2 (117 μM) and Ph3P in 1 : 1 DMSO–buffer. ◆ = pH 4; y = −0.00570x + 1.18; R2 = 0.00950. ■ = pH 7; y = 2.80x + 2.00; R2 = 1.00. ▲ = pH 10; y = 0.926x + 6.34; R2 = 0.971. (d) Phosphine ligand screening with PtCl2 (625 nM). A = no Pt, B = bis(2-diphenylphosphinophenyl)ether, C = 2-(di-tert-butylphosphino)biphenyl, D = tri-o-tolylphosphine, E = tri-2-furylphosphine, F = Ph3P. (e) Correlation between fluorescence intensity and [PtCl2] in 1 : 4 DMSO–pH 7 buffer after 24 h. ◆ = 24 °C; y = 0.00140x + 0.0255; R2 = 0.999. The intensity continued to be linear to 625 nM (125 ppb). ■ = 37 °C.](/image/article/2009/CC/b817220j/b817220j-f2.gif) | ||
| Fig. 2 Fluorescence analysis of Pt. In these graphs, the y-axis is fluorescence intensity (a.u. × 105) at 525 nm. For example, “5” means 5 × 10⁵. In all cases, [ 1] = 12.5 μM and [PPh3] = 250 μM, and the assays were performed for 1 h at 24 °C. (a) The pH-dependent deallylation of 1 in the presence of PtCl2 (625 nM) in 1 : 4 DMSO–buffer. (b) Fluorescence induction by Pt at various oxidation states and in Pt drink in 1 : 4 DMSO–pH 7 buffer. In Pt(PPh3)4, PtCl2, H2PtCl6, and cisplatin solutions, [Pt] = 625 nM. In platinum nanocolloid sample, [Pt] = 750 nM. (c) Initial rate analysis for deallylation of 1 in the presence of PtCl2 (117 μM) and Ph3P in 1 : 1 DMSO–buffer. ◆ = pH 4; y = −0.00570x + 1.18; R2 = 0.00950. ■ = pH 7; y = 2.80x + 2.00; R2 = 1.00. ▲ = pH 10; y = 0.926x + 6.34; R2 = 0.971. (d) Phosphine ligand screening with PtCl2 (625 nM). A = no Pt, B = bis(2-diphenylphosphinophenyl)ether, C = 2-(di-tert-butylphosphino)biphenyl, D = tri-o-tolylphosphine, E = tri-2-furylphosphine, F = Ph3P. (e) Correlation between fluorescence intensity and [PtCl2] in 1 : 4 DMSO–pH 7 buffer after 24 h. ◆ = 24 °C; y = 0.00140x + 0.0255; R2 = 0.999. The intensity continued to be linear to 625 nM (125 ppb). ■ = 37 °C. | ||
Initial rates were measured to verify the pH dependence results. As Fig. 2c shows, the reaction at pH 7 was approximately 3.5 times faster than that at pH 10 and little reaction occurred at pH 4. We then examined this platinum detection method for catalytic turnover and sensitivity. The TOF for Pt in pH 7 buffer under high dilution and salt conditions ([ 1] = 12.5 μM; [Pt] = 50 nM; [PO43−] = 50 mM) was determined as 4.5 h−1.
Because platinum has a higher reduction potential than palladium, we also tested a number of different phosphines and found that Ph3P was the most effective additive (Fig. 2d). Using these conditions, the fluorescence intensity correlated to the concentration of platinum in the 625 pM–625 nM (125 ppt–125 ppb) range after 24 h at 24 °C (Fig. 2e). Further sensitivity in the 125 pM–625 nM (25 ppt–125 ppb) range was obtained by heating to 37 °C (Fig. 2e).
With our successful detection method for platinum in hand, we next performed detection in real samples. As an initial example, we confirmed the platinum concentration in a commercially available platinum drink with 50-ppm platinum.1a,b As Fig. 2b (F) shows, we were able to detect platinum in this drink. It is important to note that the platinum in the drink is in nanocolloid form, indicating that this method may be used for the quality control of catalytic converters and fuel cells.
Although this platinum detection method has been effective in the presence of various salts in buffers, it was not certain whether this method could be applied to platinum monitoring in serum because serum is turbid and contains many proteins at high concentration (total concentration: 60 mg mL−1 = 6 × 10⁴ ppm) and sulfur-containing residues (e.g., Cys, Met, glutathione), an atypical environment for the Tsuji–Trost reaction. Approximately 80% of cisplatin in blood is known to be bound to proteins such as albumin, and free cisplatin is of interest for those who need to ensure the effective dose of this drug.11a Since the pharmacokinetics of drugs vary among individuals, the monitoring of cytotoxic drugs is of paramount importance in medicine. As an initial examination, we spiked immunopure human serum with various cisplatin concentrations and tested the resulting samples with our fluorescent method. As Fig. 3a shows, despite the presence of many sulfur-containing proteins and other components in serum, our fluorescent method was robust enough to detect cisplatin easily at 100 nM (20 ppb; free cisplatin: ∼20 nM = 4 ppb). With the total concentration of cisplatin at 100 nM in human serum, the fluorescence intensity (2.7 × 10⁵; intensity without cisplatin = 1.0 × 10⁵) corresponded to 20 nM of cisplatin in pH 7 buffer (2.8 × 10⁵), which is consistent with the literature about free vs.protein-bound cisplatin in serum.11a
![Pt detection in samples. In these graphs, the y-axis is fluorescence intensity (a.u. × 105) at 525 nm. In all cases, the assays were performed for 1–20 h at 24 °C. In the serum experiments, [ 1] = 300 μM and [PPh3] = 6.0 mM. (a) Correlation between the concentration of cisplatin in immunopure human serum and fluorescent intensity. y = 0.0136x + 3.41; R2 = 0.983. (b) Correlation between the concentration of cisplatin in sheep serum and fluorescent intensity. (c) Kimwipes® in pH 7 buffer solution containing 1 (12.5 μM) and Ph3P (250 μM). Left = Clean Kimwipe®; Right = Kimwipe® from cisplatin-contaminated tile.](/image/article/2009/CC/b817220j/b817220j-f3.gif) | ||
| Fig. 3 Pt detection in samples. In these graphs, the y-axis is fluorescence intensity (a.u. × 105) at 525 nm. In all cases, the assays were performed for 1–20 h at 24 °C. In the serum experiments, [ 1] = 300 μM and [PPh3] = 6.0 mM. (a) Correlation between the concentration of cisplatin in immunopure human serum and fluorescent intensity. y = 0.0136x + 3.41; R2 = 0.983. (b) Correlation between the concentration of cisplatin in sheep serum and fluorescent intensity. (c) Kimwipes® in pH 7 buffer solution containing 1 (12.5 μM) and Ph3P (250 μM). Left = Clean Kimwipe®; Right = Kimwipe® from cisplatin-contaminated tile. | ||
We then tested our method in sheep serum samples containing immunoglobulins. Sheep serum was used in this case because we wanted to ensure the purity of the serum samples, and human serum samples may contain palladium or platinum impurities depending on the source. Although detection was not observed using our previous method, after initial treatment of serum/cisplatin mixtures with 5% HNO3, cisplatin was detected to 50 nM (10 ppb) (Fig. 3b). Further optimizations for sample preparations may be needed, but these results provide a proof of concept that the concentration of free cisplatin can be monitored fluorescently in serum. Thus far, our method appears to be superior to ICP-MS, whose detection limit in serum is typically 0.1–10 ppm, and our method requires only 50 μL of serum.11a,b
Next we demonstrate that this fluorometric platinum detection method can be used in hospitals and pharmacies, where platinum-based anticancer drugs are handled and contamination in the working environment is considered to be an occupational hazard.12a,b We spilled a solution of cisplatin on a floor tile and wiped it with a wet paper towel. Subsequently, a piece of Kimwipe® soaked with 1% hydrochloric acid was used to wipe the spill area,12c and the resulting paper towel was tested for possible residual platinum. As Fig. 3c shows, our fluorescent method can detect cisplatin contamination even in such crude samples.
In conclusion, we have provided the first experimental evidence for the use of 1 as a quantitative platinum probe. This method allows for the detection of total quantities of platinum at low nanomolar levels. We have also fluorescently detected this metal in heterogeneous samples such as human serum. This fluorometric detection method may find broad applications in materials, energy and human health. Finally, the method was applied to the on-site detection of platinum in a workplace environment. Although this method can detect both palladium and platinum7 and the identity of a contaminated metal may not be clearcut in some instances, a strong fluorescence signal should be taken as an alarming sign because this method is highly specific for these two toxic metals.7 Moreover, if palladium is the suspected metal, our more recent method may allow for identification of this metal in the presence of platinum.10b
This research was supported by the US National Science Foundation (CHE-0616577).
Notes and references
- (a) http://www.kornax.com/Liquid_Platinum_Water.htm ; (b) http://www.apt-ca.com ; (c) M. Kajita, K. Hikosaka, M. Iitsuka, A. Kanayama, N. Toshima and Y. Miyamoto, Free Radical Res., 2007, 41, 615 CrossRef CAS.
- (a) L. Kelland, Nat. Rev. Cancer, 2007, 7, 573 CrossRef CAS; (b) K. S. Lovejoy, R. C. Todd, S. Zhang, M. S. McCormick, J. A. D’Aquino, J. T. Reardon, A. Sancar, K. M. Giacomini and S. J. Lippard, Proc. Natl. Acad. Sci. U. S. A., 2008, 105, 8902 CrossRef CAS.
- (a) K. Pyrzynska, J. Environ. Monit., 2000, 2, 99N RSC; (b) B. Bocca, A. Alimonti, A. Cristaudo, E. Cristallini, F. Petrucci and S. Caroli, Anal. Chim. Acta, 2004, 512, 19 CrossRef CAS; (c) M. A. Palacios, M. Gómez, M. Moldovan and B. Gómez, Microchem. J., 2000, 67, 105 CrossRef CAS.
- (a) B. E. Erickson, Anal. Chem., 2006, 78, 5240; (b) T. H. Lane, Anal. Chem., 2006, 78, 5607 CrossRef CAS; (c) M. A. Brook, Anal. Chem., 2006, 78, 5609 CrossRef CAS; (d) E. D. Lykissa and S. V. M. Maharaj, Anal. Chem., 2006, 78, 2925 CrossRef CAS.
- (a) R. F. Service, Nature, 2007, 315, 172 CAS; (b) Y. Shao-Horn, W. C. Sheng, S. Chen, P. J. Ferreira, E. F. Holby and D. Morgan, Top. Catal., 2007, 46, 285 CrossRef CAS; (c) http://www.hydrogen.energy.gov/pdfs/review07/fc_30_shore.pdf .
- (a) J. G. Morrison, P. White, S. McDougall, J. W. Firth, S. G. Woolfrey, M. A. Graham and D. Greenslade, J. Pharm. Biomed. Anol., 2000, 24, 1 Search PubMed; (b) A. Ghezzi, M. Aceto, C. Cassino, E. Gabano and D. Osella, J. Inorg. Biochem., 2004, 98, 73 CrossRef CAS; (c) For example, see: N. Jakubowski, I. Feldmann and D. Stuewer, J. Anal. At. Spectrom., 1997, 12, 151 Search PubMed.
- F. Song, A. L. Garner and K. Koide, J. Am. Chem. Soc., 2007, 129, 12354 CrossRef CAS.
- L. Kürti and B. Czakó, in Strategic Applications of Named Reactions in Organic Synthesis, Elsevier Academic Press, London, 2005, p. 458 Search PubMed.
- (a) A. Peloso, Coord. Chem. Rev., 1973, 10, 123 CrossRef CAS; (b) A. R. Chianese, S. J. Lee and M. R Gagné, Angew. Chem., Int. Ed., 2007, 46, 4042 CrossRef CAS; (c) Pt-catalyzed O-deallylation is rare in the literature; see the only example: B. Moreau, S. Lavielle and A. Marquet, Tetrahedron Lett., 1977, 30, 2591 Search PubMed.
- (a) For rigorous absorbance and fluorescence emission studies of 2, see: K. Koide, F. Song, E. D. de Groh, A. L. Garner, V. D. Mitchell, L. A. Davidson and N. A. Hukriede, ChemBioChem, 2008, 9, 214 Search PubMed; (b) For absorbance and fluorescence emission properties of 1 in comparison to 2, see: A. L. Garner and K. Koide, Chem. Commun. 10.1039/b814197e.
- (a) P. Allain, O. Heudi, A. Cailleux, A. Le Bouil, F. Larra, M. Boisdron-Celle and E. Gamelin, Drug Metab. Dispos., 2000, 28, 1379 CAS; (b) R. R. Barefoot and J. C. Van Loon, Anal. Chim. Acta, 1996, 334, 5 CrossRef CAS.
- (a) A. Pethran, R. Schierl, K. Hauff, C. H. Grimm, K. S. Boos and D. Nowak, Int. Arch. Occup. Environ. Health, 2003, 76, 5 CAS; (b) E. E. M. Brouwers, A. D. R. Huitema, E. N. Bakker, J. W. Douma, K. J. M. Schimmel, G. van Weringh, P. J. de Wolf, J. H. M. Schelens and J. H. Beijnen, Int. Arch. Occup. Environ. Health, 2007, 80, 689 CrossRef CAS; (c) Procedure taken from ref. 12b.
Footnote |
| † Electronic supplementary information (ESI) available: Experimental details. See DOI: 10.1039/b817220j |
| This journal is © The Royal Society of Chemistry 2009 |