Enabling a microfluidic immunoassay for the developing world by integration of on-card dry reagent storage†
Dean Y.
Stevens
*a,
Camille R.
Petri
b,
Jennifer L.
Osborn
a,
Paolo
Spicar-Mihalic
c,
Katherine G.
McKenzie
a and
Paul
Yager
a
aDepartment of Bioengineering, University of Washington, Box 355061, Foege N530J, 1705 NE Pacific Street, Seattle, WA 98195-5061, USA. E-mail: yasuo@u.washington.edu; Fax: +1 206 543 6124; Tel: +1 206 616 3129
bDepartment of Biology, Boston College, 140 Commonwealth Avenue, Chestnut Hill, MA 02467, USA
cDepartment of Chemistry, University of Washington, Seattle, WA, USA
First published on 16th October 2008
Abstract
As part of an effort to create a point-of-care diagnostic system for the developing world, we present a microfluidic flow-through membrane immunoassay with on-card dry reagent storage. By preserving reagent function, the storage and reconstitution of anhydrous reagents enables the devices to remain viable in challenging, unregulated environmental conditions. The assay takes place on a disposable laminate card containing both a porous membrane patterned with capture molecules and a fibrous pad containing an anhydrous analyte label. To conduct the assay, the card is placed in an external pumping and imaging instrument capable of delivering sample and rehydrated reagent to the assay membrane at controlled flow rates to generate quantitative results. Using the malarial antigen Plasmodium falciparumhistidine-rich protein II (PfHRP2) as a model, we demonstrate selection of dry storage conditions, characterization of reagent rehydration, and execution of an automated on-card assay. Gold–antibody conjugates dried in a variety of sugar matrices were shown to retain 80–96% of their activity after 60 days of storage at elevated temperatures, and the release profile of the reconstituted reagent was characterized under flow in microfluidic channels. The system gave a detection limit in the sub-nanomolar range in under nine minutes, showing the potential to expand into quantitative, multi-analyte analysis of human blood samples.
Introduction
Improving global health requires accurate diagnostic technologies that are appropriate to the challenges of the developing world. In regions with limited health care systems, misdiagnosis may be especially costly, considering that treating the wrong disease wastes both meagre therapeutic budgets and limited time with health workers who may have only a single interaction to help patients in remote settings. Malaria, for instance, kills over a million people annually1 and is subject to high rates of over-diagnosis in regions with large febrile populations.2 Although effective methods of malarial diagnosis, such as the enzyme-linked immunosorbent assay (ELISA) and microscopy, are prevalent in well-equipped laboratories, assays in the developing world must couple accuracy and sensitivity with formats that accommodate challenges such as low diagnostic budgets, rough handling in remote locations, and a lack of refrigeration, regular power, and trained personnel.3–5Microfluidic systems have a number of characteristics that may be brought to bear on these challenges, such as the ability to process and analyze small samples in an automated, rapid, and repeatable manner.6,7 Changes in scale have allowed improvements in sensitivity and detection limits,8,9 and some groups have been pursuing the use of inexpensive disposables as part of their methods for analyte detection or sample processing.10,11 Integration of reagent storage and result analysis on the microfluidic system reduces demands on end-users, thereby putting the entire analytical process within reach of lower-resource settings.
One approach to microfluidic systems couples a low-cost disposable assay card containing all necessary reagents with a portable reader capable of assay automation and quantitative optical measurement. This approach allows advanced control capabilities and a low cost per test, thus spanning the gap between sophisticated benchtop assays and disposable dipstick assays, the current standard for rapid diagnostic tests (RDTs) in the developing world.4 A grant from the Bill & Melinda Gates Foundation's Grand Challenges in Global Health initiative is currently supporting development of such a device featuring immunoassays and nucleic acid assays for a multiplexed panel of diseases detectable in blood.12
We present a rapid immunoassay format amenable to the disposable-and-reader model, using the malarial antigen Plasmodium falciparumhistidine-rich protein II (PfHRP2) as an example. The assay is conducted on a laminate microfluidic card containing stable, anhydrous labeling reagent and a porous assay membrane, with external hardware handling the fluid pumping and optical readout. The assay is conducted in under nine minutes by injecting the sample into the card, clamping the card ports in a pump interface manifold, and starting an instrument script that rehydrates the on-card reagent and pushes the sample and labeling reagent through the assay membrane.
For developing-world applications, dry-form reagent storage is particularly important for its ability to preserve reagent function in environments with high local temperatures and a lack of refrigeration. Anhydrous on-card storage can also simplify assay automation, which can improve assay repeatability and reduce user training requirements. The dry storage method demonstrated in the PfHRP2 assay cards allows simple drop-in addition of reagent pads, as opposed to other methods that require fluid application during card assembly.13,14
This assay system addresses some of the unmet needs of existing tests.3 The ELISA format provides a quantitative test for PfHRP2 with a low detection limit, but it requires manual operation, controlled storage conditions, and reagent incubation times on the order of hours. The lateral flow or immunochromatographic strip (ICS) assay format provides low-cost tests and simple operation, but it allows only simple fluidic manipulation, is limited in automation capability, and typically generates only qualitative results. Additionally, since most sandwich-assay ICS tests accommodate only a single assay step that mixes sample and secondary label prior to capture, they are subject to signal attenuation at high analyte concentrations in what is known as the “hook” effect.15 In contrast to these methods, the approach presented here is capable of sophisticated flow-rate control, sequential fluid addition for multi-step assays, multiplex formatting, complete automation, and result quantification in a low-cost disposable that withstands unrefrigerated storage.
Assay principles
The central component of the assay is a laser-cut porous membrane, patterned with capture molecules and encased in a channel that directs fluid through the membrane. For a sandwich assay (Fig. 1), a sample is passed through the membrane at a controlled flow rate by an external pumping mechanism, allowing capture of sample analyte, followed by a buffer wash to remove unbound sample. Buffer is also passed over a fibrous pad containing a labeling reagent dried in a preservative matrix. The rehydrated reagent is then passed through the assay membrane, allowing binding of the label to the captured analyte, followed by a wash to remove unbound label. For visible labels, the quantity of captured analyte can be measured by estimating the amount of bound label from a video or still image of the assay results. The example analyte used in this study is PfHRP2, a water-soluble protein produced by the Plasmodium falciparum strain of malarial parasites that induces heme polymerization in erythrocyte hosts.16–18 It is commonly used in RDTs as a plasma biomarker for schizogony, the parasite's asexual reproductive process that releases PfHRP2.19–21 In this study, PfHRP2 is added to and detected in fetal bovine serum, which acts as a complex but noninfectious matrix substituting for human plasma. Antibody bound to the assay membrane acts as the capture molecule and gold–antibody conjugate stored in a sugar-based matrix acts as the label, generating a visible increase in optical density proportional to the concentration of analyte present. | ||
| Fig. 1 (a) Cross-section and close-up schematic of the flow-through membrane assay format. In the cross-section, the two inlets are depicted: one for the rehydrated labeling reagent and the other for fluids such as the sample and wash buffer. The schematics are not to scale. (b) Design and image of assembled, 10-layer assay card. The fluidic connections are at the bottom of the figure, with the three left-most ports connecting to pumps and the remaining port connecting to a waste reservoir. The card is pictured before use, with the red gold–antibody conjugate present in the pad. The inset image shows the pattern of capture regions visible on the membrane after completion of the assay. The card measures 83 by 52 mm, and is 2.3 mm thick. | ||
This system shares some materials with ICS tests: a porous assay membrane patterned with capture molecules and a fibrous pad containing dry gold–antibody conjugates in sugar. The porous membrane provides advantages over planar assay substrates, including decreased diffusion distances and increased surface areas for binding. These factors contribute to shorter assay times and increased signal strength compared to those seen for a flat capture surface. The fibrous conjugate pad provides large surfaces for rehydration, and the sugar matrix acts to stabilize protein structure and thus preserve function.22
By reformatting these components into microfluidic channels, several aims are advanced. The transverse flow of reagents, actuated by external pumps rather than capillary action, allows more sophisticated control of reagent flow through the membrane. Sequential reagent addition, variable flow rates, and automated timing are all possible, and parallel assay multiplexing is achieved by spatially separating different capture molecules on the membrane. Conjugate pads placed in microfluidic channels allow pick-and-place addition of reagents to devices, and because the pads can fill the volume of a reconstitution channel, they can also provide a means for more uniform release of reagent across a channel cross-section.
Experimental
Device design and fabrication
The disposable assay card design (Fig. 1) consists of a chamber holding the assay membrane, three upstream fluid lines (sample line, conjugate pad line, and bubble venting line) connecting to syringe pumps, and a downstream waste line. Three pumps are required in this case because the cards are valveless, although simpler fluid actuation systems have been proven to work.Nitrocellulose membrane (Whatman® Protran®, 0.45 µm pore size) was sandwiched between two polymer layers and cut with a 25-watt CO2 laser (M-360, Universal Laser Systems Inc., Scottsdale, AZ, USA).23 The membrane was placed on a mechanically actuated stage and 0.15 µL of 0.25 mg mL−1 anti-PfHRP2 IgM (National Bioproducts Institute, Pinetown, South Africa) was patterned in each of 16 locations in a 4 × 4 grid, giving capture spots 120 µm in diameter. The membrane was then blocked for 30 minutes in Zymed®Membrane Blocking Solution, followed by drying at 20 °C and storage in a desiccator.
Cards were built from laser-cut layers of adhesive-backed Mylar and PMMA (Fraylock, Inc., San Carlos, CA, USA), as practised in this lab and elsewhere for over 10 years.24,25 To prevent non-specific binding, channel surfaces were blocked by immersion in 10% bovine serum albumin (BSA) for 30 minutes, followed by rinsing with deionized water and baking at 35 °C for 30 minutes. During final assembly, the card encased the assay membrane and a conjugate pad containing 20 µL of anti-PfHRP2 gold conjugate at OD524 = 10. The assay membrane sat in the pocket of a 0.004 inch-thick Mylar layer, held in place between two adhesive-backed Mylar layers that forced fluid flow through the membrane (Fig. 1a).
On-card assay procedure
A sample consisting of recombinant PfHRP2 (Immunology Consultants Laboratory, Newberg, OR, USA) in fetal bovine serum (FBS) was injected by pipette into the sample line of the assay card until the fluid front reached a fiducial mark on the card (approximately 185 µL of sample). The card was clamped into the manifold of a microFlow™ fluidics workstation (Micronics, Inc., Redmond, WA, USA), which provided positive-displacement pumping for the assays via syringe pumps and software control. Phosphate-buffered saline (PBS) with 0.1% Tween® 20 (PBST) filled each pump reservoir and was used to push the sample, rehydrate the gold conjugate, and wash the membrane.A script ran the assay in the following steps: (1) pumping PBST into the conjugate pad to initiate conjugate rehydration; (2) pumping PBST through the sample line to drive sample slowly through the membrane; (3) pumping PBST quickly through the sample line to wash away unbound sample from the membrane; (4) pumping PBST from the conjugate pad line while drawing negative pressure on the bubble vent line to remove air from between the rehydrated conjugate and the PBST filling the assay chamber; (5) pumping PBST through the conjugate pad to drive conjugate slowly through the membrane; (6) pumping PBST through the membrane to wash unbound conjugate from the area. A range of volumes and flow rates of reagents were tested.
In a test of the detection limit of the card, the membrane flow-through area was 7.6 mm2 and the volumes and flow rates for the above numbered steps were as follows: (1) 19 µL @ 4.0 µL s−1 (conjugate reconstitution), (2) 120 µL @ 0.5 µL s−1 (sample through membrane), (3) 300 µL @ 4.0 µL s−1 (wash), (4) 9 µL @ 4.0 µL s−1 (conjugate advance and air removal), (5) 12 µL @ 0.1 µL s−1 (conjugate through membrane), and (6) 180 µL @ 4.0 µL s−1 (wash). Note that the early conjugate reconstitution prior to use allowed approximately 6 minutes for the reagent to dissolve during other assay steps. Studies during card development showed that this approach improved uniform conjugate delivery compared to reconstituting the reagent immediately before introduction to the membrane. In total, the assay steps took under 9 minutes from the start of step 1 to the end of step 6.
Dry reagent storage and microfluidic release
Gold colloid was produced by reduction of gold chloride by sodium citrate,26 with an absorbance of OD524 = 1.25 and a size of roughly 40 nm confirmed by TEM. Anti-PfHRP2 IgG (National Bioproducts Institute, Pinetown, South Africa) was conjugated to the colloid using methods described previously.27 After centrifugation at 6500 × G, the conjugate pellet was resuspended in a Tris-buffered saline solution containing BSA and was filtered through a 0.45 µm cellulose acetate filter. A similar product was also obtained commercially, with a peak absorbance of OD534 = 10.0 (BBInternational, Cardiff, United Kingdom).The spunbonded polyester conjugate pad (6613, Ahlstrom, Holly Springs, PA, USA) was laser-cut into circles 0.25 inches in diameter, and then was soaked for 30 minutes in an aqueous solution containing BSA. The pads were dried for 30 minutes at 35 °C and were stored in a desiccator until used.
For dry preservation, sucrose and trehalose were added to the OD524 = 10 conjugate at up to 10% w/v each. The pads were placed into the wells of a 48-well plate, previously blocked with 10% BSA, and 10–30 µL of conjugate was pipetted onto each pad. The plates were baked in a 35 °C oven until the pads were completely dry (1–4 hours) and were then transferred to a desiccator until used. In tests of long-term stability, pads were sealed in polyethylene bags with a pouch of desiccant and stored at 4, 20, and 40 °C to mimic refrigerated, room-temperature, and elevated outdoor environments.
To test reagent release, the conjugate pad was sealed in a laminated microfluidic card (prepared in the same manner as the assay card) with a chamber that directed fluid flow through the pad. A syringe pump (V6, Kloehn Ltd., Las Vegas, NV, USA) pushed PBST into the dry chamber from an inlet, and rehydrated reagent exited the card via an extended observation channel with a rectangular cross-section measuring 0.02 × 0.12 inches.
Vacuum manifold assay procedure
To run the assay in a high-throughput benchtop format, a 96-well-plate vacuum manifold (Bio-Dot®Microfiltration Apparatus, Bio-Rad, Hercules, CA, USA) was used. It sandwiches a membrane and a silicone gasket between a bottomless 96-well plate and a base with a vacuum inlet. In this arrangement, reagents pipetted into the wells are exposed to the membrane as the vacuum draws them through the membrane pores at a flow rate controlled by the vacuum pressure and fluid viscosity. Fluid from each well passes through a membrane area of 7.8 mm2.Each well location on a sheet of membrane was functionalized with capture molecules by pipette-spotting 3 µL of anti-PfHRP2 IgM at 0.5 mg mL−1. The membrane was dried for 20 minutes at room temperature prior to being blocked and stored as above. To rehydrate dry reagents, pads were placed in microcentrifuge tubes with enough PBST to bring them to a calculated OD524 of 2.5, based on the volume of conjugate loaded onto the pad, and vortexed for 30 seconds.
To run the assay, the membrane was immersed in PBS and clamped into the manifold. The vacuum was set to 5 inches Hg, and the following steps were followed for each well. (Unless vacuum is off, each step ends after the well empties.) (1) Add 100 µL PBST; (2) with vacuum off, add 200 µL sample (prepared as above); (3) vacuum sample through for 4 seconds, turn off vacuum for 4 minutes, and then turn vacuum back on; (4) add 600 µL PBST, followed by 600 µL PBS; (5) with vacuum off, add conjugate; (6) repeat steps 3 and 4 for the conjugate and final wash.
The end result of the vacuum manifold assay is a membrane patterned with a grid of assay regions. The optical density of each region tends to be uniform across the middle of the spot with a darker ring around the perimeter; quantification of the signal uses the uniform region near the center of each spot.
Image capture and analysis
Assay results were imaged with a flatbed scanner (ScanMaker i900, MicroTek International, Inc., Cerritos, CA, USA) in 48-bit RGB at a resolution of 600 ppi (vacuum manifold format) or 2400 ppi (on-card format). Images of the vacuum manifold results were quantified in MATLAB® (The Mathworks™, Natick, MA, USA) by (1) semi-automated selection of regions of interest (ROIs) containing a uniform center region of each assay spot, (2) creation of a histogram of green-channel pixel intensities for each assay ROI, (3) mild low-pass filtering of the histogram, and (4) report of the histogram mode. “Blank subtracted” signals are the difference between the signal obtained from a sample of interest and that of a “blank”—a sample containing no analyte. Images of the on-card results were quantified in ImageJ28 by (1) manual selection of regions of interest inside and outside each visible spot, (2) measurement of the mean green-channel pixel intensity of each ROI, (3) calculation of the difference between the ROI means inside and outside of each spot, and (4) report of the mean of these differences for all spots present.‡On-card assays were also captured on a low-cost USB camera (AM211 Dino-Lite, AnMo Electronics Corp., Hsinchu, Taiwan) capable of quantifying the assays in the same manner.Microfluidic reagent release was imaged at a magnification of 1× on a Nikon SMZ1500 microscope with an Optronics DEI-750D camera (Optronics, Goleta, CA, USA) capturing 10 frames per second in the green channel. Images were quantified by (1) creating an absorbance image of each frame by comparing it to an image of the channel with only PBST present; (2) selecting one ROI in the channel and another outside of it; (3) correcting the mean absorbance of each frame's in-channel ROI by subtracting that of the out-of-channel ROI, which should be constant over time; (4) reporting the corrected absorbance. The method was validated with a dilution series of gold conjugate that was also measured on a spectrophotometer, allowing camera absorbances (based on a broad green spectrum) to be converted to OD534 measurements.
Results and discussion
Dry reagent storage
Sucrose and trehalose have been implicated in the stabilization of proteins and membranes in organisms that undergo complete dehydration.22 Adding them to protein-based reagents has been shown to stabilize the reagents in dry form.13,14,29 Three off-card experiments were conducted to determine how effectively the sugars could preserve function of the assay's labeling reagent, a gold–antibody conjugate, under the assumption that the off-card dry storage of reagent is similar or identical to dry storage on a device. The first experiment tested the effect the sugars have on liquid reagent, without any drying process. The second tested how effective various sugar loadings were at preserving function after drying and rehydrating the reagent. The last tested the long-term stability of dry reagent using the better-performing sugar formulations.Adding sugars to liquid gold–antibody conjugate was shown to reduce assay signal strength in the vacuum manifold format (Fig. 2). Using total sugar loadings of 0–15% w/v, it was found that both sucrose and trehalose interfered with signal production—higher sugar loading resulted in lower signals relative to an unloaded sample. Signal reduction ranged from 10–90%, and trehalose caused a greater decrease than sucrose. The reason for signal reduction is not clear, but the sugars may interfere with antibody binding or conjugate transport. Based on these results, lower sugar loadings would be preferred.§
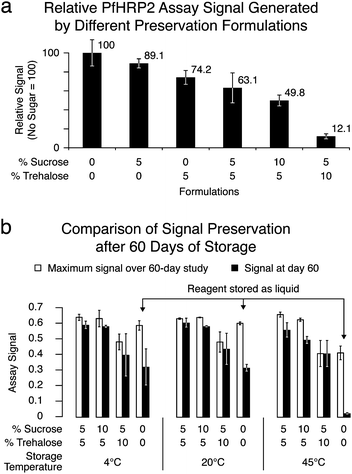 | ||
| Fig. 2 (a) Chart showing how assay performance is affected by the presence of sugar in the liquid-phase anti-PfHRP2 gold–antibody conjugate. Here, duplicate assays were run with samples containing 400, 200, 100, 50, 25, and 12.5 ng mL−1 of PfHRP2 in FBS. For each sugar loading, the chart plots the average and SD of the blank-subtracted signals obtained for these six antigen concentrations, relative to that of the no-sugar-added conjugate. A decrease in signal strength with increased sugar loading is evident. (b) Chart showing the effect of long-term dry storage of the conjugate on assay performance. The chart shows the highest blank-subtracted signal obtained (n = 3) over the duration of a 60-day study, compared to that obtained on day 60.¶ Four sugar loadings and 3 storage temperatures were compared, and assays were run on days 1–4, 6, 8, 12, 16, 42, and 60. All sugar loadings are given in weight/volume percentages. | ||
Initial attempts to preserve the conjugate reagent in a dry state demonstrated that sugar addition was required to preserve conjugate activity. Loadings of 0–10% sucrose and trehalose were added to aliquots of conjugate, and 50 µL of conjugate was added to each fibrous pad for drying. Assays were conducted using 160 µL of OD524 = 2.5 conjugate per well in the vacuum manifold format. Samples without PfHRP2 (blanks) gave high non-specific signals at 0–5% total sugar loading, and gave low non-specific signals at 10% and higher loading. Samples with 200 ng mL−1 PfHRP2 produced signals that were higher than the blanks—the magnitude of difference was consistent for sucrose/trehalose loadings of 5%/0%, 0%/5%, 5%/5%, and 10%/5%. A sugar loading of 5% sucrose and 10% trehalose, however, gave a lower signal difference from the blanks than the other formulations, likely due to the interference described above. Conjugate dried without sugars produced such a high non-specific signal that the 200 ng mL−1 sample did not show a significant increase in specific signal. These results suggest that loadings greater than 5% are required to avoid non-specific signal production possibly caused by the formation of conjugate clusters that clog the membrane pores.
For long-term stability studies of the dry conjugate, sucrose/trehalose loadings of 5%/5%, 10%/5% and 5%/10% were chosen, and pads were loaded with 30 µL of OD524 = 10 conjugate. Aliquots of liquid conjugate without sugar were stored alongside the dry conjugate at temperatures of 4, 20, and 40 °C. In vacuum-manifold assays, long-term storage of dry gold–antibody conjugates showed preservation of 80–96% of signal after 60 days, compared to 6–55% for the liquid solution (Fig. 2). These results indicate that the reagent should retain function on-card after long-term dry storage and rehydration in PBST. Preferred sugar formulations prevent rapid loss of reagent activity without interfering greatly with signal strength. For qualitative assays used shortly after production, lower sugar loadings may offer higher signal strengths. For quantitative assays used after longer storage periods, higher sugar loadings may offer greater signal stability.
Microfluidic reagent reconstitution
To be relevant to a microfluidic assay, the conjugate pads must be incorporated into on-card rehydration channels. Two channel designs were tested: one to push fluid laterally through the pad, and another to push it through in a transverse direction (Fig. 3). It was believed that the two designs would give different reagent release profiles. In both designs, however, the pad's fibrous structure actively wicked fluid into the pad. When a fluid front reached the pad, the wicking action caused all buffer reaching the pad to enter it through the first point of contact rather than entering across the whole exposed pad surface. This result was observed for the range of flow rates tested (0.5–80 µL s−1). This effect was observed on the large fluid-entry surface of the transverse-flow format—the entire top of the pad—resulting in an inconsistently performing design. The upper chamber remained mostly filled with air, while fluid exited the pad into the bottom chamber in an irreproducible manner. All subsequent rehydration designs sought to reduce the tendency of wicking to trap air in the channel, doing so by providing small inlets to the pad chamber that limited the potential contact area between incoming buffer and the pad. Sections of the pad closer to chamber edges are less-efficiently perfused, resulting in gradual removal of conjugate by a combination of slow convection and diffusion into faster-flowing streams. A geometry in which the pad width equals the constant channel width would likely release conjugate more consistently across its volume by providing more uniform perfusion to all areas of the pad. | ||
| Fig. 3 (a) Diagram of channel geometry and fluid flow for reconstituting reagent dried on conjugate pads in either lateral- or transverse-flow geometries. On the left, a schematic of the desired flow lines is pictured. On the right, the channel geometries and observed flow are pictured. The transverse-flow geometry did not perform as desired, and the blue dashed lines indicate areas where air was not reliably displaced by fluid. The wicking action of the pad caused fluid to enter the pad through the first point of contact rather than through the whole top surface of the pad, and the large exit area below the pad occasionally trapped air. (b) Images of reagent reconstitution and release from a conjugate pad. The pad measures 0.25 inches in diameter. (c) Plot of the conjugate pad release profile for a flow rate of 0.5 µL s−1, based on 7 replicate measurements. The inset is an image of the channel downstream of the pad, with the advancing fluid front visible to the right of the image. The white box identifies the in-channel ROI in which the measurements were made. The dark debris on channel edges is adhesive and did not affect the release profile measurements. | ||
Observation of the reconstituted conjugate 15 mm downstream of the pad showed a repeatable release profile. At a flow rate of 0.5 µL s−1, rehydrated conjugate came out at a concentration of OD534 = 25.6 (SD 4.1) and was clear of the pad and channel in 60–80 seconds (Fig. 3). Some of the variation seen may be due to differences in pad loading. Although each pad received 20 µL of conjugate at OD534 = 10, contact between the pad and the well in which it dried resulted in an inconsistent loss of conjugate from the pad. When seven pads were rehydrated in microcentrifuge tubes and their absorbance measured on a spectrophotometer, the absorbance CV was 9%. This variance could be lowered by changes to the pad loading technique. The repeatable reagent release profiles suggest that the rehydration technique can be used to deliver known concentrations of reagent to an assay surface over time.
On-card immunoassay for PfHRP2
To produce an automated, rapid, and simple-to-use assay for PfHRP2, the assay was put on-card with an integrated dry reagent. The assay gave sub-nanomolar detection limits on the order of those obtained in a well-based ELISA assay for PfHRP2,30 using an automated protocol completed in under 9 minutes (Fig. 4). These results were obtained using conjugate pads and antibody-patterned membranes prepared and stored at room temperature for 3–4 weeks prior to card assembly and 30 days prior to the experiment, demonstrating potential for the long-term efficacy of the devices.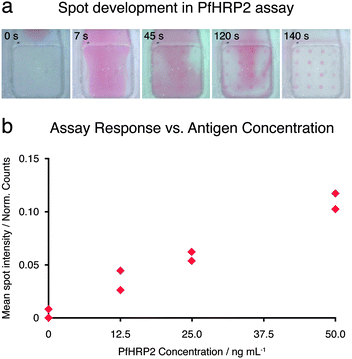 | ||
| Fig. 4 (a) Five video frames from an on-card PfHRP2 assay. The images show the development of red spots at PfHRP2 capture antibody regions during the addition of gold-antibody conjugate. Nonuniform conjugate concentration is evident across the assay membrane. (b) Plot of assay response versusantigen concentration for 8 low-concentration samples of PfHRP2 in FBS (two at each concentration). The lowest non-zero concentration is 12.5 ng mL−1 or 0.212 nM, and the assay response is as defined in the methods. Intensities are from assay cards that have been run to completion. | ||
Two factors that affect the assay signal strength are the flow rate and the volume of reagent exposed to the membrane (for a set sample size, this is determined by the membrane's flow-through area). Lower flow rates gave higher assay signals, likely due to increased binding during a longer period of reagent exposure at the membrane. A membrane reduced from 140 mm2 to 7.6 mm2 in area gave an 18-fold increase in the volume of sample exposed to a given region of membrane. With a set fluid flux, this increase corresponds to an equal increase in the time the reagent is exposed to the membrane, which again resulted in a higher assay signal. These results suggest that attempts to decrease assay time need to be balanced with appropriate interaction times for reagent transport and binding. The porous nature of the assay membrane favors shorter assay times than planar substrates in this regard: shorter diffusion requirements should allow more rapid transport of analyte and conjugate to the membrane surface. The sample and conjugate are likely to require different flow rates as demanded by the diffusion rates of their components, and current work is focused on optimizing flow rates and volumes to maximize binding and signal production.
Other observations suggest opportunities for improving assay consistency. The dry reagent release profile of Fig. 3 predicts concentrations downstream of the conjugate pad when the rehydrated reagent displaces air, but in the current assay card the conjugate displaces PBST. Because the resuspended conjugate contains high concentrations of sucrose and trehalose, its density is greater than the PBST it displaces, thereby resulting in a gravity-induced segregation of the two fluids. If the fluids aren't sufficiently mixed before reaching the membrane, the nonuniform distribution of conjugate across the vertical dimension of the channel results in the far edge of the membrane receiving insufficient conjugate to produce an assay signal. A protocol-based fix for this problem was rehydrating the conjugate at the beginning of the assay, several minutes prior to use, and then passing it through the downstream PBST slowly. This change resulted in a weaker vertical gradient of conjugate concentration, but some reagent nonuniformity issues remained. As can be seen in Fig. 4, parabolic flow profiles and Taylor dispersion focus conjugate in a plume down the center of the membrane. Pushing plugs of reagent with air bubbles should allow dispersion-free flow and improved uniformity of membrane exposure, although this approach will also require bubble removal prior to fluid reaching the membrane. Ongoing studies suggest that this approach is a feasible solution to these fluid delivery issues.
Lastly, many improvements remain to be made in aspects of the system that are not amenable to the final point-of-care setting for this assay. For instance, although serum-based samples were loaded by pipette in this study, this approach is not feasible in under-resourced settings. Finding appropriate methods for loading small volumes of whole blood, collecting the separated plasma, and metering the plasma sample for use in the assay is a design challenge for global-health applications that will affect the quality of assay results and remains to be addressed.
Conclusions
The flow-through membrane immunoassay for PfHRP2 demonstrates a general approach to rapid, automated, quantitative assays that are appropriate to the challenges of point-of-care diagnostics. Adjustable fluid delivery capabilities allow the assay operation to be tailored to the particular flow requirements and protocols demanded by different assay cards. This approach may give more flexible and robust performance compared to those dependent on capillary action, which lack the ability to actively control flow rates and are susceptible to changes in the wetability of the wicking materials over time.31 Integration of on-card anhydrous reagent enables device storage in unrefrigerated environments, using a pad-based method that disperses reagent through the cross-section of the channel and generates repeatable release profiles in microfluidic channels. While other dry reagent methods have deposited liquid reagents into chambers or depots that require mid-assembly drying of reagents,13,14 the approach presented here allows simple drop-in inclusion of dry reagents at the time of assembly. Dry reagent pads can be prepared in bulk separately from the devices themselves, to be added by assembly when appropriate. The colorimetric assay results produced by this system can be quantified by low-cost cameras to estimate analyte concentration as an indicator of infection intensity.The system described forms the groundwork for a more sophisticated and capable diagnostic tool, the advancement of which involves ongoing improvements in areas such as the following. Assay multiplexing is enabled by patterning multiple capture molecules in discrete regions across the membrane. Pneumatic pumping and valving allow simplification of on-card fluid actuation and plug-like flow that should improve reagent nonuniformities across the assay membrane. On-card fluid metering results in more consistent fluid volumes than the user-dependent approach described here. Fully-automated analysis of assay images allows objective quantification of assay results, and modifications to the analysis method should give a more linear signal–analyte relationship at high analyte concentrations. Leveraging the fluidic flexibility of the assay system, multi-step ELISA assays can be conducted on-card using a dried enzyme conjugate and liquid substrate. Progress has been made in all of these areas, the result of which is a new generation of device that is currently being tested. When combined with upstream blood separation and on-card storage of rehydration buffer, the system will be capable of sample-to-result quantification of multiple analytes from a human blood sample.
Acknowledgements
Support for this Project was provided through funding from The Bill & Melinda Gates Foundation's Grand Challenges in Global Health Initiative under Grant Number 37884, “A Point-of-Care Diagnostic System for the Developing World.” The views expressed by the authors do not necessarily reflect the views of the funding agency. Guidance on the fabrication and storage of gold–antibody conjugates was generously provided by Cori Barfield and Roger Peck of PATH. The authors would also like to thank Barry Lutz, Sujatha Ramachandran, Lisa Lafleur and Rahber Thariani for their input, as well as the other members of the DxBox team led by Patrick Stayton of the UW Department of Bioengineering, Fred Battrell of Micronics, Walt Mahoney of Nanogen, and Gonzalo Domingo of PATH.References
- World Health Organization, World malaria report 2005, World Health Organization report WHO/HTM/MAL/2005.1102, Geneva, 2005 Search PubMed.
- H. Reyburn, R. Mbatia, C. Drakeley, I. Carneiro, E. Mwakasungula, O. Mwerinde, K. Saganda, J. Shao, A. Kitua, R. Olomi, B. M. Greenwood and C. J. Whitty, Br. Med. J., 2004, 329, 1212 CrossRef.
- P. Yager, G. J. Domingo and J. Gerdes, Annu. Rev. Biomed. Eng., 2008, 10, 38.
- P. Yager, T. Edwards, E. Fu, K. Helton, K. Nelson, M. R. Tam and B. H. Weigl, Nature, 2006, 442, 412–418 CrossRef CAS.
- C. D. Chin, V. Linder and S. K. Sia, Lab Chip, 2007, 7, 41–57 RSC.
- P. A. Auroux, D. Iossifidis, D. R. Reyes and A. Manz, Anal. Chem., 2002, 74, 2637–2652 CrossRef CAS.
- G. M. Whitesides, Nature, 2006, 442, 368–373 CrossRef CAS.
- T. P. Burg, M. Godin, S. M. Knudsen, W. Shen, G. Carlson, J. S. Foster, K. Babcock and S. R. Manalis, Nature, 2007, 446, 1066–1069 CrossRef CAS.
- N. Christodoulides, S. Mohanty, C. S. Miller, M. C. Langub, P. N. Floriano, P. Dharshan, M. F. Ali, B. Bernard, D. Romanovicz, E. Anslyn, P. C. Fox and J. T. McDevitt, Lab Chip, 2005, 5, 261–269 RSC.
- S. K. Sia, V. Linder, B. A. Parviz, A. Siegel and G. M. Whitesides, Angew. Chem., Int. Ed., 2004, 43, 498–502 CrossRef CAS.
- X. Cheng, D. Irimia, M. Dixon, K. Sekine, U. Demirci, L. Zamir, R. G. Tompkins, W. Rodriguez and M. Toner, Lab Chip, 2007, 7, 170–178 RSC.
- A Point of Care Diagnostic System for the Developing World, http://www.gcgh.org/MeasureHealthStatus/Challenges/DiagnosticTools/Pages/PointofCare.aspx, accessed 6/30/2008.
- L. G. Puckett, E. Dikici, S. Lai, M. Madou, L. G. Bachas and S. Daunert, Anal. Chem., 2004, 76, 7263–7268 CrossRef CAS.
- E. Garcia, J. R. Kirkham, A. V. Hatch, K. R. Hawkins and P. Yager, Lab Chip, 2004, 4, 78–82 RSC.
- S. A. Fernando and G. S. Wilson, J. Immunol. Methods, 1992, 151, 47–66 CrossRef CAS.
- R. J. Howard, S. Uni, M. Aikawa, S. B. Aley, J. H. Leech, A. M. Lew, T. E. Wellems, J. Rener and D. W. Taylor, J. Cell Biol., 1986, 103, 1269–1277 CrossRef CAS.
- N. T. Huy, S. Serada, D. T. Trang, R. Takano, Y. Kondo, K. Kanaori, K. Tajima, S. Hara and K. Kamei, J. Biochem., 2003, 133, 693–698 CrossRef CAS.
- V. Papalexis, M. A. Siomos, N. Campanale, X. Guo, G. Kocak, M. Foley and L. Tilley, Mol. Biochem. Parasitol., 2001, 115, 77–86 CrossRef CAS.
- V. Desakorn, A. M. Dondorp, K. Silamut, W. Pongtavornpinyo, D. Sahassananda, K. Chotivanich, P. Pitisuttithum, A. M. Smithyman, N. P. Day and N. J. White, Trans. R. Soc. Trop. Med. Hyg., 2005, 99, 517–524 CAS.
- I. Clark, PLoS Med, 2006, 3, e68 CrossRef , author reply e69.
- C. Wongsrichanalai, M. J. Barcus, S. Muth, A. Sutamihardja and W. H. Wernsdorfer, Am. J. Trop. Med. Hyg., 2007, 77, 119–127 Search PubMed.
- J. H. Crowe, J. F. Carpenter and L. M. Crowe, Annu. Rev. Physiol, 1998, 60, 73–103 CrossRef CAS.
- P. Spicar-Mihalic, D. Y. Stevens and P. Yager, MicroTAS Proc., 2007, 667–669 Search PubMed.
- A. Hatch, A. E. Kamholz, K. R. Hawkins, M. S. Munson, E. A. Schilling, B. H. Weigl and P. Yager, Nat. Biotechnol., 2001, 19, 461–465 CrossRef CAS.
- B. H. Weigl, R. L. Bardell and C. R. Cabrera, Adv. Drug Delivery Rev., 2003, 55, 349–377 CrossRef CAS.
- G. Frens, Nat. Phys. Sci., 1973, 241, 20–22 Search PubMed.
- C. De Roe, P. J. Courtoy and P. Baudhuin, J. Histochem. Cytochem., 1987, 35, 1191–1198 CAS.
- W. S. Rasband, ImageJ, U.S. National Institutes of Health, Bethesda, Maryland, USA, http://rsb.info.nih.gov/ij/, 1997–2007.
- S. Ramachandran, J. Gerdes, P. Tarr, P. Yager, L. Dillan, R. Peck, M. Kokoris, M. Nabavi, F. Battrell, D. Hoekstra and B. H. Weigl, Proceedings of the 1st Distributed Diagnosis and Home Healthcare (D2H2) Conference, 2006, pp. 16–19 Search PubMed.
- C. M. Kifude, H. G. Rajasekariah, D. J. Sullivan, V. A. Stewart, E. Angov, S. K. Martin, C. L. Diggs and J. N. Waitumbi, Clin. Vaccine Immunol., 2008, 15, 1012–1018 CrossRef CAS.
- S. Haeberle and R. Zengerle, Lab Chip, 2007, 7, 1094–1110 RSC.
Footnotes |
| † Part of a special issue on Point-of-care Microfluidic Diagnostics; Guest Editors—Professor Kricka and Professor Sia. |
| ‡ The quantification approach described requires user intervention and is not suited to the ultimate application of this work: a fully-automated sample-to-result assay. In this work, user-guided selection of ROIs allowed a simple approach to avoiding non-uniform image characteristics that are not expected to be problematic at later stages. Fully automated quantification of assay results is a non-trivial task that can involve image registration, pattern recognition, correction for systematic variation in signal intensity (for example, flat-fielding approaches used in microscopy), and data transformation, among other steps. Ongoing work on fully automated quantification was shown to give results comparable to the manual methods used here and will be the focus of future publications beyond the scope of this article. |
| § In Fig. 2b, sugar-laden conjugate is shown to perform as well as the sugar-free conjugate, a result that appears to conflict with Fig. 2a. Note that the experimental conditions of these data differ: in Fig. 2a, the conjugates are tested in their original tris/BSA buffer, while in Fig. 2a, the sugar-laden conjugates have been dried and rehydrated in PBST. The apparently improved performance of the dried-then-rehydrated reagent is an unresolved issue that has appeared in other experiments and is being explored further in our group. |
| ¶ In the experiment reported in Fig. 2b, the earliest assay signals (days 1–3) were lower than subsequent measurements due to improvements in the capture surface over the first few days. This effect was subsequently reproduced in an experiment not reported here, and is believed to be related to increasing stability of the antibody-nitrocellulose binding as the membrane dries in low-humidity storage. In order to avoid misinterpretation caused by a comparison with day-1 assay signals, the day-60 signals are compared to the highest signals observed over the study duration. |
| This journal is © The Royal Society of Chemistry 2008 |