 Open Access Article
Millisecond denaturation dynamics of fluorescent proteins revealed by femtoliter container on micro-thermodevice
Hideyuki F.
Arata†
*,
Frederic
Gillot‡
,
Takahiko
Nojima
,
Teruo
Fujii
and
Hiroyuki
Fujita
Institute of Industrial Science (IIS), The University of Tokyo, 4-6-1 Komaba, Meguro-ku, Tokyo, 153-8505, Japan. E-mail: Hideyuk.Arata@curie.fr
First published on 29th July 2008
Abstract
Real-time observation of biomolecular behavior focusing on high speed temperature response is an essential endeavor for further biological study at the molecular level. This is because most of the important biological functions at the molecular level happen at the sub-second time scale. We used our own on-chip microheaters and microcontainers to observe the denaturation dynamics of fluorescent proteins at the millisecond time scale. The microheater controls the temperature in 1 ms under the microscope. Fluorescent proteins were contained in 28 fL PDMS microcontainers to prevent them from diffusing into the solution. The proteins were denatured by high temperatures and observed by a high speed CCD camera with 5 ms per frame. Hence, denaturation speeds of red fluorescent proteins (rDsRed and rHcRed) were measured to be 5–10 ms. Green fluorescent proteins (rAcGFP and rGFPuv) denatured with bi-exponential decay. rAcGFP denatured with time constants of 5 ms and 75 ms while rGFPuv denatured with 10 ms and 130 ms. This may be the reverse process of a two step renaturation of GFP observed in a previous report. This micro-thermodevice is applicable to other biomaterials such as nucleic acids or other proteins. It does not require any chemical treatment nor mutation to the biomaterial itself. Therefore, the methodology using this general purpose device gives access to biomolecular studies in short time scales and acts as a powerful tool in molecular biology.
1 Introduction
Green fluorescent protein (hereinafter GFP) is commonly used as a reporter protein in biological experiments.1 Investigating the dynamic properties of maturation and denaturation of GFP provides important information for understanding the relation between molecular structure and function of the protein. Maturation properties of GFP and chromophore formation2,3 have been well studied by bulk experiments in the time scale of hours to days. Renaturation of acid-denatured GFP was observed at the single molecule level at the second time scale.4 However, its denaturation properties have not been entirely studied. Information on the denaturation dynamics might result in important knowledge for understanding not only the molecular stability of proteins in general but also the structure–function correlation.GFP loses its fluorescence when denatured by temperatures higher than 70 °C,5,6 pH extremes or guanidinium chloride.6 It recovers its fluorescence partially only when renatured.6,7 The thermal stability of isolated and extracted recombinant GFP was evaluated.5 The temperature-dependence of GFP fluorescence from proton wires to proton exit were also studied.8 To elucidate the mechanism of denaturation properties at the molecular level, we need to perform real-time thermal experiments at the millisecond time scale during which these molecular phenomena occur.
Temperature controlling experiments by conventional techniques, such as laser heating, enable a response speed at the subsecond time scale.9,10 However, in those experiments, the experimental setup must be manually adjusted from one run to another. We also need expensive setups which require high skills to operate. This has been the major limitation to conducting enough experiments for statistical analysis. A new experimental procedure and tools for high speed temperature control with simple setups, which enable numbers of experiments at the required place, is necessary for further progress of this research field at the molecular level.
On the other hand, miniaturized devices have realized rapid, highly sensitive and parallel biological or chemical analysis with small amounts of samples thanks to the merits of miniaturization.11–13 An on-chip micro-thermodevice of a few hundred micrometers in size realized enzymatic experiments at high temperatures14 and real-time observation of biomolecular motors15 by rapid temperature alternation with a response time at the 1 second time scale. However, this response time was not fast enough to observe the denaturation of fluorescent proteins. In this report, a micro-thermodevice, which can control the temperature with a response time of 1 millisecond, was manufactured to measure the denaturation dynamics of fluorescent proteins. Hence, those dynamics were successfully measured at the millisecond time scale.
2 Micro-thermodevice
2.1 Design and geometry of the device
Fig. 1 shows a microheater (a) and microcontainers (b), a schematic of the device near the heater (c) and a step response (d) of a microheater. A thin-film microheater was fabricated by patterning nickel (hereinafter Ni) on a glass plate with sputtering and photolithography. The dimensions were exactly the same as our previously reported microheater device.16 The microheater heats up its internal and external area by joule heating. The heater wire is 200 nm thick and 2 μm wide. The size of the micoheater is 20 μm × 20 μm. Such dimensions allow 1 ms temperature control. The step response of a microheater (Fig. 1(d)) was measured by the co-integrated micro-thermocouple. A microfabricated poly-dimethylsiloxane (hereinafter PDMS) sheet was mounted onto the same glass substrate where the microheater was located. The cylindrical containers are 4 μm in diameter, 2.2 μm in height and 28 femtoliters in volume. This container prevents the sample materials from diffusing into the solution and enables us to measure the reaction of an extremely small amount of chemical. In the previous report, even the enzymatic activity measurements at the single molecule level could be performed using this PDMS microcontainer.17,18 The microcontainers located in the internal area of the microheater were used during the experiments because the temperature of the internal area is uniform enough as we describe in the next paragraph. This micro-thermodevice has additional advantages besides rapid temperature control: it does not require any biochemical modification nor mutation to the protein itself, and experiments can be repeated with the same microheater by changing PDMS sheets through easy bench top preparation.19 | ||
| Fig. 1 The micro-thermodevice for millisecond measurements. (a) A microheater fabricated on a glass plate. The bright part is patterned Ni and the dark part is naked glass. (b) A micro-patterned PDMS sheet. Cylindrical holes are patterned on one side of a PDMS sheet. The bottom right is a expanded picture taken by a scanning electron microscope (SEM). (c) A micro-patterned PDMS sheet was mounted on a microheater fabricated glass plate to form microcontainers. Buffer with proteins in microcontainers were heated up by a collocated microheater. (d) The step response of the microheater shows that this system enables temperature alternation experiments at the millisecond time scale. | ||
2.2 Numerical simulation of temperature homogeneity
Temperature within the 400 μm size microheater was shown to be uniform enough, in our previous work, both by experiment and by numerical simulation.20 In this work, finite element analysis (FEA, FemLab 3.1) was used to simulate the temperature homogeneity in the microcontainer when heated by the 20 μm size microheater. Fig. 2(a) shows the geometry used for the simulation and the temperature distribution at 0.3 ms after switching on the heater. For our simulations, we have considered a 2D geometry divided into 4 areas: on the SiO2 substrate (Thermal conductivity: κ = 1.38 W mK−1) we put a section of the Ni heater, represented by a 2 μm × 0.2 μm area (Thermal conductivity: κ = 90.7 W mK−1). Two microcontainers of 4 μm in diameter, 2.2 μm in height were placed at 2 μm and 8 μm from the heater. The microcontainers were filled with water (Thermal conductivity: κ(T)= 0.0015T + 0.1689). Considering the time and scale range of our simulation, we have simulated only the conduction mode, i.e. the heat equation applied to our geometry. We used thermal insulation boundary conditions for lateral edges, and heat exchange with air for boundary conditions at the top and bottom edges (we used the convective heat transfer coefficient h = 5 W m−2K−1). We imposed temperature continuity as internal boundary conditions. For our simulations we have used the ultimate initial case, i.e. the device is at 273.15 K at t = 0 s except for the Ni heater. The heater was set at 373.15 K at 0 s. Then we simulated the temperature distribution in transient mode with nonsymmetric matrix. Fig. 2(b) shows the time courses of temperatures of the bottom-left of a container nearest from a heater, and the top-center of the microcontainer located 8 μm from the heater which is the furthest distance from the heater used in the experiments. Simulations showed that the temperature difference in these two points was 3.0 °C after 1 ms and 0.25 °C after 2 ms. These values can be neglected in biological experiments. Therefore, the temperature is uniform enough in the experiments conducted at the millisecond time scale. | ||
| Fig. 2 FEM simulation of the temperature homogeneity in transient mode. Part (a) represents the device geometry used for the simulation and the temperature distribution at 0.3 ms. Part (b) represents the temperature at the bottom-left corner as well as the top-center of the microcontainers vs. time. The temperatures of the solution in microcontainers are uniform enough at the millisecond time scale. | ||
3 Materials and methods
3.1 Fluorescent proteins and conditions
Four different kinds of fluorescent proteins were selected because they are popularly used and commercially available; Aequorea coerulescens derived rAcGFP1,21 Aequorea Victoria derived rGFPuv Protein,22 Reef Coral fluorescent proteins rDsRed-Express Protein23 and rHcRed1 Protein24 from Clontech Inc. (hereinafter rAcGFP, rGFPuv, rDsRed and rHcRed, respectively).The proteins were kept in TE buffer (pH 7.4) at 37 nM. The buffer with proteins was poured on a microheater integrated glass plate. Next, a microfabricated PDMS sheet was mounted on to the buffer drop to form microcontainers as we described in the previous report.12 In this experiment, we used 28 fL PDMS microcontainers. In this volume, one microcontainer contains about 600–700 protein molecules.
3.2 Optical setups and experimental methods
The whole sample was put under an inverted microscope IX71 (Olympus). The fluorescent proteins were excited by a mercury lamp. To modulate the light for fluorescent observation, we used corresponding fluorescent mirror units for each different protein; U-MWIB3, U-MWU2, U-MWIG3 and U-MWIY2 (all from Olympus) for rAcGFP, rGFPuv, rDsRed and rHcRed, respectively. We also adapted a filter ND6 to reduce the power of a mercury lamp for the excitation in all the experiments. Hence, bleaching of fluorescence was negligible within a few seconds which is long enough to complete the experiments.The protein shows fluorescence intensity in a microcontainer at room temperature. We induced the energy, which was slightly below that which boils the water, to the microheater. That is to say, in each experiment, the temperatures were raised from room temperature to slightly below 100 °C to observe the quenchings of the fluorescent proteins. Video images were captured by a high speed camera Cascade II: 512 (EMCCD technology) operated at ∼5 ms per frame; this frame rate limits the time resolution in this setup. Fluorescence intensities of the proteins in the microcontainers were analyzed by the image processing software (METAMORF). The shutter of the mercury lamp was opened manually just before switching on the microheater and closed after images were captured. This cycle took a few seconds each time.
4 Results and discussions
When the temperature was raised by switching on the microheater so that the proteins will be denatured, the fluorescence intensity of the protein containing microcontainers was quenched. Fig. 3 shows the time courses of the quenching of red proteins, rDsRed (a) and rHcRed (b). As for red fluorescent proteins, the intensity reduction completed within 2 frames. This means the denaturation completed in 5∼10 ms. On the other hand, the quenching curves of GFPs have rapid fall at the beginning and slow decrease after as shown in Fig. 4 ((a) is for rAcGFP and (b) is for rGFPuv). This suggests that they have two time constants. Quenching speeds vary largely between GFPs and red fluorescent proteins while a little difference could be observed between rAcGFP and rGFPuv. This difference in response time between GFPs and red fluorescent proteins may be due to the strong thermal stability of GFPs.5,7,8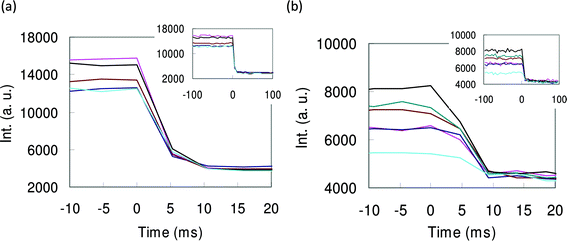 | ||
| Fig. 3 Time courses of fluorescence intensity of red fluorescent proteins in microcontainers. (a) is for rDsRed and (b) is for rHcRed. Group of curves in graph (a) are from 5 individual microcontainers containing the same concentration of rDsRed. Similarly, the group of curves in graph (b) are from 6 individual microcontainers containing the same concentration of rHcRed. Insets show the same data in a longer time range. The fluorescence intensity was quenched as the microheater was switched on at an elapsed time of 0 second. The quenching completed within 5–10 ms. | ||
 | ||
| Fig. 4 Time courses of fluorescence intensity of GFPs in microcontainers. Part (a) is for rAcGFP and part (b) is for rGFPuv. Group of curves in graph (a) are from 5 individual microcontainers containing the same concentration of rAcGFP. Similarly, group of curves in graph (b) are from 6 individual microcontainers containing the same concentration of rGFPuv. The fluorescent intensity of each microcontainer was plotted in line. The average intensity of all the containers is plotted in triangles. The fluorescent intensity quenched when the microheater was switched on at an elapsed time of 0 second. The quenching took longer than in red fluorescent proteins with a bi-exponential curve. | ||
The quenching curves of both rAcGFP and rGFP were fitted by bi-exponential decay. We used the least square method iteration by commercial software (Origin v7: Origin Lab.) to fit the quenching curve of GFPs as shown in Fig. 5 ((a) is for rAcGFP and (b) is for rGFPuv). Time courses of intensities in rAcGFP and rGFPuv were fitted by
y = A1 exp(−x/τ1) + A2 exp(−x/τ2) +y0.
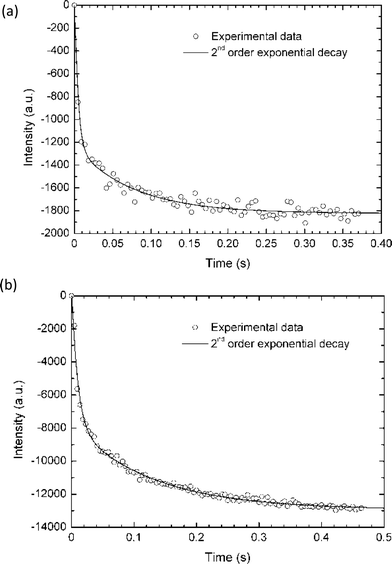 | ||
| Fig. 5 GFPs quenching curves fitted by bi-exponential formula. The raw data of average intensity of all the microcontainers (circle) and bi-exponential fitting curve (continuous line) for rAcGFP (a) and rGFPuv (b). rAcGFP denatured with time constants of 5 ms and 75 ms while rGFPuv denatured with 10 ms and 130 ms. | ||
The fitted parameters for rAcGFP and rGFP are shown in Table 1. Both in rAcGFP and rGFP, τ1 and τ2 showed a big difference (19 and 14 times difference for rAcGFP and rGFPuv, respectively) which supports the fact that the curves have bi-exponential decay. rAcGFP denatured with time constants of 5 ms and 75 ms while rGFPuv denatured with 10 ms and 130 ms. This may suggest that GFPs have two states during their denaturation. The bi-exponential decay may be caused by the reverse process of two states renaturation observed by Ueno et al.4 in which a GFP molecule recovered its fluorescence in around 30 s after being denatured by acid. The difference in the time scale between Ueno et al. and our results may be due to the different speed between denaturation and renaturation. It could also be caused by the difference in the extent of denaturation. The parameter difference between rAcGFP and rGFP may be explained by the difference in the position of mutated amino acids.
| rAcGFP: | rGFPuv: | ||||
|---|---|---|---|---|---|
| R 2 = 0.96968 | R 2 = 0.99167 | ||||
| Parameter | Value | Error | Parameter | Value | Error |
| Y 0 | −1823.60057 | 11.02184 | y 0 | −12938.6833 | 63.43009 |
| A 1 | 1230.87943 | 59.32667 | A 1 | 8118.11719 | 228.16326 |
| τ 1 | 0.00427 | 4.84811 × 10⁻⁴ | τ 1 | 0.00964 | 5.5797 × 10⁻⁴ |
| A 2 | 591.7941 | 36.07947 | A 2 | 5165.24242 | 139.60186 |
| τ 2 | 0.07611 | 0.00824 | τ 2 | 0.12776 | 0.00746 |
This micro-thermodevice can control the temperature and the exposure time to biomaterials down to the millisecond time scale. This system has given the first access to measuring the real-time observation of proteins’ thermal denaturation at the time scale in which those important functions at the molecular level actually happen. The study of thermodynamic properties, such as Gibbs's free energy, at the millisecond time scale will also be possible with this experimental procedure. Furthermore, the device is applicable to other biomaterials such as nucleic acids or proteins. Because the device allows us to perform experiments without any mutations or biochemical treatment to the material itself, it could be used as a general purpose tool for bioresearchers. This microdevice manufactured by microfabrication technologies can be mass produced which facilitates a large number of experiments. The experiments can also be repeated with the same microheater patterned chip by changing PDMS sheets through easy bench top preparation. This compact device allows samples to be analyzed at the point of need which cannot be done with huge equipment. Furthermore, this device can be easily connected to electronic devices for digital sampling or controlling. It also has a potential for on-chip data analysis by integrating an electronic circuit on the same device. Further study with this device may lead to a breakthrough in the field of protein analyses at the molecular level.
5 Conclusions
Real-time observations of the denaturation of fluorescent proteins at the millisecond time scale were performed thanks to the useful characteristics of the microheater and the microcontainer which realize temperature controlling of the target within 2 ms under the microscope. Denaturation speeds of red fluorescent proteins, rDsRed and rHcRed, were shown to be 5–10 ms. Green fluorescent proteins quenched with bi-exponential decay. rAcGFP denatured with time constants of 5 ms and 75 ms while rGFPuv denatured with 10 ms and 130 ms. This may be the reverse process of a two step renaturation of GFP observed in a previous report. Parameter differences between rAcGFP and rGFP may be explained by the difference in the position of mutated amino acids. This experimental approach using this micro-thermodevice is widely applicable to other biomaterials such as nucleic acids or other proteins without any chemical/biochemical modifications to the sample itself. Additional advantages of this microdevice such as mass productivity, compactness, and electrical accessibility can facilitate a large number of experiments even for non-experts in microsystem engineering. We believe that the methodology using this device gives access to biomolecular studies in short time scales and acts as a powerful tool in molecular biology.Acknowledgements
This work was supported by the Japan Society of Promotion of Science (JSPS). We thank Dr C. Yamahata for his help in data analysis. This paper was reviewed and revised while HA was working in J-L. Viovy's group at the Curie Institute, Paris.References
- R. Y. Tsien, Annu. Rev. Biochem., 1998, 67, 509 CrossRef CAS
.
- B. G. Reid and G. C. Flynn, Biochemistry, 1997, 36, 6786–6791 CrossRef CAS
- J. A. Sniegowski, J. W. Lappe, H. N. Patel, H. A. Huffman and R. M. Wachter, J. Biol. Chem., 2005, 280, 26248 CrossRef CAS
- T. Ueno, H. Taguchi, H. Tadakuma, M. Yoshida and T. Funatsu, Mol. Cell, 2004, 14, 423–434 CrossRef CAS
- T. C. Vessoni Penna, M. Ishii, O. Cholewa and L. C. de Souza, Lett. Appl. Microbiol., 2004, 38, 135 CrossRef CAS
- S. H. Bokman and W. W. Ward, Biochem. Biophys. Res. Commun., 1981, 101, 1372 CrossRef CAS
- W. W. Ward and S. H. Bokman, Biochemistry, 1982, 21, 4535 CrossRef CAS
- P. Leiderman, D. Huppert and N. Agmon, Biophys. J., 2006, 90, 1009 CAS
- H. Kato, T. Nishizaka, T. Iga, K. Kinosita, Jr. and S. Ishiwata, Proc. Natl. Acad. Sci. U. S. A., 1999, 99, 9602–9606 CrossRef
- K. Kawaguchi and S. Ishiwata, Cell Motil. Cytoskeleton, 2001, 49, 41–47 CrossRef CAS
- H. Craighead, Nature, 2006, 442, 387–393 CrossRef CAS
- D. R. Reyes, D. Iossifidis, P.-A. Auroux and A. Manz, Anal. Chem., 2002, 74, 2623 CrossRef CAS
- P.-A. Auroux, D. Iossifidis, D. R. Reyes and A. Manz, Anal. Chem., 2002, 74, 2637 CrossRef CAS
- H. F. Arata, Y. Rondelez, H. Noji and H. Fujita, Anal. Chem., 2005, 77, 4810–4814 CrossRef CAS
- H. F. Arata, H. Noji and H. Fujita, Appl. Phys. Lett., 2006, 88, 08392
- F. Gillot, F. O. Morin, H. F. Arata, R. Guegan, H. Tanaka and H. Fujita, Lab Chip, 2007, 7, 1–4 RSC
- Y. Rondelez, G. Tresset, K. V. Tabata, H. Arata, H. Fujita, S. Takeuchi and H. Noji, Nat. Biotechnol., 2005, 23, 361 CrossRef CAS
- Y. Rondelez, G. Tresset, T. Nakashima, Y. Kato-Yamada, H. Fujita, S. Takeuchi and H. Noji, Nature, 2005, 433, 773 CrossRef CAS
- J. C. McDonald and G. M. Whitesides, Acc. Chem. Res., 35, 2002 Search PubMed
- H. F. Arata et al., Sens. Actuators, B, 2006, 117, 339–345 CrossRef
- N. G. Gurskaya, A. F. Fradkov, N. I. Pounkova, D. B. Staroverov, M. E. Bulina, Y. G. Yanushevich, Y. A. Labas, S. A. Lukyanov and K. A. Lukyanov, Biochem. J., 2003, 373, 403–408 CrossRef CAS
- A. Crameri, E. A. Whitehorn, E. Tate and W. P. C. Stemmer, Nat. Biotechnol., 1996, 14, 315–319 CrossRef CAS
- M. V. Matz, A. F. Fradkov, Y. A. Labas, A. P. Savitsky, A. G. Zaraisky, M. L. Markelov and S. A. Lukyanov, Nat. Biotechnol., 1999, 17, 969–973 CrossRef CAS
- N. G. Gurskaya, A. F. Fradkov, A. Terskikh, M. V. Matz, Y. A. Labas, V. I. Martynov, Y. G. Yanushevich, K. A. Lukyanov and S. A. Lukyanov, FEBS Lett., 2001, 507, 16–2 CrossRef CAS
Footnotes |
| † Research fellow of the Japan Society for the Promotion of Science (JSPS), Tokyo, Japan. |
| ‡ LIMMS-CNRS/IIS, France/Japan. |
| This journal is © The Royal Society of Chemistry 2008 |