Nanocomposite membranes as highly selective and sensitive mercury(II) detectors
César
Díez-Gil
ab,
Rosario
Martínez
c,
Imma
Ratera
ab,
Alberto
Tárraga
c,
Pedro
Molina
*c and
Jaume
Veciana
*ab
aInstitut de Ciència de Materials de Barcelona (CSIC)-CIBER-BBN, Campus Universitari, 08193 Bellaterra, Catalonia, Spain. E-mail: vecianaj@icmab.es; Fax: +34 93 5805729; Tel: +34 93 580 1853
bNetworking Research Center on Bioengineering, Biomaterials and Nanomedicine (CIBER-BBN), Barcelona, Spain
cDepartamento de Química Orgánica, Facultad de Química, Universidad de Murcia, Campus de Espinardo, 30100 Murcia, Spain
First published on 13th March 2008
Abstract
A new solid-state membrane filter was prepared by filtering nanoparticles of a fluorophoric mercury(II) detecting molecule dispersed in water through a nanopore size cellulose membrane. By this method, nanoparticles are uniformly coated onto the membrane fibres to form a nanocomposite membrane for selective detection of mercury(II) ions in water allowing trace analysis—down to the ppb level—of this highly toxic metal.
1. Introduction
Mercury is a highly toxic element and its contamination has become severe in some parts of the world, resulting in health damage to their inhabitants.1 Aquatic microorganisms can convert mercury ions into methylmercury, which subsequently bioaccumulates into the adipose tissues of fishes and marine mammals,2 to be later spread out into the nutritional chain affecting, therefore, all the ecosystem. Methylmercury has a high potential neurotoxic activity and is involved in several mercury-pollution-related diseases3 (e.g. prenatal brain damage, cognitive and motion disorders and Minamata disease). As a consequence of such risks mercury(II) ion levels in water are continually monitored by government agencies, and regulatory commissions are dictating increasingly stringent regulations for the maximum permitted limits of mercury ions in water. Thus, the United States Environmental Protection Agency (EPA) has dictated 2 ppb as an acceptable limit for mercury(II) ions in drinking water.1In order to monitor continuously large and disperse water resources, efforts are being made in developing new, cheap, efficient, and selective solid mercury-sensing devices able to measure trace amounts of this heavy metal ion in water. An important number of those devices are based on molecules which can selectively recognize such metal ions and transduce their presence into an output signal, such as a change in the redox property,4 or in their chromogenic5 or fluorogenic6,7 behaviours. Although there are several mercury detecting molecules, the number of those able to detect such an ion when supported on a solid substrate is very limited.8 In addition, most of them have significant short-comings for their real application, such as a lack of selectivity, water insolubility, large structural complexity, and high price. Consequently, the development of practical, selective, sensitive, and reliable solid-state mercury sensors or detectors could represent a great advance for the in situ control of contaminated water, allowing therefore more effective remediation responses. One of the main problems found in this area is the firm fixation of mercury molecular probes on solid substrates. In order to solve this problem different methods such as Langmuir–Blodgett films,9 covalent bonding10 or composite formation have been assayed.11 Nevertheless, severe disadvantages like the lack of sensitivity, the need of auxiliary additives, or complicated synthetic procedures are always found. Another simple procedure to deposit a mercury indicator molecule on a surface is the “dip-coating” method, which consists of soaking a solution of the molecule onto the surface of a solid support and drying the solvent. Although it is the easiest way of supporting molecules on solid substrates, the resulting lack of homogeneity and the ease of leakage of deposited molecules make the devices prepared with this method useless.
Herein we present a novel method for homogeneously supporting a mercury molecular indicator on commercial nanopore size membranes.12 This method consists of the coating of a membrane surface by means of the filtration of an aqueous suspension of nanoparticles of the detecting molecule. Remarkably, this procedure promotes the coalescence of the suspended nanoparticles on the membrane surface yielding a nanocomposite membrane that can be used as a cheap analytical test filter for the highly selective and reliable quantitative detection of Hg2+ in water at concentrations down to the ppb level.
2. Results and discussion
For this study we chose 1-(4′-methoxyphenyl)-4-(1′-pyrenyl)-2,3-diaza-1,3-butadiene 1 as a fluorescent and highly selective mercury molecular probe since it detects mercury ions in aqueous environments (Fig. 1).6 Upon complexation of the unsymmetrical azine 1 with the mercury ions, the lone pair of electrons of the nitrogen atom no longer participates in the quenching process of the fluorophoric pyrenyl group, causing the appearance of an intense fluorescence. Thus, addition of small amounts of Hg2+ ions to a solution of the indicator molecule dramatically increases the excimer emission band at 510 nm (see Fig. 1) and also changes its optical absorption properties.6 Moreover, selectivity studies in solution towards Hg2+ showed no interaction of the compound with several other common mono-, di-, and trivalent ions, like Li+, Na+, K+, Mg2+, Ca2+, Cu2+, Zn2+, Cd2+, Ni2+, Pb2+, Sm3+, Eu3+, Yb3+, and Lu3+.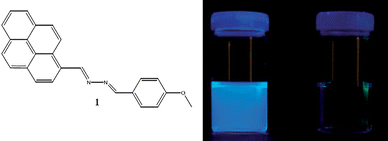 | ||
| Fig. 1 Left: molecular structure of the unsymmetrical azine 1. Right: fluorescence emission from an aqueous solution (CH3CN–H2O, 7 : 3) of the mercury molecular probe 1 with 1 equivalent of Hg2+ and without Hg2+ ions. | ||
The sensitivity and reproducibility of a detecting device based on molecules fixed on solid supports depend on several factors, such as the nature of the indicator molecule, the pathway through which the molecular probe interacts with the mercury ions present in water, the aggregation state of the molecules, the homogeneity and amount of compound deposited on the support, and the area of contact between the molecules and the solution containing the metal ion. Consequently, a key issue for developing a heterogeneous mercury detector with azine 1 is to achieve a firm and uniform coating of this signalling molecule onto an appropriate nanoporous membrane with a large surface area. This was achieved by a simple process that uses the “reprecipitation method”13 for preparing aqueous nanodispersions of solid azine 1 and their deposition on the surface of a commercial membrane with ca. 100 nm pore size by filtering the suspensions through the membrane.
2.1 Prepartion of nanoparticles of the probe molecule
In order to control the homogeneity and the loading of azine 1 on the membranes, the use of nanoparticles with average diameters similar to those of the membrane pores was critical. It is important to mention here that the matching of pore sizes with the particle sizes, as well as the narrow polydispersity of the suspensions, played a key role in maximizing the loading of the membrane with the mercury detecting probe, as well as in attaining more homogeneous coatings. Particles with such characteristics allowed a deeper penetration of the indicator into the membrane, avoiding, at the same time, the clogging of the membrane pores. Consequently, the first goal was to find the experimental conditions to obtain particles of azine 1 with ca. 100 nm average diameters. Since sizes and size distributions of particles obtained with the reprecipitation method usually depend on external factors such as temperature, nature of the water-miscible organic solvent and the mixing efficiency of solvents,14 these variables were tested by choosing two different water-miscible solvents and two distinct mixing procedures. Thus, nanoparticles suspended in water were obtained by dropping 100 μl of 10−3 M organic solutions (in THF or NMP) of azine 1 onto 10 ml of vigorously mixed ultra-pure water at a fixed temperature. Results and conditions of some representative experiments for obtaining aqueous suspensions of 1 are given in Table 1, entries 1–8.| Entry | Solv.a | Mix. cond. | T/K | Particle diameter/nmb | ZP/mVd | |||
|---|---|---|---|---|---|---|---|---|
| Stirr. | Sonic. | 10% | 50%c | 90% | ||||
| a NMP, N-methylpyrrolidone; THF, tetrahydrofuran. b Volumetric particle size distributions, measured with dynamic light scattering technique are given as 10, 50, and 90% quantiles. c Values corresponding to the medians of the particle size distributions. d Z-potential values. | ||||||||
| 1 | NMP | Yes | No | 298 | 91 | 171 | 342 | −20 |
| 2 | THF | Yes | No | 298 | 91 | 249 | 825 | −19 |
| 3 | NMP | Yes | No | 273 | 44 | 78 | 164 | −14 |
| 4 | THF | Yes | No | 273 | 68 | 111 | 190 | −22 |
| 5 | NMP | No | Yes | 298 | 91 | 222 | 295 | −11 |
| 6 | THF | No | Yes | 298 | 142 | 267 | 342 | −18 |
| 7 | NMP | No | Yes | 273 | 68 | 106 | 164 | −25 |
| 8 | THF | No | Yes | 273 | 68 | 136 | 255 | −21 |
Dynamic light scattering (DLS) measurements of the obtained particle suspensions showed particle sizes between 80 and 250 nm with low polydispersities, the exact values of which depended on the conditions used for their preparation. Table 1 shows that lowering the temperature of the reprecipitation experiment promotes smaller particle sizes. This effect was also observed when the organic solvent was changed, obtaining smaller particle sizes for NMP than for THF. To check the influence of the mixing method of water and the organic solution of azine 1, sonication and mechanical stirring were used. As is shown in Table 1, the particle sizes obtained with sonication are much larger than with mechanical stirring. Therefore, the latter procedure turns out to be much more efficient for mixing the two solutions, leading thereby to a faster nucleation process due to the antisolvent effect of water, where the azine 1 is not soluble. Z-Potential measurements were also performed for all obtained suspensions. In all cases, the absolute value obtained for Z-potentials was lower than 30 mV, which is indicative of the formation of unstable particle suspensions in water with a high tendency to aggregate with time.
2.2 Nanocomposite membranes loaded with azine 1
To achieve and maximize the loading of molecular probe inside the membrane, nanoparticle suspensions of azine 1 with ca. 100 nm mean sizes (entry 4, Table 1) were filtered through 100 nm pore size commercial membranes of different nature; i.e., polycarbonate, nylon, polyester and mixed cellulose ester. Fig. 2 shows SEM images of the polycarbonate and mixed cellulose ester membranes coated with the molecular probe 1. It is clear from Fig. 2a that particles of azine 1 were deposited on the top of the polycarbonate membrane as plate-like structures without any well-defined shapes, showing mean sizes that noticeably exceed those observed by the DLS technique. This result can be explained by the coalescence of the nanoparticles into larger plate-like particles instead of isolated deposition on the surface of the polycarbonate fibers. The tendency of such nanoparticles to aggregate during the filtration process is in good agreement with the low Z-potential values measured for their suspensions (≤30 mV in all cases; Table 1) and could probably be due to the lack of electrostatic repulsions between the particles. It is worth mentioning that most of filtered particles of the probe 1 were retained in the membrane since no particles were detected in the filtered water. Similar results were also obtained using other commercial 100 nm pore size synthetic membranes made of nylon and polyester. Coatings with characteristics very similar to those of the polycarbonate membrane were obtained, since all these synthetic organic membranes have similar morphological features, such as flat top surfaces. However, the coating process was considerably improved with a 100 nm pore size mixed cellulose ester membrane, because in this fibrillar membrane the filtered nanoparticles were retained in the membrane, not only by coalescing between them on the top of the membrane, but also around the cellulose fibers inside the membrane, as revealed by Fig. 2c.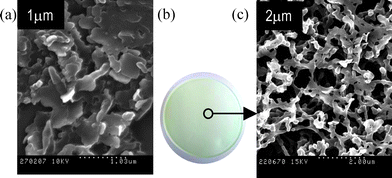 | ||
| Fig. 2 (a) SEM image of a polycarbonate membrane surface after filtering a suspension of nanoparticles (entry 4, Table 1). (b) Photograph of a mixed cellulose ester membrane loaded by filtering a suspension of nanoparticles of 1 (entry 4, Table 1), showing an homogeneous light-green coloured surface due to the uniform distribution of the mercury indicator. (c) SEM image of a mixed cellulose ester membrane loaded with 1, showing the high homogeneity of the coating of the fibres of cellulose. | ||
Consequently, the deeper penetration of the nanoparticles into the pores yields a more efficient loading of the membrane, both at the top of its surface and inside, without blocking the pores of the filter, as occurs with the synthetic organic membranes. In addition, this loading procedure made it possible to get a more homogeneous coverage of the membrane. In order to study the influence of the amount of filtered nanoparticles through the membrane, increasing amounts of nanoparticle suspensions on a mixed cellulose ester membrane were filtered. Thus, 5, 10, 20 and 25 ml of a nanoparticle suspension of the indicator, prepared as previously described (entry 4, Table 1), were filtered through a mixed cellulose ester membrane with 100 nm pore size. SEM images (Fig. 3) show significant variations from an almost non-covered surface to a partially shuttered membrane, as the quantity of filtered nanoparticles was increased. The increase of the amount of filtered particles entailed an increase of the loading of the molecules that coat the membrane without blocking the pores. In highly loaded membranes the nanoparticles coalesce on the top of the membrane forming clearly visible plates as well as inside the membrane around its fibres (vide infra).
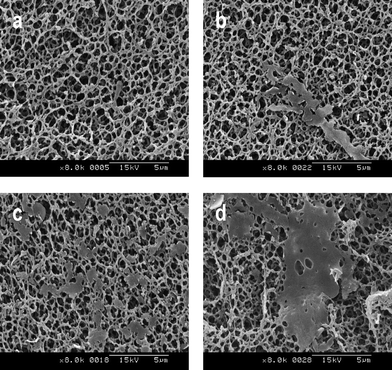 | ||
| Fig. 3 SEM images of mixed cellulose ester membranes after filtering increasing amounts of nanoparticle suspension. Images a, b, c and d correspond, respectively, to the filtration of 5, 10, 20 and 25 ml of nanoparticle suspensions of the detecting molecule (entry 4, Table 1). | ||
2.3 Hg2+ binding ability of nanocomposite membranes
An in-depth study of the binding ability of azine 1 to Hg2+ ions when the molecular probe is coating the fibres of the cellulose membrane, as well as the level of penetration of the detecting molecule inside the membrane, was undertaken by SEM imaging with mercury energy dispersive X-ray (EDX) analysis. This study was performed after filtering 10 ml of a 10−2 M Hg(ClO4)2 aqueous solution through the coated membrane, prepared by filtering 30 ml of nanoparticle suspension (entry 4, Table 1). The cross-sectional SEM image (see Fig. 4) indicate that solid azine 1 is able to complex Hg2+ ions from water and that the thickness of the layer where the mercury indicator is fixed is around 10 μm, as shown by the mercury peak of the EDX analysis. Thus, the composite membrane shows a remarkably concentrated region located at its surface containing the molecular probe 1. Moreover, the layer of such molecules was firmly anchored to the membrane since it was not easy to remove from the membrane either by rubbing or by immersion in water, as revealed by optical microscopy and SEM. EDX analysis of a cellulose membrane loaded with solid azine 1 by means of the dip-coating technique is also shown in Fig. 4 for comparison purposes. It is clear from Fig. 4 that there was a much higher mercury signal on the top of the membrane prepared by nanoparticle filtration compared to the dip-coated one. The latter membrane showed only a slight increase of the mercury signal along all the cross section, with slightly more intensity on the top and the bottom of the membrane. In addition, the line profile for the dip-coated membrane showed a mercury signal 200 times smaller than that obtained by nanoparticle filtration, which implies a poorer efficiency of the former method for coating the cellulose fibres.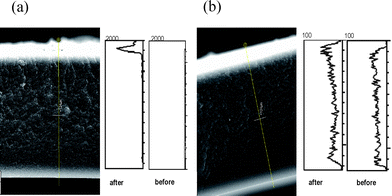 | ||
| Fig. 4 Cross section image and SEM EDX images: (a) of a coated cellulose membrane with nanoparticle suspension of 1 after and before filtering 10 ml of 10−2 M mercury(II) aqueous solution and (b) of a dip-coated cellulose membrane with 1 after and before the treatment with a 10−2 M mercury(II) aqueous solution. | ||
Once the complexing ability of a mixed cellulose ester membrane coated with the probe 1 to Hg2+ ions in water was confirmed, the efficiency of these solid-state devices as potential mercury detectors was evaluated. For such a study, 100 ml of aqueous solutions with different concentrations of mercury(II) ions were filtered through the coated membranes. The interaction of the covering layer and the mercury ions should produce a change in the fluorogenic properties of the detector proportional to the concentration of mercury salt in each of the aqueous solutions. The luminescence of membranes was measured with a stereomicroscope, using an excitation wavelength of 360 nm and reading the emission at 420 nm. A digital camera was adapted for imaging the luminescence responses coming from the surfaces. Indeed, the resulting total luminescence of the membranes increased upon increasing of the concentration of mercury ions present in the analysed water (see Fig. 5), and a detection of mercury concentrations ranging from 1.0 × 10⁻⁸ M to 2.0 × 10⁻³ M was possible.
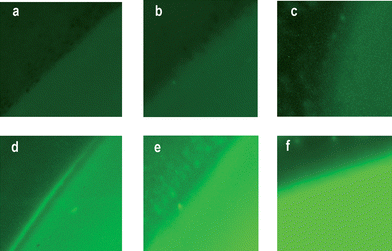 | ||
| Fig. 5 Representative optical microscope fluorescence images of the contours of sensing membranes after filtration of 100 ml of aqueous solutions with concentrations of: (a) 0 M, (b) 10−6 M, (c) 10−5 M, (d) 10−4 M, (e) 10−3 M, and (f) 10−2 M of mercury(II) ions. | ||
The total luminescence intensities measured for each assayed concentration were used to calibrate the response of the membranes to Hg2+ ions. Calibration curves in two different concentration ranges of mercury(II) ions were performed (Fig. 6).
![Calibration curves of the luminescence responses to Hg2+ ions of sensing membranes after filtering 100 ml of aqueous mercury solutions with [Hg(ClO4)2] concentrations between (a) 1.0 × 10⁻⁵ M and 1.0 × 10⁻⁸ M and (b) between 2.0 × 10⁻³ M and 1.0 × 10⁻⁵ M.](/image/article/2008/JM/b800708j/b800708j-f6.gif) | ||
| Fig. 6 Calibration curves of the luminescence responses to Hg2+ ions of sensing membranes after filtering 100 ml of aqueous mercury solutions with [Hg(ClO4)2] concentrations between (a) 1.0 × 10⁻⁵ M and 1.0 × 10⁻⁸ M and (b) between 2.0 × 10⁻³ M and 1.0 × 10⁻⁵ M. | ||
Linearity of the luminescence responses with respect log[Hg2 +] were found for both concentration ranges, although the standard deviations were somewhat larger for the lower concentration range. Remarkable is the detection limit of 2 ppb of Hg2+ reached in these quantitative measurements. This amount matches the limit of mercury content of drinking water allowed by the EPA.1 Even more outstanding is the fact that this lower limit can be decreased considerably by filtering two- or five-fold amounts of mercury solutions reaching limits well below 2 ppb of mercury ions in water.
2.4 Selective detection of aqueous mercury(II) ions
Although selectivity studies previously made in CH3CN–H2O solutions showed no interaction of the probe molecule 1 with other cations normally present in drinking water,6 further experiments were also carried out to confirm the absence of interference of other cations in the response of the cellulose-based detecting probes to mercury(II) ions. For this purpose 10 ml of 10−2 M aqueous solutions of salts of Na(I), K(I), Li(I), Mg(II), Ca(II), Ni(II), Zn(II), Cu(II), Cd(II), Co(II), Pb(II), Al(III), Cr(III) and also a mixture of all of them and tap water were filtered through the composite membrane. The luminescence intensity measurements of each assay are shown in Fig. 7, together with the resulting measurements after filtering different solutions with much lower concentrations (10 mL of 10−4 M solutions) of mercury(II) ions using different mercury salts to see if there was any influence of the counteranions (chloride, acetate, triflate, and perchlorate). Although the concentrations of all tested cations were 100 times higher than those of Hg2+, no significant increase of fluorescence signals was detected, proving the high selectivity of the developed mercury probe coated onto the membrane.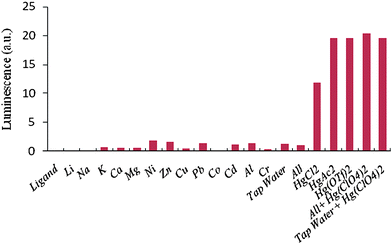 | ||
| Fig. 7 Luminescence intensity measurements on the cellulose-based detecting membranes after filtering 10 ml of 10−2 M solutions of Li (I), Na(I), K(I), Ca(II), Mg(II), Ni(II), Zn(II), Cu(II), Pb(II), Cd(II), Co(II), Al(III), Cr(III) metallic salts. The influence of the counteranions of mercury(II) salts was also tested by filtering 10−4 M aqueous solutions of different mercury(II) salts. | ||
3. Conclusions
In conclusion, it has been demonstrated that the filtration of water-suspended nanoparticles of azine 1 through a nanoporous cellulose-based membrane provides a nanocomposite membrane that can be used as an analytical quantitative sensor able to selectively detect by fluorescence mercury(II) ions in water with a high sensitivity down to the ppb trace level. This practical, reliable, selective, and sensitive solid-state mercury detecting probe may represent a great advance for the in situdetection of contaminated water. Adaptation of the method herein reported to produce mercury sequestering materials that can be used as filters for remediation of contaminated water resources is in progress. It is possible to conclude that the results here described fill a void in the field of detection of mercury(II) ions in water that may provide advantageous for our environment.4. Experimental
4.1 Nanocomposite membrane preparation
Nanoparticles were prepared by the reprecipitation method.14 100 μl of a 10−3 M THF or NMP solution of the mercury indicator molecule 1 were slowly dropped into 10 ml of vigorously stirred ultra-pure water. The antisolvent water effect, together with the miscibility of the tetrahydrofuran in water and the strong stirring, make possible the generation of the nanoparticle suspension. The coated membranes were prepared by vacuum filtering three times, at a flux of 35 ml min−1, 10 ml of nanoparticle suspension of mercury detecting probe 1 (entry 4, Table 1) through a mixed cellulose ester (Advantec, Ø = 47 mm, 0.1 μm pore) yielding a final load of 2.4 × 10⁻⁸ mol cm−2 of molecular probe on the surfaces that were left to air dry.4.2 Particle size studies
Particle size studies of the nanoparticles were performed using dynamic light scattering (DLS) (Malvern Nanosizer S). DLS measurements were performed at 25 °C using 1 ml of freshly prepared nanoparticle suspension (Table 1) into a disposable plastic cuvette. The temperature of the stirred water was maintained constant at 273 or 298 K with an external thermostatic bath.4.3 Scanning electron microscopy
Imaging of coated membranes with mercury molecular probe 1 was performed using a scanning electron microscope (Hitachi S-570). Freshly prepared stripes were cut and metallised with gold for 3 minutes with a K550 Sputter Coater K250 Carbon Coating Attachment (Emitech, Ashford, U.K.) before the experiment was done.4.4 Energy dispersive X-ray analysis composition studies
Cross section imaging and qualitative mercury(II) detection of coated membranes with mercury molecular probe 1 were carried out on a scanning electron microscope JEOL JSM-6300 (JEOL LDT, Tokyo, Japan) with a dispersive energy spectrometer EDX-LINK ISIS 200 (Oxford Instruments, Bucks, England). Freshly prepared stripes were cut and metallised with gold for 3 minutes with a K550 Sputter Coater K250 Carbon Coating Attachment (Emitech, Ashford, U.K.) before the experiment was done.4.5 Dip coated membrane preparation
0.1 μm pore and 47 mm Ø (Advantec) mixed cellulose ester membranes were dipped for 10 seconds into a 1 mM dichloromethane solution of azine 1 and subsequently air dried. The freshly prepared indicator membranes were soaked in aqueous solutions of different concentrations (10−6 M to 10−3 M) of mercury(II) perchlorate and also air dried.4.6 Luminescence measurements
Aqueous solutions of different concentrations (2.0 × 10⁻³ M and 1.0 × 10⁻⁸ M) of mercury perchlorate were vacuum filtered, at a flux of 35 ml min−1, through the mercury molecular probe 1coated membranes. Luminescence measurements were performed using a commercial luminescence stereomicroscope (Leica MLZIII) with an incorporated CCD digital camera (Leica DC 250). Images were then software treated (Metamorph)15 acquiring thus the total luminescence intensity data from the images.4.7 Selectivity measurements
10 ml of 10−2 M Na(I), K(I), Li(I), Mg(II), Ca(II), Ni(II), Zn(II), Cu(II), Cd(II), Co(II), Pb(II), Al(III), Cr(III) aqueous solutions were filtered through different membranes loaded with 30 ml of the mercury molecular probe 1nanoparticle suspension (entry 4, Table 1), at a flux of 35 ml min−1, and left to air dry. Luminescence studies of the resulting treated membranes were carried out as explained in Section 4.6. Moreover, 10 ml of 10−4 M of different mercury salts were used as positive tests.Acknowledgements
This work was supported in part by the Ministerio de Educación y Ciencia (Spain), through the Consolider-C project EMOCIONa (CTQ2006-06333/BQU) and CTQ 2004-02201 project, the European Science Foundation EUROCORES Programme SONS (project Fun-Smarts-2), the Generalitat de Catalunya (2005SGR00362), Fundación Séneca (CARM) (02970/PI/05), and the Instituto de Salud Carlos III, through “Acciones CIBER”. I.R. is grateful to Ministerio Educación y Ciencia for a “Ramón y Cajal” contract.References
- R. P. Mason, W. F. Fitzgerald and F. M. M. Morel, Geochim. Cosmochim. Acta, 1994, 58, 3191 CrossRef CAS; United States Environmental Protection Agency Roadmap for Mercury, 2006, EPA-HQ-OPPT-2005-0013 Search PubMed.
- D. W. Boening, Chemosphere, 2000, 40, 1335 CrossRef CAS; H. H. Harris, I. J. Pickering and G. N. George, Science, 2003, 301, 1203 CrossRef CAS; S. Jensen and A. Jernelov, Nature, 1969, 223, 753 CAS.
- P. Grandjean, P. Weihe, R. F. White, F. Debes, S. Araki, K. Yokohama, K. Murata, N. Sorensen, R. Dahl and P. J. Jorgensen, Neurotoxicol. Teratol., 1997, 19, 417 CrossRef CAS; S. de Flora, C. Bennicelli and M. Bagnasco, Mutat. Res., 1994, 317, 57 CAS; P. B. Tchounwou, W. K. Ayensu, N. Ninashvili and D. Sutton, Environ. Toxicol., 2003, 18, 149 CrossRef CAS; N. J. Langford and R. E. Ferner, J. Hum. Hypertens., 1999, 13, 651 CrossRef CAS.
- S. S. M. Hassan, M. B. Saleh, A. A. A. Gaber, R. A. H. Mekheimer and N. A. A. Kream, Talanta, 2000, 53, 285 CrossRef CAS; M. H. Mashhadizadeh and I. Sheikhshoaie, Talanta, 2003, 60, 73 CrossRef CAS.
- E. Coronado, J. R. Galán-Mascarós, C. Martí-Gastaldo, E. Palomares, J. R. Durrant, R. Vilar, M. Gratzel and Md. K. Nazeeruddin, J. Am. Chem. Soc., 2005, 127, 12351 CrossRef CAS; S. Tatay, P. Gavina, E. Coronado and E. Palomares, Org. Lett., 2006, 8, 3857 CrossRef CAS; S. Y. Moon, N. R Cha, Y. H. Kim and S. K. Chang, J. Org. Chem., 2004, 69, 181 CrossRef CAS; J. V. Ros-Lis, R. Martinez-Manez, K. Rurack, F. Sancenon, J. Soto and M. Spieles, Inorg. Chem., 2004, 43, 5183 CrossRef CAS; L. Jae-Seung, H. Min Su and C. A. Mirkin, Angew. Chem., Int. Ed., 2007, 46, 4093 CrossRef CAS; D. E. Wylie, L. D. Carlson, R. Carlson, F. W. Wagner and S. M. Schuster, Anal. Biochem., 1991, 194, 381 CAS.
- A. Caballero, R. Martínez, V. Lloveras, I. Ratera, J. Vidal-Gancedo, K. Wurst, A. Tárraga, P. Molina and J. Veciana, J. Am. Chem. Soc., 2005, 127, 15666 CrossRef CAS.
- L. Prodi, C. Bargossi, M. Montaltí, N. Zaccheroni, N. Su, J. S. Bradshaw, R. M. Izatt and P. B. Savage, J. Am. Chem. Soc., 2000, 122, 6769 CrossRef CAS; S. Yoon, A. E. Albers, A. P. Wong and C. J. Chang, J. Am. Chem. Soc., 2005, 127, 16030 CrossRef CAS; E. M. Nolan and S. J. Lippard, J. Am. Chem. Soc., 2003, 125, 14270 CrossRef CAS; Y. Zhao and Z. Zhong, J. Am. Chem. Soc., 2006, 128, 9988 CrossRef CAS; A. Ono and H. Togashi, Angew. Chem., Int. Ed., 2004, 43, 4300 CrossRef CAS; S. H Kim, J. S. Kim, S. M. Park and S. K. Chang, Org. Lett., 2006, 8, 371 CrossRef CAS; K. C. Song, J. S. Kim, S. M. Park, K. C. Chung, S. Ahn and S. K. Chang, Org. Lett., 2006, 8, 3413 CrossRef CAS; J. Wang, X. Qian and J. Cui, J. Org. Chem., 2006, 71, 4308 CrossRef CAS; Y. Tang, M. Yu, F. Feng, L. An, H. Sun, S. Wang, Y. Li and D. Zhu, Macromol. Rapid Commun., 2006, 27, 389 CrossRef CAS; E. M. Nolan and S. J. Lippard, J. Mater. Chem., 2005, 15, 2778 RSC; E. M. Nolan, M. E. Racine and S. J. Lippard, Inorg. Chem., 2006, 45, 2742 CrossRef CAS; Y. Yu, L. R. Lin, K. B. Yang, X. Zhong, R. B. Huang and L. S. Zheng, Talanta, 2006, 69, 103 CrossRef CAS; O. Selifonova, R. Burlage and T. Barkay, Appl. Environ. Microbiol., 1993, 59, 3083 CAS; Z. G. Can-Cheng, L. Zhi-Zhang, S. Guo-Li and Y. Ru-Qin, Anal. Chem., 2002, 74, 821 CrossRef CAS; M. Matsushita, M. M. Meijler, P. Wirsching, R. A. Lerner and K. D. Janda, Org. Lett., 2005, 7, 4943 CrossRef CAS.
- I. Oehme and O. S. Wolfbeis, Microchim. Acta, 1997, 126, 177 CAS; Z. Xiao-Bing, G. Can-Cheng, L. Zhi-Zhang, S. Guo-Li and Y. Ru-Qin, Anal. Chem., 2002, 74, 821 CrossRef CAS; I. Murkovic and O. S. Wolfbeis, Sens. Actuators, B, 1997, 38–39, 246 CrossRef; M. K. Nazeeruddin, D. Di Censo, R. Humphry-Baker and M. Grätzel, Adv. Funct. Mater., 2006, 16, 189 CrossRef CAS; G. Orellana, A. M. Gómez-Carneros, C. de Dios, A. A. Garcia-Martínez and M. C. Moreno-Bondi, Anal. Chem., 1995, 67, 2231 CrossRef CAS; C. Díez-Gil, A. Caballero, I. Ratera, A. Tárraga, P. Molina and J. Veciana, Sensors, 2007, 7, 3481 Search PubMed.
- G. Caminati, E. Margheri and G. Gabrielli, Thin Solid Films, 1994, 244, 905 CrossRef CAS; Y. Zheng, J. Orbulescu, X. Ji, M. F. Andreopoulos, M. S. Pham and M. R. Leblanc, J. Am. Chem. Soc., 2003, 125, 2680 CrossRef CAS.
- N. M. Hanumegowda, I. M. White and F. Xudong, Sens. Actuators, B, 2006, 120, 207 CrossRef; T. Balaji, M. Sasidharan and H. Matsunaga, Analyst, 2005, 130, 1162 RSC; A. A. Ensafi and M. Fouladgar, Sens. Actuators, B, 2006, 113, 88 CrossRef; Y. Tang, F. He, M. Yu, F. Feng, L. An, H. Sun, Y. Li and D. Zhu, Macromol. Rapid Commun., 2006, 27, 389 CrossRef CAS.
- H. M. Rowe, W. Y. Xu, J. N. Demas and B. A. DeGraff, Appl. Spectrosc., 2002, 56, 167 CrossRef CAS; H. Chun-Lian, R. Feng-Lian, Z. Xiao-Bing and H. Zhi-Xiang, Talanta, 2006, 70, 364 CrossRef CAS; L. Soo-Hyoung, J. Kumar and S. K. Tripathy, Langmuir, 2000, 16, 10482 CrossRef CAS; N. A. Gavrilenko, N. V. Saranchina and G. M. Mokrousov, J. Anal. Chem., 2007, 62, 923; N. L. Dias-Filho and D. Ribeirio-do-Carmo, Talanta, 2006, 68, 919 CrossRef CAS; X. Liu, Y. Tang, L. Wang, J. Zhang, S. Song, C. Fan and S. Wang, Adv. Mater., 2007, 19, 1471 CrossRef CAS; M. K. Nazeeruddin, D. di-Censo, R. Humphry-Baker and M. Grätzel, Adv. Funct. Mater., 2006, 16, 189 CrossRef CAS; C. Cano-Raya, M. Dm Dernández-Ramos, J. Gómez-Sánchez and L. F. Capitán-Vallvey, Sens. Actuators, B, 2006, 117, 135 CrossRef.
- J. Veciana, I. Ratera, C. Díez-Gil, P. Molina, A. Tárraga, R. Martínez, A. Caballero, F. Zapata, Spanish Patent, ES 200603285, 2006 Search PubMed.
- F. Hong-Bing and Y. Jian-Nian, J. Am. Chem. Soc., 2001, 123, 1434 CrossRef CAS; H. S. Nalwa, H. Kasai, S. Okada, H. Oikawa, H. Matsuda, A. Kakuta, A. Mukoh and H. Nakanishi, Adv. Mater., 1993, 5, 758; E. Van Keuren, E. Georgieva and J. Adrian, Nano Lett., 2001, 1, 141 CrossRef CAS.
- Y. Zheng, J. Orbulescu, X. Ji, M. F. Andreopoulos, M. S. Pham and M. R. Leblanc, J. Am. Chem. Soc., 2003, 125, 2680 CrossRef CAS; Y. Takahashi, H. Kasai, H. Nakanishi and T. M. Suzuki, Angew. Chem., Int. Ed., 2006, 45, 913 CrossRef CAS; H. Kasai, H. S. Nalwa, S. Oikawa, H. Matsuda, N. Minami, A. Kakuta, K. Ono, A. Muco and H. Nakanishi, Jpn. J. Appl. Phys., 1992, 31, 1132.
- Image analysis software: Metamorph 7.5, Universal Imaging, 2007 Search PubMed.
| This journal is © The Royal Society of Chemistry 2008 |
