Interactions between protein and porphyrin-containing cyclodextrin supramolecular system: a fluorescent sensing approach for albumin†
Liping
Long
ac,
Jian Yu
Jin
a,
Ying
Zhang
a,
Ronghua
Yang
*ab and
Keming
Wang
b
aBeijing National Laboratory for Molecular Sciences, College of Chemistry and Molecular Engineering, Peking University, Beijing, 100871, China. E-mail: Yangrh@pku.edu.cn; Fax: +86-10-62751708
bState Key Lab of Chemo/Biosensing and Chemometrics, College of Chemistry and Chemical Engineering, Hunan University, Changsha, 410082, China
cDepartment of Chemistry and Environment Engineering, Hunan City University, Hunan, Yiyang 413500, China
First published on 28th July 2008
Abstract
The interactions of meso-tetraphenylporphyrin (TPP), meso-tetraphenylporphyrin cobalt(II) (CoTPP) and protein in the presence of a cyclodextrin derivative, heptakis(2,6-di-O-n-octyl)-β-cyclodextrin (Oc-β-CD), have been investigated. In the presence of Oc-β-CD, significant increase of TPP fluorescence was realized, but the increased fluorescence was quenched by CoTPP. To further investigate the fluorescence-quenched system and explore its potential application in bioanalysis, a strategy has been devised to restore the quenching fluorescence of TPP upon interacting with protein. The restoration of TPP fluorescence in the present system is fast and accomplished upon interaction with bovine serum albumin (BSA) or human serum albumin (HSA). On the basis of the spectroscopic measurement and excited state fluorescence lifetime, the mechanism of TPP fluorescence quenching is attributed to formation of a ground-state complex of TPP and CoTPP, and the fluorescence restoration is attributed to the binding of CoTPP with the protein molecule which destroys the aggregate, releasing the free base porphyrin. With optimized conditions, the calibration equations are linear from 0.80 to 75.4 μg mL−1 BSA and from 3.20 to 93.2 μg mL−1 HSA. The corresponding detection limits are 0.32 μg mL−1 for BSA and 1.06 μg mL−1 for HSA, respectively. The method was used for the direct assay of HSA content in human serum. The result is comparable to that obtained by another method. The recovery from BSA in synthetic sample is also satisfactory.
Introduction
The design of artificial molecular sensors which show high affinity and good selectivity for biological molecules has received considerable attention in recent years. Of the various optical molecular sensors, fluorescent sensors are extremely attractive due to the advantages of high sensitivity and easy operation.1,2 In general, a fluorescent sensory molecule would involve the covalent or non-covalent linking of a receptor domain to a fluorescent signaling unit, binding of the receptor with an analyte causes changes of the fluorescence property of the signaling unit. One of the most important recognition elements for biological molecules involves the specific metal–ligand interactions;3,4 of which metalloporphyrins are attractive candidates in light of the high binding affinity of the metalloporphyrin with biological molecules, such as amino acids and proteins.5,6 The free-base porphyrin, on the other hand, such as meso-tetraphenylporphytin (TPP), fluoresces due to the conjugated double bond system and the high mobility of its π-electrons of the molecular backbone.The non-covalent interactions of free-base porphyrin and metalloporphyrin are of interest in view of their roles in chemical or biological systems. The fluorescence from the excited state of a free-base porphyrin is quenched by nearby metallic coordination complexes. An increasing number of reports using the non-covalent interactions have been focused on the construction of a donor–acceptor supramolecular architecture and the investigation of the electron transfer process.7,8 We noticed, however, that there have been a few cases dealing with the quenched fluorescence to be employed as fluorescence sensing approaches.9,10 With this in mind, our goal is to investigate whether the quenched fluorescence of a free-base porphyrin can be restored; and if so, this fluorescence recovery may be exploited as a fluorescent sensor for biological molecules.
Cyclodextrins (CDs) are cyclic oligomers of α-linked D-glucopyranose formed by six, seven or eight glucose units (α-CD, β-CD, or γ-CD). The prime feature of CDs is that the molecule has a hydrophobic cavity and a hydrophilic surface, thus it possess the ability to form inclusion complexes with a variety of hydrophobic guests so that the guests are soluble in water.11 Upon inclusion of a fluorophore, CDs offer a more protective microenvironment and generally enhance the fluorescence of the fluorophore by shielding the excited species from quenching and non-radiative decay processes that occur in aqueous solution.12 The inclusion of a porphyrin molecule inside the cavity of β-CD has been well studied.13,14 In our previous experiments, we found that in aqueous solution the fluorescence of TPP was greatly increased by alkylated β-CD derivatives due to the formation of an inclusion complex of the cyclodextrin and porphyrin.15,16 In our further investigation, we found the enhanced fluorescence of TPP was seriously quenched by metalloporphyrin; moreover, this quenched fluorescence could be recovered by some protein molecules. We report here our intrinsic study on the interaction of TPP and metalloporphyrins in the presence of an alkylated β-cyclodextrin derivative, heptakis(2,6-di-O-n-octyl)-β-cyclodextrin (Oc-β-CD) (Fig. 1), to develop an efficient fluorescence enhancement-based sensor for bovine serum albumin (BSA) and human serum albumin (HSA). Compared to the known molecular sensors for albumin which involves the covalent linking of a receptor domain to a fluorescent signaling unit,2,17,18 our proposed approach possesses some remarkable features: first, the metalloporphyrins were used as the receptor and TPP acted as a signaling unit, which does not require establishing any covalent linking between the fluorophore and the receptor but utilizes the fluorophore and receptor as such. More important, due to the specific metal–ligandation between albumin and meso-tetraphenylporphyrin cobalt(II) (CoTPP), the approach shows remarkably selective fluorescence enhancement by BSA or HSA.
 | ||
| Fig. 1 Molecular structures of β-cyclodextrin derivatives (A) and the porphyrin complexes (B). | ||
Experimental
Materials and apparatus
All proteins and amino acids were purchased from Huamei Biological Engineering Co. (Beijing, China). Stock solutions of the samples were prepared by directly dissolving the materials in 0.01 mol L−1NaCl and stored in a refrigerator at 4 °C. Standard protein solutions were prepared by serial dilution starting with 0.05 mol L−1 phosphate buffer (pH 7.4). The sodium salts of all kinds of anions were of analytical-grade. All salt solutions were prepared by doubly distilled water.β-CD was purchased from Sigma Chemical Co. (St. Louis, Mo, USA), it was dried in vacuo at 120 °C for 6 h before being used. Oc-β-CD was synthesized from the treated β-CD and n-octyl bromine (A.R., obtained from Sigma Chemical Co.) and anhydrous dimethylsulfoxide (DMSO), the synthesized compound was verified by using IR and1HNMR.19TPP was prepared according to the method of Alder et al.20 Metalloporphyrins were prepared by treating the chloroform solution of TPP and salt acetate in glacial acid for about 2 h,21 and then the organic layer was refined by chromatography using the silica gel column. The porphyrin compounds were identified by UV/vis, IR, and elemental analysis. β-CD stock solution was obtained by dissolving it in water. The 2 × 10⁻³ mol L−1Oc-β-CD stock solution was prepared by dissolving an appropriate amount of the material in 10 mL of tetrahydrofuran (THF). The porphyrin stock solutions were made in THF. The concentrations of the porphyrins were determined by spectrophoto-metrically by using Beer's law and the corresponding absorptivity values.22 Under 2.0 × 10⁻⁶ mol L−1, the TPP absorption values increased as the porphyrin concentration increased, indicating there were no aggregations of TPP, which is in agreement with those obtained by other methods.23,24 In the following study, the concentrations of TPP below this critical concentration were used.
All fluorescence measurements were performed on a Hitachi F-4500 spectrophotometer (Tokyo, Japan) with a quartz cell (1.0 × 1.0 cm2 cross section). Absorption spectra were obtained with a Shinadzu UV-1601 spectrophotometer (Tokyo, Japan). Fluorescence lifetime measurements were carried out on Edinburgh Instruments FLS 920 (UK). Measurements of pH were carried out with a PHS-3C pH meter (Shanghai Third Analytical Instrument Co., Shanghai, China).
Preparation of TPP fluorescence quenching system
The TPP fluorescence quenching system was prepared in the aqueous solution at pH 7.4. This is a two-step reaction with each step being monitored by spectroscopic methods. Fluorescence spectra of the solution prepared at different stages of the process were recorded with the same TPP concentration of 1.0 × 10⁻⁶ mol L−1. First, an aliquot of the stock solution of TPP was transferred into a 10 mL volumetric flask and the solvent was evaporated. Different β-CDs stock solutions were injected (<50 μL), then 2.0 mL of phosphate buffer solution was added. The mixed solution was diluted to 10 mL with buffer and shaken thoroughly. There is a significant TPP fluorescence enhancement when β-CDs were added to TPP aqueous solution. Second, the newly formed fluorescence system was titrated with metalloporphyrin by adding, with a micropipette, directly into the quartz cell, small aliquots (typically 20 μL) of the metalloporphyrin stock solution to 2.0 mL of the first-prepared solution. Dilution effect was thus rendered negligible.TPP fluorescence restoration
Into a 10 mL volumetric flask were successively placed 50 μL of TPP, 100 μL of Oc-β-CD, 25 μL of metalloporphyrins (see below), 2.0 mL of phosphate buffer solution and small aliquots of the protein standard solution. The mixture was diluted to 10 mL with water and mixed thoroughly by inversion. After incubation for 5 min at room temperature, the solution fluorescence spectra were recorded at λex = 418 nm, and λem = 620–780 nm.Fluorescence lifetime measurements
Fluorescence lifetimes of the porphyrin complexes were calculated from time-resolved luminescence intensity decays on Edinburgh Instruments FLS 920 luminescence spectrophotometer (UK) in the time-correlated single photon counting mode. The concentrations of TPP and CoTPP were 2.0 × 10⁻⁶ mol L−1 and 4.0 × 10⁻⁶ mol L−1, respectively. It was excited at 418 nm and recorded at 652 nm with excitation and emission slits of 5.0 nm, respectively. The data stored in a multi-channel analyzer was routinely transferred to a Pentium IV computer for analysis. Intensity decay curves so obtained were fitted as a sum of exponential terms1 | (1) |
 | (2) |
Results and discussion
Inclusion interaction of β-CDs and TPP
Prior to application in fluorescence sensing of protein, the effects of β-CD derivatives on TPP fluorescence were studied in THF/H2O (5 : 95, v/v) aqueous solution at pH 7.4. Fig. 2 shows the fluorescence emission spectra of TPP in different media. The bottom spectrum, 1, was measured in the absence of cyclodextrin, the fluorescence emission of free TPP (1.0 × 10⁻⁶ mol L−1) in the buffer solution is very weak. In contrast, addition of different β-cyclodextrin derivatives to an aqueous solution of TPP produced an increase in the overall emission intensity of the fluorescence compared to that observed in bulk buffer alone, as shown in spectra 2–3. The two bands at 652 and 720 nm correspond to Q (0–0) and Q (0–1) of free base porphyrin emission, respectively.26 These remarkable changes imply the interaction between TPP and cyclodextrin, whereby the TPP molecule preferentially binds within the relatively nonpolar cyclodextrin cavity to form a 2 : 1 cyclodextrin-to-porphyrin inclusion complex,27,28 and solvent molecules are simultaneously expelled from the cyclodextrin cavity. | ||
| Fig. 2 Fluorescence emission spectra of 1.0 × 10⁻⁶ mol L−1TPP in different media: 1, buffer; 2, β-CD; 3, Oc-β-CD. β-CD concentration 7.0 × 10⁻⁴ mol L−1; Oc-β-CD concentration 1.0 × 10⁻⁵ mol L−1. Excitation wavelength 418 nm. | ||
It is interesting to note that the degree of fluorescence enhancement of TPP by the β-cyclodextrin derivatives are different, of which Oc-β-CD displays great larger fluorescence enhancement than that by β-CD. It appears that the alkylated side chains of the cyclodextrin molecule are the main contribution to the stabilization of the inclusion complex. To describe quantificationally the bonding affinities of the cyclodextrin molecules and TPP, fluorescence emission spectroscopy was followed as aliquots of the cyclodextrins were added to the solutions of TPP. Analysis of the dependence of TPP fluorescence on the cyclodextrin concentration, the association constants of β-CD with TPP and Oc-β-CD with TPP were calculated to be (8.8 ± 1.2) ×102 (mol L−1)−2 and (8.6 ± 2.6) × 108 (mol L−1)−2, respectively, by the curve fitting method.15,28Oc-β-CD shows ∼106-fold affinity to TPP compared with β-CD. We reasoned that the alkylated side chains of the β-CD derivative can thread through the cavity of the cyclodextrin as a free molecule to form a double molecule inclusion complex with the porphyrin,16,27 which effectively decreases the freedom in molecular motion of the porphyrin molecule.
Fluorescence quenching of TPP/Oc-β-CD by metalloporphyrins
To develop a sensor based on fluorescence enhancement for protein, the enhanced fluorescence of TPP should be quenched by metalloporphyrin. Prior to study the fluorescence quenching of TPP by metalloporphyrins, the effects of heavy metal ions on TPP/Oc-β-CD fluorescence was first tested. In our experiment, it was found that, except for Hg(NO3)2 and CuCl2, the fluorescence quenching of TPP by ZnCl2, CoCl2, MnCl2, or other metal ions is not significant if the metal ion concentration is below 5.0 × 10⁻⁶ mol L−1.The effect of three metalloporphyrins, meso-tetraphenylporphyrin zinc(II) (ZnTPP), meso-tetraphenylporphyrin manganese(II) (MnTPP) and CoTPP on TPP fluorescence emission were thus studied. Fig. 3 shows the progressive decrease of the emission intensity of TPP as a function of the concentrations of the metalloporphyrins added into the complex solution. The fluorescence intensity of TPP at 651 nm was used to monitor the effect of the metalloporphyrins on TPP/Oc-β-CD fluorescence. Since the metalloporphyrins are not fluorescent at that wavelength (ZnTPP emits fluorescence at 605 nm, but the emission is very small at 651 nm), the observed emission at any point of the curve is the sum of those of the reaction product and the uncomplexed TPP provided that no long-range quenching occurs. Considering the low concentrations used in our experiments, this seemed particularly unlikely. From Fig. 3, the trend of decline went gently until the ratio of CoTPP to TPP is 4 : 1, ZnTPP to TPP is 5 : 1 and MnTPP to TPP is 4 : 1, and it remained at about 8%, 22% and 18% of the initial values, respectively. CoTPP displays the strongest fluorescence quenching.
![Evolution of TPP fluorescence quenching at 652 nm as functions of different concentrations of metalloporphyrins: (a) CoTPP; (b) MnTPP; and (c) ZnTPP. [TPP] = 1.0 × 10⁻⁶ mol L−1. λex = 418 nm.](/image/article/2008/AN/b808754g/b808754g-f3.gif) | ||
| Fig. 3 Evolution of TPP fluorescence quenching at 652 nm as functions of different concentrations of metalloporphyrins: (a) CoTPP; (b) MnTPP; and (c) ZnTPP. [TPP] = 1.0 × 10⁻⁶ mol L−1. λex = 418 nm. | ||
The observed decrease in TPP fluorescence by the metalloporphyrins can be the result of different interaction mechanisms: the formation of ground state aggregation of TPP and metalloporphyrin or the electron transfer or energy transfer interaction between TPP and the metalloporphyrin. To test if there is formation of ground state aggregation of TPP and metalloporphyrin, the absorbance spectra of TPP in the presence of CoTPP were recorded (data not shown). The absorption of TPP in the presence of Oc-β-CD at pH 7.4 shows a maximum absorption band (Soret band) at ∼434 nm and another two intense bands (Q- or β-band) at 393 nm and 563 nm, respectively. The spectroscopic properties of TPP have been changed in the presence of CoTPP, which shows no peak at 434 nm, but a very strong band at 418 nm, close to the characteristic CoTPP absorption,29 and a broad band at 525 nm are observed. These results demonstrate that there are some ground-state interactions between TPP and CoTPP which has either completely changed the electronic states of TPP molecule, or overlapped in such a way that the 434 nm is buried under the strong absorption band of the system.
Excited-state lifetime of TPP has been studied to further confirm whether there is excited state interaction between TPP and CoTPP in the present approach. Decay curve measurements of TPP + CoTPP in the presence of Oc-β-CD were performed using a multichannel analyzer (Fig. 4). In the absence of CoTPP, global analysis of the resulting data of TPP as a single-exponential decay gave a satisfactory fit (χ2 = 1.121) with a lifetime of 9.78 ns, which is nearly the lifetime for TPP in ethanol.30,31 When CoTPP was added to the solution of Oc-β-CD/TPP, the decay curve was slightly complicated and could be fitted as monoexponential decay with two lifetimes (χ2 = 1.212). The lifetime of the major component (98.4%) was 9.81 ns, while that of the other component (1.6%) was 2.7 ns. The almost no lifetime change of the major component indicates that there is no significant excited state interaction between TPP and CoTPP. Although we could not obtain direct evidence to confirm the formation of a tertiary complex among CoTPP, TPP and β-CD, both the absorption and fluorescence lifetime demonstrated that the fluorescence quenching of TPP by CoTPP is to the result of the ground-stated interaction between TPP and CoTPP. From the fluorescence intensity decrease of TPP/Oc-β-CD by different concentrations of metalloporphyrin, the quenching efficiencies, KSV, of TPP by the three metalloporphyrins are 2.14 × 10⁶ (CoTPP), 8.52 × 10⁵ (MnTPP), and 7.01 × 10⁵ (ZnTPP), respectively.
 | ||
| Fig. 4 Top: time-dependent fluorescence decay data of TPP (5 × 10⁻⁵ mol L−1) (curve a) and TPP + 5.0 ×10⁻⁶ mol L−1CoTPP (curve b) in the presence of Oc-β-CD, and the corresponding fit to a monoexponential decay function. Curve c is the instrumental response. Bottom: distribution of the weighed residuals for the monoexponential fit of the fluorescence decay: TPP was excited at 418 nm and the emission was collected at 652 nm. | ||
Fluorescence sensing of albumin
There have been reports on the interactions of protein with some water-soluble porphyrins based on the absorption changes of the porphyrin molecule.17,18 In this study, however, addition of BSA or HSA to the TPP solution in the presence or absence of Oc-β-CD does not show any TPP fluorescence change. Specifically, the present metalloporphyrin quenched approaches were found to be highly efficient in fluorescence sensing of biomolecules. It was found that the quenched fluorescence of TPP in the metalloporphyrin system could be restored by albumin, and this fluorescence restoration is strongly dependent, for a given condition, on the nature of the metalloporphyrin. Fig. 5 shows the fluorescence emission spectra of Oc-β-CD/TPP and its metalloporphyrin self-assembled complexes, TPP/Oc-β-CD/CoTPP, TPP/Oc-β-CD/MnTPP, and TPP/Oc-β-CD/ZnTPP, in the presence of 10 μg mL−1 of BSA. Competitive interaction of BSA with TPP for the metalloporphyrin reduces the interaction between TPP and the metalloporphyrin, and thus suppresses fluorescence quenching of TPP, exhibiting fluorescence enhancement in comparison with that without the target. There was a rather large variation in the signal-to-background noise (S/B) ratio in these assays because of the different background signals of the probes. For example, the S/B for TPP/Oc-β-CD/CoTPP, TPP/Oc-β-CD/MnTPP, and TPP/Oc-β-CD/ZnTPP generated by 10 μg mL−1 BSA were 3.91, 2.02 and 2.57, respectively. Due to the high S/B of TPP/Oc-β-CD/CoTPP, CoTPP was chosen as the BSA acceptor. Fig. 6 shows the typical fluorescence emission response of TPP/Oc-β-CD/CoTPP to increasing concentrations of BSA. Upon addition of BSA, TPP/Oc-β-CD/CoTPP exhibits an enhancement of the porphyrin fluorescence intensity and the two bands at 653 nm and 720 nm, respectively. Depending on the BSA concentration range, there are different response sensitivities. The small but perceptible change at low concentration of BSA indicates that BSA molecules are capable of interacting with the system, even at very low concentration. In the concentration range of 0.8 μg mL−1 to 75.4 μg mL−1, a drastic fluorescence enhancement is observed, and the emission intensity increases linearly. At a BSA concentration more than 100 μg mL−1, no further increase in fluorescence is observed and a plateau is reached. The detection limit that is taken to be three times the standard derivation in blank solution is 0.32 μg mL−1. For HSA, the system displays drastic fluorescence enhancement in the HSA concentration from 3.20 to 93.2 μg mL−1, the corresponding detection limit is 1.06 μg mL−1.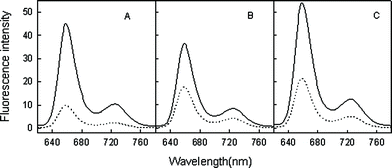 | ||
| Fig. 5 Fluorescence emission spectra of TPP/Oc-β-CD/CoTPP (A), TPP/Oc-β-CD/MnTPP (B), and TPP/Oc-β-CD/ZnTPP (C) in the absence (dotted lines) and the presence (continuous lines) of 10 μg mL−1 BSA. The concentration of TPP is 1.0 × 10⁻⁶ mol L−1, the concentrations of metalloporphyrins are 5.0 × 10⁻⁶ mol L−1. Excitation wavelength was at 418 nm. | ||
![Fluorescence restoration of TPP/Oc-β-CD/CoTPP by different concentrations of BSA at pH 7.4. Fluorescence emission spectra were recorded at 620 nm to 780 nm after excitation at 418 nm. The dashed line corresponds to the fluorescence emission spectrum of TPP/Oc-β-CD without metalloporphyrin and protein. Inset: fluorescence intensity at 652 nm as a function of the logarithm of BSA concentration. [TPP] = 1.0 × 10⁻⁶ mol L−1, [CoTPP] = 4.0 × 10⁻⁶mol L−1, [Oc-β-CD] = 1.0 × 10⁻⁵mol L−1.](/image/article/2008/AN/b808754g/b808754g-f6.gif) | ||
| Fig. 6 Fluorescence restoration of TPP/Oc-β-CD/CoTPP by different concentrations of BSA at pH 7.4. Fluorescence emission spectra were recorded at 620 nm to 780 nm after excitation at 418 nm. The dashed line corresponds to the fluorescence emission spectrum of TPP/Oc-β-CD without metalloporphyrin and protein. Inset: fluorescence intensity at 652 nm as a function of the logarithm of BSA concentration. [TPP] = 1.0 × 10⁻⁶ mol L−1, [CoTPP] = 4.0 × 10⁻⁶mol L−1, [Oc-β-CD] = 1.0 × 10⁻⁵mol L−1. | ||
Factors affecting albumin measuring
 | ||
| Fig. 7 Relationship between the fluorescence signal changes and the concentrations of BSA at different CoTPP- to-TPP molar ratios: (1) 1 : 1, (2) 3 : 1, (3) 4 : 1 (TPP concentration was fixed at 1.0 × 10⁻⁶ mol L−1). Fluorescence emission intensity was recorded at 652 nm with an excitation wavelength of 418 nm. | ||
Selectivity
Under the same experimental conditions, the effects of metal ions, anions, nonprotein substances, and other proteins (pepsin, trypsin, cellulose, and lysozyme) on the fluorescence of TPP/Oc-β-CD/CoTPP have also been examined to evaluate the selectivity. Selectivity was governed by the relative error of TPP fluorescence intensity changed when the system was interacted with 30 μg mL−1 BSA as well as standard mixed solution containing 30 μg mL−1 BSA and each foreign substance. No significant interferences were observed, if a less than ±5% relative error was tolerated. The results are summarized in Table 1. Some common ions, such as Na+, K+, NH4+, Mg2+, Mn2+, Co2+, Ni2+, Cu2+, Fe2+ and Fe3+, show no remarkable interference for the determination of 30 μg mL−1 BSA. But high concentration of Hg2+ or Zn2+ will cause negative error, which results from the quenching of TPP fluorescence by the metal ions. For the selected anions, the TPP fluorescence emission was hardly affected by Cl−, F−, SO42−, CO32−, NO3−, NO2−, CH3COO−, and H2PO4−. However, significant fluorescence enhancement was observed by high concentration of SCN−. Titrations of trypsin, cellulase and lysozyme with the system, showed no TPP fluorescence intensity changes. A slight increase in TPP fluorescence intensity was observed when histidine was added to the system. HSA has the similar response behavior as that of BSA, but the degree of TPP fluorescence restoration is little smaller than BSA.| Interferents | Concentration | Change of fluorescence value, ΔF = (F1 − F2)b | Relative signal value (%) ΔF/F1 × 100 |
|---|---|---|---|
| a Each sample solution contained a fixed BSA concentration of 30 μg mL−1. b F 1 and F2 are the fluorescence intensity of TPP in the presence of 30 μg mL−1 BSA without and with interferents, respectively. | |||
| NaCl | 1.00 mol L−1 | 1.27 | 2.36 |
| MgSO4 | 0.5 mol L−1 | 1.27 | 2.35 |
| MnCl2 | 5.0 × 10⁻³ mol L−1 | 2.26 | 4.18 |
| CoCl2 | 2.0 × 10⁻³mol L−1 | 1.79 | 3.31 |
| ZnCl2 | 1.0 × 10⁻⁵ mol L−1 | 1.11 | 2.05 |
| Hg(NO3)2 | 5.0 × 10⁻⁵mol L−1 | 0.73 | 1.36 |
| CuCl2 | 1.0 × 10⁻³ mol L−1 | −1.68 | −3.12 |
| FeSO4 | 2.0 × 10⁻³ mol L−1 | −1.04 | −1.93 |
| NaF | 1.0 × 10⁻³ mol L−1 | −1.11 | −2.06 |
| NaNO2 | 5.0 × 10⁻³ mol L−1 | −1.71 | 3.41 |
| NaSCN | 1.0 × 10⁻³ mol L−1 | 2.45 | 4.54 |
| CH3COONa | 1.00 mol L−1 | 0.98 | 1.81 |
| Glycine | 150 μg mL−1 | −1.64 | −3.03 |
| DL-Lysine | 90.0 μg mL−1 | 1.63 | 3.02 |
| L-Histidine | 57.0 μg mL−1 | 1.30 | 2.41 |
| Pepsin | 78.0 μg mL−1 | 1.65 | 3.06 |
| Trypsin | 80 μg mL−1 | 0.57 | 1.05 |
| ctDNA | 750 μg mL−1 | 1.69 | 3.13 |
| Glucose | 800 μg mL−1 | −1.38 | −2.56 |
To clear out the selective fluorescence enhancement of the supramolecular system by BSA/HSA and SCN−, the interactions of CoTPP with the proteins and anions were studied. Fig. 8 shows the UV-Vis absorption spectral changes of CoTPP upon additions of 0.1 mol L−1 of the selected anions and 30 μg mL−1 of the proteins. In the cyclodextrin aqueous solution, CoTPP displays a maximum absorption peak at 417 nm. When different analytes were added into the solution, the porphyrin showed different response behaviors. In the presence of SCN− or HSA, the absorption of CoTPP at 417 nm exhibits obvious decrease concomitant with a weak absorption peak at 443 nm, indicating the existence of weak interaction between CoTPP and the two analytes. By contrast, when BSA was added to the cyclodextrin aqueous solution, the 416 nm band peak completely disappeared while a strong absorption at 443 nm appeared. However, no absorption spectral changes were detected upon the addition of other anions and proteins to the cyclodextrin aqueous solution of CoTPP. The results showed the high selective interaction of CoTPP with BSA compared with other investigated analytes.
![Effects of selected analytes on the UV-Vis absorption spectra of CoTPP in Oc-β-CD aqueous solution. The dashed line corresponds to the absorption spectrum of CoTPP/Oc-β-CD without analyte. [CoTPP] = 5.0 × 10⁻⁶ mol L−1. [anion] = 0.1mol L−1, [BSA] = [HSA] = 10 μg mL−1.](/image/article/2008/AN/b808754g/b808754g-f8.gif) | ||
| Fig. 8 Effects of selected analytes on the UV-Vis absorption spectra of CoTPP in Oc-β-CD aqueous solution. The dashed line corresponds to the absorption spectrum of CoTPP/Oc-β-CD without analyte. [CoTPP] = 5.0 × 10⁻⁶ mol L−1. [anion] = 0.1mol L−1, [BSA] = [HSA] = 10 μg mL−1. | ||
Although the origin of the absorption response of the metalloporphyrin toward BSA remains poorly understood, it is likely to direct and be a relatively strong interaction with the imidazole moiety of the protein molecule as an axial ligand of cobalt(II).33 Since the π symmetry orbits of the low-spin Co(II) (d7) ion are completely filled, this would suggest that the five-membered imidazole rings are better π-acceptors from Co(II) than are aliphatic amines and pyridines,34 which acts to remove much of the steric interaction with the hydrogen bonds of the adjacent carbons. The extinction coefficient decrease at 417 nm and shift of the maximal absorption to longer wavelength (442 nm) of CoTPP by BSA, as shown in Fig. 8, is characteristic for the BSA coordination with the central metal.35 Moreover, the Soret band reflects the valence state of the central metal. The coordination of BSA with the central cobalt(II) results in the delocalization of the cobalt(II) d orbitals, which causes the red-shift of the Soret band. Fig. 8 also shows that the numbers of the absorption peaks do not change after porphyrin cobalt(II) coordinated with BSA. This indicates that, after BSA is coordinated with the central metal, the symmetry group of the metallopropyrin-BSA complex agrees with the C2ν symmetry group of the metalloporphyrin,36 and one BSA is coordinated with one central cobalt atom in the process of ligation interaction.
Preliminary application
The practical application of the present approach was tested on the determination of total protein in human serum by the following procedure: human serum samples, obtained from the Hunan University Hospital, were added to the appropriate amount of sodium citrate, and diluted 1000-fold with water. The albumin contents in the serum samples were determined by using the described procedure. The reference determination was performed according to the standard procedure of the Bradford method.37 The results are shown in Table 2, which are in agreement with those obtained by the Bradford method.In order to determine the efficiency of the proposed method, six synthetic samples of BSA were constructed by added foreign substances with concentrations below the tolerance level present in Table 1. The recovery for the BSA determination in the presence of the foreign substances was examined. The results are also satisfactory (Table 3).
| Sample | Analyte and interferents added/μg mL−1 | BSA found/μg mL−1 | Recovery (%) | ||||
|---|---|---|---|---|---|---|---|
| BSA | Gly | L-His | Glu | ctDNA | |||
| 1 | 10.0 | 8.0 | 12.0 | 5.0 | 15.0 | 10.6 | 106 |
| 2 | 10.0 | 5.0 | 12.0 | 5.0 | 15.0 | 10.3 | 103 |
| 3 | 10.0 | 10.0 | 8.0 | 15.0 | 12.0 | 10.8 | 108 |
| 4 | 40.0 | 20.0 | 30.0 | 60.0 | 30.0 | 42.2 | 106 |
| 5 | 40.0 | 60.0 | 50.0 | 30.0 | 40.0 | 44.1 | 110 |
| 6 | 40.0 | 40.0 | 30.0 | 50.0 | 60.0 | 41.7 | 104 |
Conclusion
Based on the above-described interactions taking place in β-cyclodextrin medium, we have applied a competitive mechanism for the restoration of TPP fluorescence. In Oc-β-CD aqueous solution, CoTPP interacts with TPP resulting in the quenching of TPP fluorescence by formation of a ground state complex. On the other hand, albumin is also able to interact with CoTPP to destroy the aggregates, which is the source of the restoration of TPP fluorescence. The new system synthesis and the restoration of the quenched fluorescence processes enable a better understanding of porphyrin-based chemistry and the exploration of a novel bioanalysis for proteins as well as becoming a new model for multi-factorial biological systems for molecular recognition and for mimicking active transport or concentration of substances.Acknowledgements
This work was supported by the National Outstanding Youth Foundation of China (Grant No. 20525518) and the National Natural Science Foundation of China (Grant No. 20775005).References
- J. Lakowicz, Principles of Fluorescence Spectroscopy, Springer, New York, 3rd edn, 2006 Search PubMed.
- A. P. de Silva, H. Q. N. Gunaratne, T. Gunnlaugsson, A. J. M. Huxley, C. P. McCoy, J. T. Rademacher and T. E. Rice, Chem. Rev., 1997, 97, 1515 CrossRef.
- L. Fabbrizzi, M. Licchelli, G. Rabaioli and A. Taglie, Coord. Chem. Rev., 2000, 205, 85 CrossRef CAS.
- P. D. Beer and P. A. Gale, Angew. Chem., Int. Ed., 2001, 40, 486 CrossRef.
- E. D. Steinle, S. Amemiya, P. Bu1hlmann and M. E. Meyerhoff, Anal. Chem., 2000, 72, 5766 CrossRef CAS.
- R. H. Yang, K. M. Yang, L. P. Long, D. Xiao, X. H. Yang and W. H. Tan, Anal. Chem., 2002, 74, 1088 CAS.
- K. Takahashi, Chem. Rev., 1998, 98, 2073.
- R. J. Cave, P. Siders and R. A. Marcus, J. Phys. Chem., 1996, 90, 1436.
- Y. Zhang, H. Wang and R. H. Yang, Sensor, 2007, 7, 410 Search PubMed.
- G. P. Luis, M. Granda, R. Badía and M. E. Díaz-García, Analyst, 1998, 123, 155 RSC.
- S. Li and W. C. Purdy, Chem. Rev., 1992, 92, 1457 CrossRef CAS.
- J. Sezjetli, Chem. Rev., 1998, 98, 1743 CrossRef CAS.
- T. Ikedu, K. Yoshida and H. J. Schneider, J. Am. Chem. Soc., 1995, 117, 1453 CrossRef CAS.
- F. Venema, A. E. Rowna and R. J. A. Nolte, J. Am. Chem. Soc., 1996, 118, 257 CrossRef.
- R. H. Yang, K. M. Wang, D. Xiao and X. H. Yang, Spectrochim. Acta, Part A, 2001, 57, 1595 CrossRef CAS.
- R. H. Yang, K. A. Li, K. M. Wang, F. L. Zhao, N. Li and F. Li, Anal. Chem., 2003, 75, 612 CrossRef CAS.
- N. Li and S. Y. Tong, Talanta, 1994, 41, 1657 CrossRef CAS.
- J. Nakamura and S. Igarashi, Anal. Lett., 1996, 29, 981 CAS.
- R. H. Yang, K. M. Wang, D. Xiao and X. H. Yang, Microchem. J., 2000, 64, 213 CrossRef CAS.
- A. D. Alder, F. R. Longo and J. D. Finarelli, J. Org. Chem., 1967, 32, 476 CrossRef CAS.
- T. L. Blair, J. R. Allen, S. Daunert and L. G. Bachas, Anal. Chem., 1993, 65, 2115.
- P. Hambright, T. Gore and M. Burton, J. Chem. Soc., Faraday Trans. 2, 1976, 75, 1532 Search PubMed.
- R. L. Brookfield, H. Ellul and A. Harriman, J. Photochem., 1985, 31, 97 CrossRef CAS.
- K. Kano, T. Miyake, K. Uomoto, T. Sato, T. Ogawa and S. Hashimoto, Chem. Lett., 1983, 12, 1867 CrossRef.
- P. R. Bevington, inData Reduction and Error Analysis for the Physical Sciences, McGraw-Hill, New York, 1969 Search PubMed.
- G. Hungerford, M. I. C. Ferreria, M. R. Pereira, J. A. Ferreria and A. F. Coelho, J. Fluoresc., 2000, 10, 283–290 CrossRef CAS.
- J. S. Manka and D. S. Lawrence, Tetrahedron Lett., 1989, 30, 7341 CrossRef CAS.
- R. H. Yang, K. M. Wang, D. Xiao and X. H. Yang, Fresenius’ J. Anal. Chem., 2000, 367, 429 CrossRef CAS.
- M. Nappa and J. S. Valentine, J. Am. Chem. Soc., 1978, 100, 5075 CrossRef CAS.
- H. S. Cho, H. Rhee, J. K. Song, C.-K. Min, M. Takase, N. Aratani, S. Cho, A. Osuka, T. Joo and D. Kim, J. Am. Chem. Soc., 2003, 125, 5849–5860 CrossRef CAS.
- N. Mataga, Y. Shibata, H. Chosrowjan, N. Yoshida and A. Osuka, J. Phys. Chem. B, 2000, 104, 4001–4003 CrossRef CAS.
- J. Itoh, T. Yotsuganagi and K. Aomura, Anal. Chim. Acta, 1975, 74, 53 CrossRef CAS.
- F. A. Walker, J. Am. Chem. Soc., 1973, 95, 1154 CrossRef CAS.
- F. A. Walker, J. Am. Chem. Soc., 1973, 95, 1150 CrossRef CAS.
- M. Nappa, J. S. Valentine and P. A. Snyder, J. Am. Chem. Soc., 1977, 99, 5799 CrossRef CAS.
- A. B. Hoffmam, D. M. Collins, V. W. Day, E. B. Fleischer, T. S. Srivastatva and J. Hoard, J. Am. Chem. Soc., 1972, 94, 3620 CrossRef CAS.
- M. M. Bradford, Anal. Biochem., 1976, 72, 248 CrossRef CAS.
Footnote |
| † This paper is part of an Analyst themed issue highlighting Chinese science, with guest editor Mengsu (Michael) Yang. |
| This journal is © The Royal Society of Chemistry 2008 |