Surfactant and polyelectrolyte gel particles for encapsulation and release of aromatic oils
Yakov
Lapitsky
and
Eric W.
Kaler
*
Center for Molecular and Engineering Thermodynamics, Department of Chemical Engineering, University of Delaware, Newark, DE, USA. E-mail: kaler@udel.edu; Fax: +1 302 831 6751; Tel: +1 302 831 6751
First published on 1st August 2006
Abstract
Associative phase separation occurs when oppositely charged surfactants and polyelectrolytes are mixed in near-stoichiometric proportions. This behavior has been exploited in the production of gel particles that range between approximately 100 and 4000 µm in diameter. Here, we investigate their performance as materials for the encapsulation and release of the aromatic oil cymene. The gel particles (ca. 1500 µm in diameter) are prepared by dropwise addition of an oil-in-water suspension made of cymene droplets dispersed in a viscous solution of sodium dodecyl sulfate (SDS) and N,N,N-trimethylammonium derivatized hydroxyethyl cellulose (JR-400™) to a gelling solution of excess SDS. The release of cymene into aqueous (5 wt.% SDS and 4 wt.% pentanol in water) and organic (isooctane) solutions is measured using UV–VIS spectroscopy and analyzed with the shrinking core model. The experimental data and model analysis indicate that the release rate is determined by the effective diffusivity and solubility of the oil in the aqueous gel matrix, both of which depend on the presence of surfactant in the receiving solution, and the swelling of the gel particle.
1. Introduction
Gelled oil-in-water emulsions have attracted interest as encapsulation devices in cosmetic,1 drug delivery2,3 and food science applications.4,5 They are often produced using a two-step process in which first oil is dispersed in an aqueous polymer solution that is then gelled to trap the oil droplets in the gel matrix. This gelation effect has been achieved in several ways: ionic crosslinking of polyelectrolytes (e.g., alginate crosslinked with Ca2+), using associating polypeptides and carbohydrates (such as gelatin, agar, and starch), or via thermogelation of block copolymer systems.3,5 In many applications these materials appear in the form of spherical particles that are either used separately (e.g., gel capsules as drug carriers) or as components in liquid or gelatinous formulations. Recently, several studies have shown that insoluble gel particles can also be formed from mixtures of oppositely charged surfactants and polyelectrolytes.6–8 In this case surfactant aggregates act as physical crosslinks between the polyelectrolyte chains. These materials present an attractive alternative for the encapsulation of oils in surfactant-based products.The formation of surfactant–polyelectrolyte gel particles has been investigated in detail for mixtures of anionic surfactants with N′N′N-trimethylammonium derivatized hydroxyethyl cellulose (Amerchol JR-400™).6,9,10 Both the formation and stability of these gels depend on the equilibrium phase behavior of the surfactant–polymer mixture.6 When JR-400 is in excess, single-phase viscous solutions form. The viscosity of these solutions is several orders of magnitude higher than that of a surfactant-free solution with the same polymer composition, and the rheology shows relaxation times in the range of 1–10 s.11,12 When the surfactant concentration is slightly above that needed to neutralize the polyelectrolyte charge (the charge equivalence line) phase separation occurs. Here the dense phase is a gel-like material whose shape is fixed upon formation6,13,14 and thus allows the production of stable gel structures. As the surfactant concentrations are increased to considerable excess, however, a resolubilization boundary is reached. Under these conditions the gel complex redissolves into a single-phase solution over time. However, if the surfactant–polyelectrolyte complex is reinforced with covalent crosslinks between the polymer chains the gel swells but remains intact.9,15
While the equilibrium phase behavior governs the formation and stability of these gels, the macroscopic structure (which can range from spherical particles, to cylindrical fibers, to flat sheets) is controlled by the method of preparation.10 Spherical particles are produced here by dropwise addition of JR-400 solution into a solution of oppositely charged surfactant,6–8 in the same fashion as done previously with other gel-forming materials.16–18 Gel fibers can be formed by extruding the viscous, polymer-rich surfactant–polyelectrolyte solution into a solution of gelling surfactant. Finally, the gel complex can be deposited on a flat substrate to form a planar sheet.10
Here, we have encapsulated an aromatic oil (cymene) in surfactant–polyelectrolyte gel particles and studied its release into either aqueous or organic phases. The cymene-loaded gel particles were prepared by blending the organic phase into a viscous polymer-rich surfactant–polyelectrolyte solution, whereupon the blend was added dropwise to the gelling surfactant. In order to maintain the integrity of the particles over a broad range of conditions, they were crosslinked with divinyl sulfone (DVS). The oil was then released into either an aqueous mixture of sodium dodecyl sulfate (SDS) and pentanol or into neat isooctane. The release rates were analyzed using the shrinking core model,19–21 and are governed by the diffusivity and solubility of the oil in the aqueous gel phase.
2. Materials and methods
2.1 Materials
All experiments were done using Millipore Milli-Q deionized water (18.0–18.3 MΩ cm resistivity). Sodium dodecyl sulfate (SDS, MP Biomedicals Inc.), divinyl sulfone (DVS, TCI America), p-cymene (Acros Organics), isooctane (Fluka), and cationically modified hydroxyethyl cellulose (JR-400™, Amerchol Inc.) with a nominal molecular weight of 500,00022 were used as received without further purification. The solution pH was adjusted with sodium hydroxide (NaOH, Fisher).2.2 Gel Particle preparation
Neat cymene (4 g) was carefully poured on top of 36 g of viscous 1 wt.% JR-400, 7.6 × 10⁻² wt.% SDS, and 17 mM NaOH solution. The dispersing element of an IKA® Ultra Turrax T18 mixer was inserted into the stratified mixture, so that the interface between the aqueous and organic phases was at the level of the stator slots. The viscous aqueous phase was allowed to relax for one min, after which the cymene is blended into the aqueous phase at 10,000 RPM for 5 min. To form the gel particles, 0.5 g of the resulting viscous blend was added dropwise to 3 g of 0.5 wt.% SDS and 17 mM NaOH solution through a 24 gauge needle at a rate of approximately 200 µl min−1. The particles were then covalently crosslinked by adding 120 µl DVS and after gentle manual agitation the mixture was allowed to react for 20 min. To terminate the reaction 10 ml of 50 : 50 water–ethanol solution (containing 17 mM NaOH) were added the vessel and left for 2 h. After terminating the reaction the particles were filtered from the water–ethanol solution and incubated in excess aqueous 0.05 wt.% SDS solution for at least 24 h.2.3 Confocal imaging
To image the cymene dispersed in the gel matrix, oil-impregnated gels were prepared in the shape of thin slabs. The viscous cymene blend was coated onto a 35 × 10 mm culture dish with a flat paintbrush. The cymene was spiked with 0.25 wt.% pyrene (Sigma). The blend was gelled by pouring 3 g of 0.5 wt.% SDS and 17 mM NaOH solution into the culture dish, after which 120 µl DVS were immediately added in order to crosslink the gel slab. After gentle manual agitation the reaction cocktail was allowed to react for 20 min. To terminate the reaction the supernatant was discarded and substituted with 3 ml of 50 : 50 water–ethanol solution (containing 17 mM NaOH), and the gel was soaked for 2 h. The slab was then cut into ∼5 mm squares, pealed away from the culture dish, and inserted into 0.05 wt.% SDS solution, spiked with 0.225 mg 3,6-bis(dimethylamino)acridine (Acridine Orange, Fisher) to label the gel phase. After equilibrating the gel for at least 24 h the xy-plane of the slab was imaged with a Zeiss 510 NLO multiphoton confocal microscope equipped with a C-Apochromat 40X/1.2 W Corr water immersion objective by multiphoton excitation of the gel matrix with a 50 mW Titanium Sapphire Laser (λ = 737 nm). The optical signals from the Acridine Orange and pyrene dyes were split into two channels using two optical filters (low-pass 560 nm for Acridine Orange, and band-pass 390–465 nm for pyrene).2.4 Release rate measurements
The release rates of cymene into aqueous (5 wt.% SDS and 4 wt.% pentanol) and organic (isooctane) receiving solutions were measured by stirring approximately 450 gel particles in a beaker filled with 60 g of solution. The concentration of cymene in the receiving solution was monitored over time using a Perkin Elmer Lambda 2 UV–VIS spectrometer. Cymene concentration was determined using absorption at 236 nm, where the molecular extinction coefficient of cymene measured in isooctane is 4.26 × 10⁻² L mmol−1 cm−1. In the case of the SDS–pentanol receiving solution the linear relationship between the UV absorption and cymene concentration in the SDS–pentanol solution had a y-intercept due to the scattering from the micelles (i.e., A = εbCA0 + aS, where ε, b, CA0, and aS are respectively the molecular extinction coefficient, sample path length, cymene concentration, and attenuation due to scattering). The molecular extinction coefficient was measured to be 4.18 × 10⁻² L mmol−1 cm−1 and the attenuation due to scattering was 0.412 cm−1.3. Results
3.1 Gel particle preparation and imaging
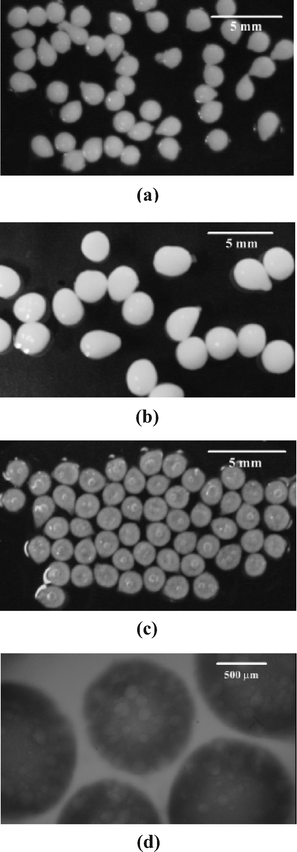
When cymene is blended into the viscous surfactant–polyelectrolyte solution, the solution becomes white and less viscous (although it remains considerably more viscous than the JR-400 solution in the absence of surfactant). Upon its dropwise addition to the gelling surfactant solution the drops do not have enough time to completely relax into a spherical geometry and so retain a teardrop shape. This is consistent with the relatively high value of the capillary number (Ca = η0v/γ ∼ O(1–10), where η0, v, and γ are the intrinsic viscosity, velocity, and surface tension, respectively) which approaches the onset of jetting, and therefore favors the formation of elongated drops. Moreover, because the long characteristic droplet formation time (τ =η0dS/γ ∼ O(0.1 s), where dS is the droplet diameter23) is comparable to the flight time of the drop (for a needle height of ∼30 cm the flight time is approximately 0.2–0.3 s) there is not enough time for the falling drop to attain a globular shape. During the gelation and crosslinking, however, the particles become more spherical, probably due to the faster gelation rates at the pointed side of the gelling particle. Furthermore, as expected, the size of the gel particles depends strongly on the solution flow rate and needle size. Fig. 1a. shows the particles prepared by the dropwise addition with a 24-gauge needle while the particles in Fig. 1b. were prepared by manual addition using a 20-guage needle. The particles formed from the larger (20-gauge) syringe needle are several times larger in volume. | ||
| Fig. 1 Cymene-loaded gel particles formed (a) using a syringe pump equipped with a 24-gauge needle and (b) manually using a 20-gauge needle. Particles became more translucent (c) after oil release into SDS–pentanol solution, whereupon the (d) oil-depleted vacuoles (light spots in gel the particle) became visible. | ||
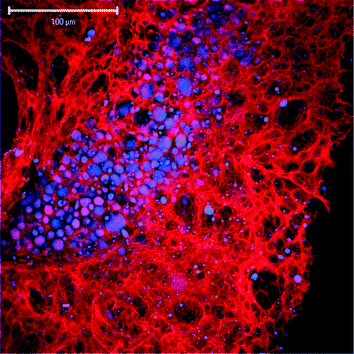
The confocal imaging of the cymene-loaded gel matrix (see Fig. 2) reveals the presence of polydisperse oil droplets, whose size varies from around a micron to tens of microns, and whose non-uniform spatial distribution reflects the imperfection of the blending method. Likewise, the gel matrix is composed of large (up to tens of microns), polydisperse pores that suggest that the gel will be a very weak barrier to molecular and micellar diffusion. Unfortunately, the gel could only be imaged near the surface of the gel structure (less than 20–30 µm deep) due to the high optical signal attenuation caused by the presence of multiple phases.
 | ||
| Fig. 2 Confocal image of pyrene-stained cymene drops (blue) dispersed in the surfactant–polyelectrolyte gel matrix (red). | ||
3.2 Release rate experiments
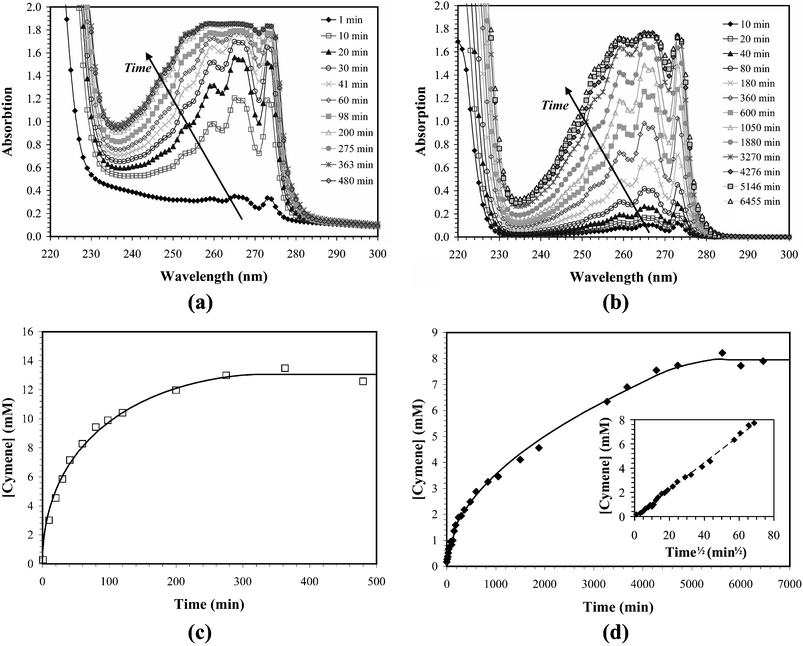
Upon their addition to the 5 wt.% SDS and 4 wt.% pentanol solution the oil-loaded gel particles were immediately dispersed in the stirred receiving medium. The cymene release was rapid and was complete within 3–4 h (see Fig. 3a and 3c). After stirring the particles in the receiving solution for 8 h, the particles were imaged. While the particles exhibited no change in size during the release process (before release the average radius was 770 ± 90 µm, afterwards it was 780 ± 84 µm) the particles were considerably less opaque after the oil was released (Fig. 1c) than before the experiment (Fig. 1a). Their reduced opacity allowed their internal structure to be observed with light microscopy (Fig. 1d), which shows the presence of large (up to 100 µm in diameter) vacuoles left behind by the solubilized oil droplets. Approximately 10% of the particles were fractured by the stirring. | ||
| Fig. 3 UV–VIS spectra and solution phase cymene concentrations upon its release into SDS–pentanol (a and c) and isooctane (b and d) solutions. The solid lines are fits to the data using the models discussed in the text. The inset in plot (d) shows that the rate of cymene release into isooctane scales with the square-root of time. The dashed line represents the linear regression for the proportionality constant (R2-value of 0.9964). | ||
When the cymene was released into isooctane, the experiment was complicated by the high surface tension between the aqueous gel particles and the organic solvent, which caused the particles to aggregate and to adhere to the wall of the vessel. To reduce the aggregation effects, the particle clusters were spread into a monolayer on the glass wall of the vessel, so that every particle was in contact with the receiving solution. Under these conditions the release rate was substantially slower than in the case of the SDS–pentanol receiving solution, and 80–90 h were required for the solution cymene concentration to attain steady state (see Fig. 3b and 3d). Imaging of the gel particles indicated that while the particles adhered to the wall were not damaged by the stirrer and exhibited no obvious change in opacity, the gel shrinks considerably, with the average particle radius decreased from 730 ± 66 µm to 570 ± 70 µm, corresponding to a twofold reduction in volume.
4. Discussion
4.1 Release into aqueous SDS–pentanol solution
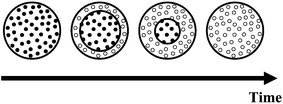
The release properties of the gel particles dispersed in the surfactant solution can be analyzed with a simplified shrinking core model.19–21 Here, the oil droplets are modeled to be uniformly distributed through the gel particle. During the release process stationary cymene droplets dissolve into the mobile aqueous gel phase and the dissolved cymene diffuses out of the particle. This leads to the frontal consumption of oil droplets illustrated in Fig. 4. The model assumes that the aqueous gel phase inside the droplet-loaded shell is saturated with cymene and ignores temporal changes in the gel volume. Furthermore, because the receiving solution is well-mixed, external resistance to mass transfer is ignored. | ||
| Fig. 4 Schematic cartoon of the shrinking core model where the oil-loaded core (of radius R1) shrinks with time. | ||
Under the assumption that the timescale for the consumption of the core is much longer than the characteristic diffusion time (τD ∼ length2/diffusivity) the pseudo-steady-state concentration profile inside the droplet-depleted particle exterior is given by:
 | (1) |
 | (2a) |
 | (2b) |
 | (3a) |
 | (3b) |
Furthermore, because the concentration in the external phase is maintained low (i.e., mCA0 ≪ CsatA), the mCA0 term can be neglected to yield the final simplified result:
 | (4a) |
 | (4b) |
This result indicates that the rate of aromatic oil release is proportional to both the effective diffusivity of the oil in the aqueous phase and the saturation concentration. This is consistent with the slower release rates observed in the absence of added surfactant (release into isooctane), as the saturation concentration of cymene in water is approximately 2 × 10⁻⁴ M,24 three orders of magnitude less than the measured saturation concentration in the SDS–pentanol–water solution (0.22 ± 0.01 M).
The numerical solution of eqns 4a and 4b for CA0(t) was fitted to experimental data using MATLAB by first determining the ϕ value that yields the measured final solution concentration (ϕ = 0.14), and then fitting DA to be approximately 2 × 10⁻¹¹ m2 s−1. This value is consistent with what is expected for micelles (a few nanometres in radius) diffusing through a porous gel network, where empty micelles enter the particle, absorb oil, and then diffuse out of the particle.
With these results in hand, the assumption of diffusion-limited mass transfer can be tested by comparing the internal (diffusive) resistance to mass transfer to the external (convective) resistance to mass transfer. This can be easily done by calculating the Biot number:
 | (5) |
4.2 Release into isooctane solution
Model treatment of cymene release into isooctane involves two additional degrees of complexity: a more complicated geometry (as radial symmetry ceases to hold for a monolayer of particles adhered to the wall) and accounting for the change in the particle volume. As a result, we make here only order-of-magnitude arguments that show that the release of the aromatic oil into the isooctane can be qualitatively treated using the conceptual framework described in the previous section.Because the aggregated particles were spread in a monolayer on the walls of the glass vessel, the geometry is approximately flat. The shrinking core model can be re-derived in Cartesian coordinates and, using the assumptions described above, predicts that the cymene concentration in the isooctane as a function of time is given by:
 | (6) |
 . Although the model ignores the gel shrinkage (which amplifies the release rate by reducing the diffusion path length) this result can be used to make an order-of-magnitude estimate of the effective diffusivity of cymene if Aint is known. The total surface area of the gel particles is 3.0 × 10⁻³ m2 (455 particles of 730-µm radius). Approximately half of that area will be occluded for particles attached to the wall, so Aint
∼ 1.5 × 10⁻³ m2. This corresponds to an effective diffusivity of approximately 10−9 m2 s−1, which is the order of magnitude expected for the diffusion of a small molecule through a macroporous gel matrix.25
5. Conclusions
Surfactant–polyelectrolyte gels can be used for controlled encapsulation and release of aromatic oils by forming particles from a gelled oil-in-water suspension. The release rates depend on the diffusivity and solubility of the oil in the gel matrix, and the swelling–collapse transitions in the gel. They are fastest where the oil diffusivity and solubility in the gel matrix is high, and where gel shrinkage occurs. All three properties depend on the receiving solution. When cymene is released into isooctane, the effective diffusivity is high and gel shrinkage occurs. Because its solubility in the aqueous gel matrix is low, however, the release rate is slow. When cymene is released into the 9 wt.% SDS–pentanol mixture, the surfactant enters the gel particles and solubilizes the cymene inside micelles, thereby raising the solubility of the oil in the receiving phase by three orders of magnitude. This effect gives rise to a more rapid release despite the dramatic two order-of-magnitude drop in the effective diffusivity of the encapsulated oil due to the large hydrodynamic diameter of the oil-loaded micelle with respect to a single cymene molecule. This suggests that the rate of oil release can be modulated by altering the surfactant solubilization properties and microstructure (e.g., cylindrical micelles will diffuse slower than the spherical SDS–pentanol micelles). Finally, when gel swelling–shrinking can be ignored (as in the SDS–pentanol mixture), the release process can be accurately modeled using the shrinking core model.Acknowledgements
The authors gratefully acknowledge K. Czymmek for confocal microscopy support and the INBRE P20 RR16472-04 grant for facilities.References
- C. Anchisi, A. M. Maccioni, C. Sinico and D. Valenti, Farmaco, 2001, 56, 427–431 CrossRef CAS.
- A. W. Yi, Y. H. Kim, I. C. Kwon, J. W. Chung, J. H. Park, Y. W. Choi and S. Y. Jeong, J. Conrolled Release, 1998, 50, 135–143 Search PubMed.
- P. Kan, X.-Z. Lin, M.-F. Hsieh and K.-Y. Chang, J. Biomed. Mater. Res. B, 2005, 75, 185–192 Search PubMed.
- M. E. Malone, I. A. M. Appelqvist, T. C. Goff, J. E. Homan and J. P. G. Wilkins, A Novel Approach to the Selective Control of Lipophilic Flavor Release in Low at Foods, in Flavor Release, ed. D. D. Roberts and A. J. Taylor, The American Chemical Society, Washington, 2000, Symposium Series Number 763, pp. 212–227 Search PubMed.
- M. E. Malone and I. A. M. Appelqvist, J. Conrolled Release, 2003, 90, 227–241 Search PubMed.
- Y. Lapitsky and E. W. Kaler, Colloids Surf., A, 2004, 250, 179–187 CrossRef CAS.
- V. G. Babak, E. A. Merkovich, L. S. Galbraikh, E. V. Shtykova and M. Rinaudo, Mendeleev Commun., 2000, 3, 94–95 CrossRef.
- M. R. Julia Ferres, P. Erra Serrabasa, I. Munoz Liron and A. Ayats Llorens, Es. Pat., 1998, 2112150 Search PubMed.
- Y. Lapitsky, W. J. Eskuchen and E. W. Kaler, Langmuir, 2006, 22, 6375–6379 CrossRef CAS.
- Y. Lapitsky and E. W. Kaler, Colloids Surf., A, 2006, 282–283, 118–128 CrossRef.
- P. S. Leung, E. D. Goddard, C. Han and C. J. Glinka, Colloids Surf., 1985, 13, 47–62 CrossRef CAS.
- I. S. Chronakis and P. Alexandridis, Macromolecules, 2001, 34, 5005–5018 CrossRef CAS.
- E. D. Goddard and R. B. Hannan, J. Colloid Interface Sci., 1976, 55, 73–79 CrossRef CAS.
- M. Goldraich, J. R. Schwartz, J. L. Burns and Y. Talmon, Colloids Surf., A, 1997, 125, 231–244 CrossRef CAS.
- J. Sjostrom and L. Piculell, Colloids Surf., A, 2001, 183–185, 429–448 CrossRef CAS.
- B. Philipp, H. Dautzenberg, K. J. Linow, J. Koetz and W. Dawydoff, Prog. Polym. Sci., 1989, 14, 91–172 CrossRef CAS.
- G. L. Rorrer, T. Y. Hsien and J. D. Way, Ind. Eng. Chem. Res., 1993, 32, 2170–2178 CrossRef CAS.
- B. L. Strand, Y. A. Morch, T. Espevik and G. Skjak-Braek, Biotechnol. Bioeng., 2003, 82, 386–394 CrossRef CAS.
- S. Yagi and D. Kunii, Chem. Eng. Sci., 1961, 16, 364–371 CrossRef CAS.
- S. Yagi and D. Kunii, Chem. Eng. Jpn, 1955, 19, 500–506 Search PubMed.
- O. Levenspiel, Chemical Reaction Engineering, Wiley, Hoboken, NJ , 1999, ch. 25, pp. 570–576 Search PubMed.
- E. F. Marques, O. Regev, A. Khan, M. G. Miguel and B. Lindman, Macromolecules, 1999, 32, 6626–6637 CrossRef CAS.
- D. Poncelet, R. J. Neufeld, M. F. A. Goosen, B. Burgarski and V. Babak, AICHE J., 1999, 45, 2018–2023 CrossRef CAS.
- D. J. Miller and S. B. Hawthorne, J. Chem. Eng. Data, 2000, 45, 78–81 CrossRef CAS.
- E. L. Cussler, Diffusion: Mass Transfer in Fluid Systems, Cambridge University Press, Cambridge, 1997, ch. 5, pp. 101–141 Search PubMed.
| This journal is © The Royal Society of Chemistry 2006 |
