Decarboxylation is a significant reaction pathway for photolabile calcium chelators and related compounds†
Andreas
Barth
a,
Stephen R.
Martin
b and
John E. T.
Corrie
*b
aDepartment of Biochemistry and Biophysics, Arrhenius Laboratories for Natural Sciences, Stockholm University, SE-106 91, Stockholm, Sweden
bNational Institute for Medical Research, The Ridgeway, Mill Hill, London, UK NW7 1AA. E-mail: jcorrie@nimr.mrc.ac.uk
First published on 1st December 2005
Abstract
Photolysis of amino acids that bear a 2-nitrobenzyl protecting group on the amino nitrogen involves a normal 2-nitrobenzyl-type photocleavage to release the amino acid but also a second mechanistic pathway, that appears to be initiated by single electron transfer from the amino group to the excited state of the nitroaromatic. The end result of this pathway is photodecarboxylation. Quantitative experiments suggest that this latter pathway can contribute between 10 and 80% of the total reaction flux in different compounds. It appears that the aminium radical, the first product of the single electron transfer, can be intercepted by certain amino acids, resulting in a transfer of decarboxylation to this “sacrificial” amino acid. Possible implications for precise details of calcium release from photolabile derivatives of EDTA and EGTA are discussed.
Introduction
Photolabile and biologically-inert precursors of bioactive compounds (often referred to as “caged compounds”) that can release bioactive compounds rapidly (µs–ms time scale) upon flash photolysis are useful tools for study of fast biological processes.1 Knowledge of the properties of such compounds, including data on the rate and efficiency of photolytic release, is important basic information that underpins any such biological investigation. As one example of problems that can occur, we and others have recently shown for 1-(2-nitrophenyl)ethyl caged alcohols that long-lived hemiacetal intermediates can retard the rate of product release by four orders of magnitude (at pH 7) relative to that expected from decay of the photo-generated aci-nitro species.2,3 Determination of photolysis stoichiometry, i.e. whether photolysis of each molecule of the caged compound liberates one molecule of the bioactive compound is also important, as unexpected side reactions can take place. For example, the decarboxylation that occurs during photolysis of photolabile N-sulfonyl derivatives of amino acids means that yields of intact amino acid from these compounds are very much lower than expected from the amount of starting material consumed.4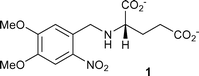
In this context of product stoichiometry, one of us observed some years ago that 1, which had been used5 as a photolabile precursor of the neuroactive amino acid L-glutamate, in fact released glutamate as only a small proportion of the amount expected from the extent of photolysis of the starting compound. The result was briefly mentioned in a review of caged compounds6 but was not further explained at the time. At the start of this study, and driven by our interest in time-resolved FTIR spectrometry to study photochemical mechanisms of caged compounds,2,7 we measured the IR difference spectrum for photolysis of 1 in neutral aqueous solution and observed the formation of a prominent peak at 2343 cm−1, consistent with a known absorption band of CO2 in aqueous solution.8 The difference spectrum is shown in the electronic supplementary information (ESI, Fig. S1†). The obvious interpretation of this result and the low measured stoichiometry of glutamate release is that a photodecarboxylation process takes place upon irradiation of 1. Although other parallel developments have since led to effective caged L-glutamate reagents,9 the observations with 1 carry the implication that similar, hitherto unrecognised photodecarboxylation might occur in widely-used photoactivated Ca2+ release agents such as DM-nitrophen 2 and NP-EGTA 3,10,11 both of which contain the same N-(2-nitrobenzyl)glycine substructure that is present in 1.
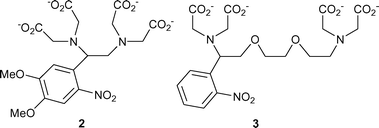
The accepted route for photolysis of these calcium chelators (Scheme 1) involves cleavage of the benzylic C–N bond, so splitting the EDTA or EGTA core into two iminodiacetate units and resulting in release of Ca2+ previously chelated by the intact molecule. This paper describes the results of our studies on the photolysis of these compounds and related models and includes an estimate of the extent of photodecarboxylation for DM-nitrophen.
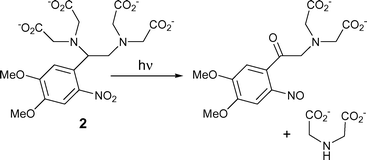 | ||
| Scheme 1 Overall reaction scheme for photolysis of DM-nitrophen 2, as expected for the conventional 2-nitrobenzyl cleavage process. | ||
Results
As the first stage of this study, we made an estimate of the stoichiometry of glutamate release from 1, by analysis as previously described for other caged glutamate derivatives,9i.e. by irradiating solutions of known concentration and quantifying the extent of photolysis by HPLC analysis, while in parallel measuring the concentration of glutamate in the irradiated solutions. Values obtained for released glutamate were in the range 18–22% of that expected from the extent of photolysis, implying that ∼80% of the reaction flux involves one or more pathways that do not release glutamate. We note that previous measurements of glutamate release, for example from 7-nitroindolinyl-caged derivatives, have shown quantitative release,9,12 so the analytical procedures used to obtain this estimate can be regarded as reliable. Whether the high proportion of the reaction flux that does not result in glutamate release can be solely attributed to the decarboxylation discussed above is not revealed by this measurement, but the poor glutamate stoichiometry does define the scope of the problem.In the light of these data, we determined IR difference spectra for photolysis of both DM-nitrophen 2 and NP-EGTA 3, in the presence or absence of saturating concentrations of Ca2+ and at neutral pH. In each case, the spectra showed a significant CO2 peak, which was 1.7-fold more intense for DM-nitrophen when Ca2+ was present. For NP-EGTA there was only a small difference between the presence and absence of Ca2+, but slightly less CO2 was formed when Ca2+ was present. Fig. 1 shows a comparison of the spectra with and without Ca2+ for DM-nitrophen, in which positive bands represent entities that are formed as a result of photolysis whereas negative bands represent entities that disappear from solution. Apart from the strong positive band for CO2 at 2343 cm−1, as discussed above, the other strongest bands are the negative ones at 1579 cm−1 (without Ca2+) or 1584 cm−1 (with Ca2+) from antisymmetric stretch of a carboxylate group and the band at 1524 cm−1 which is the antisymmetric stretch of the nitro group. While disappearance of the nitro group is expected as a consequence of the canonical mechanism (Scheme 1), the negative carboxylate bands that are unaccompanied by a corresponding positive band under either set of conditions suggest that a carboxylate group disappears from the solution as a result of photolysis. The negative carboxylate band is larger in the presence of Ca2+, in line with the higher CO2 yield under the latter conditions.
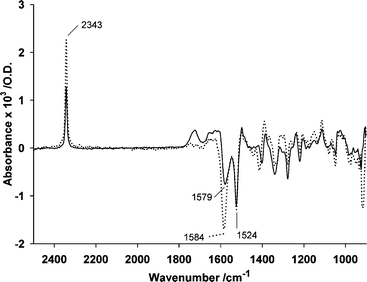 | ||
| Fig. 1 IR difference spectra for photolysis of DM-nitrophen 2 determined in the absence (—) and presence (⋯) of Ca2+. The data are averaged from spectra recorded after a single flash on each of 3 replicate solutions that contained 44 mM DM-nitrophen in 500 mM MOPS, pH 7 ± 200 mM CaCl2 (in H2O), 20 °C, and cover a time interval 0–3.4 s after the light flash. | ||
Overall, the spectra for NP-EGTA were less intense than for DM-nitrophen (data not shown), in keeping with the lower photosensitivity of the former compound. The lower photosensitivity of 3 was confirmed in comparative 350 nm irradiations (Rayonet Photochemical Reactor) of the two chelators in separate pH 7 solutions of equal concentration, that showed 43% photolysis of DM-nitrophen after 20 s and 49% photolysis of NP-EGTA after 65 s, indicating that 2 is approximately 3-fold more photosensitive than 3 under typical photolysis conditions. Dithiothreitol was included in the photolysis solution to reduce nitroso compounds formed by photolysis. This is necessary to avoid the build up of absorbance in the 300–350 nm region from the nitroso products, which would otherwise invalidate the comparison. The extent of photolysis for each compound was assessed by anion-exchange HPLC (see Experimental section).
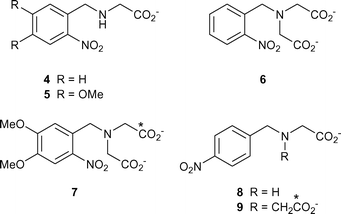
The results to this point suggest that some level of photodecarboxylation is a general behaviour for compounds that contain the N-(2-nitrobenzyl)glycine structural motif and we investigated several model compounds to confirm this (see structures 4–9). As well as N-(2-nitrobenzyl)glycine 4 itself and its 4,5-dimethoxy analogue 5, two iminodiacetate derivatives 6 and 7 were synthesised, that are hemi-analogues of the calcium chelators 2 and 3. To gain insight on the role of the ortho-nitro group, we also synthesised the two para-nitro compounds 8 and 9. For reasons discussed below, two of the iminodiacetate compounds (7 and 9) were synthesised with one of their carboxylate groups labelled by 13C at 99% isotopic enrichment, as indicated by asterisks on the relevant carbon atoms in the structural drawings. Preparation of all these compounds was readily effected by alkylation of glycine ethyl ester with the appropriate nitrobenzyl bromide. For the isotopic compounds we used [1-13C]glycine ethyl ester, and the second, non-isotopic carboxymethyl side chain of the iminodiacetate derivatives was introduced from ethyl bromoacetate (see Experimental section and ESI†). Alkaline hydrolysis of the ethyl ester group(s) followed by anion-exchange chromatography then gave the required compounds.
As with the calcium chelators 2 and 3, the IR difference spectra recorded upon flash photolysis for all these compounds showed formation of CO2 with either one band at 2343 cm−1 or, for the mono-isotopic iminodiacetates 7 and 9, a pair of bands of near-equal intensity at 2343 and 2278 cm−1, of which the latter closely corresponds to values of 2282 cm−1 determined for [13C]CO2 (as a frozen cluster with water)13a and 2278 cm−1 (for the amorphous solid at 10 K).13b The observation of [13C]CO2 is unequivocal evidence that the CO2 seen in these spectra is derived from the photolysed compounds rather than having some artefactual origin from atmospheric CO2. The bands at 2343 and 2278 cm−1 diminished with time, consistent with the expected14 hydration of CO2 and as observed recently by us in a related flash photolysis-IR study.15 In all cases, including those of the two para-substituted compounds 8 and 9, the spectra showed a negative band at 1525–1530 cm−1, consistent with the disappearance of a nitro group. Formation of CO2 from the two para-substituted compounds, which cannot undergo the conventional 2-nitrobenzyl rearrangement, suggests that the overall photodecarboxylation process from all these compounds proceeds via a common mechanism. This involves a transformation of the nitro group and, for the ortho-nitro compounds, evidently operates in parallel with the “normal” photocleavage analogous to that shown in Scheme 1.
These qualitative results confirm the generality of the observed photodecarboxylation of the chelators 2 and 3. To obtain further insights we carried out quantitative photolysis of the ortho- and para-nitrobenzyl glycines 4 and 8. These experiments were monitored by HPLC and amino acid analysis, as described above for 1, and showed that the para-compound 8 was almost 3-fold more photosensitive than 4. The latter compound released ∼64% of the glycine that was expected from the amount that was photolysed: this value relates to solutions that contained 10 mM dithiothreitol. In the absence of the thiol, measured glycine values were lower by about one-third, presumably because the 2-nitrosobenzaldehyde by-product of the conventional photolysis pathway reacts to some extent with the released glycine. Reduction of the nitrosoaldehyde evidently blocked this reaction. Similar sequestration of photoreleased amines and amino acids was previously observed by Patchornik and co-workers, and was eliminated by incorporation of reagents that blocked the nitrosoaldehyde.16,17 In contrast to the results with 4, the para-substituted compound 8 released no detectable glycine, as expected from its inability to undergo 2-nitrobenzyl-type photocleavage. Its photolysis must involve different chemistry.
An unexpected aspect of the photodecarboxylation was revealed by the mono-isotopic iminodiacetate derivatives 7 and 9. All the data described above were obtained in solutions buffered at pH 7 by 3-(N-morpholino)propane-1-sulfonate (MOPS), but we also recorded some spectra of 7 in solutions buffered by N-(2-acetamido)iminodiacetate (ADA), also at pH 7. Our initial motivation was to look for pH changes that would be visible in the IR spectra from changes in buffer protonation state, as observed in previous examples where buffers bearing carboxylate groups were used.2,18 In practice, the striking result was a dramatic change in the intensity ratio of the normal and isotopic CO2 bands. Fig. 2 shows the relevant region of the difference spectra for photolysis of 7 recorded in either MOPS or ADA buffers, each at 200 mM concentration. In the MOPS spectrum, the ratio of the areas of the 12C and 13C bands at 2343 and 2278 cm−1 respectively was 1.09 : 1, whereas in the ADA spectrum, the ratio was ∼14 : 1. Details of the integration procedure are given in the Experimental section. Further experiments used a mixture of ADA and MOPS in varying proportions, with the total buffer molarity kept at 200 mM. These data (Table 1) show a gradual reduction in the excess of [12C]CO2 as the proportion of ADA decreased, although an effect was still detectable with only 5 mM ADA. Experiments were also conducted with other carboxylates: 200 mM acetate in 200 mM MOPS, pH 7 had no effect on the isotopic ratios of photogenerated CO2, nor did 200 mM glycine under these conditions. At pH 10, the presence of 200 mM glycine did result in decreased [13C]CO2 but the measurement was difficult to quantify accurately because rapid hydration of CO2 under these conditions reduced the intensity of the CO2 bands. Ethylenediaminetetraacetate (EDTA) at 200 mM was ∼2-fold less effective than ADA at the same concentration in suppressing the formation of [13C]CO2 (Table 1). The para-nitrobenzyliminodiacetate 9, that also had one of its carboxylates labeled with carbon-13, showed qualitatively similar effects with ADA and EDTA, although the overall effect of either compound was less marked than for 7. For example, the 12C to 13C ratio in the presence of 200 mM ADA, pH 7 was 2.9 : 1, an effect that was almost 5-fold less than for 7. The likely mechanism underlying these observations is discussed below.
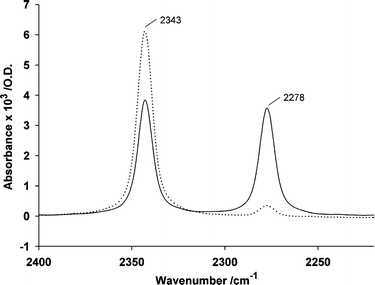 | ||
| Fig. 2 IR difference spectra for photolysis of 7 (90 mM) in 200 mM buffers of MOPS (—) or ADA (⋯) at pH 7, recorded in the time interval 0–3.4 s after the light flash. The spectra are for single samples under each set of conditions and were normalised to the intensity of the antisymmetric stretching vibration of the nitro band at 1531 cm−1. | ||
The final experimental measurements aimed to quantify the extent to which decarboxylation contributes to the overall reaction flux for one of the compounds studied here and focused on DM-nitrophen 2, since this is one of the most widely-used compounds for photorelease of Ca2+. Several methods were investigated, based on IR spectra of photolysis in the presence of standard compounds, such as 4-nitrophenylacetate,19 that also undergo photodecarboxylation. However, these methods required a range of assumptions, and we eventually chose instead to carry out titrations of a photolysed reaction mixture with Ca2+. The aim was to detect and quantify a species that had lost only one of the chelating acetate groups of DM-nitrophen and which would have considerably higher Ca2+ affinity than the iminodiacetate products shown in Scheme 1. The rationale for this is discussed below.
Titrations were carried out with the calcium indicator 5-nitro-BAPTA20 and all solutions were buffered at pH 7.0 with 10 mM MOPS. Under these conditions, the indicator had Kd 5.25 ± 0.51 µM (S.D., n = 3): both tighter and weaker Kd values have been reported under different conditions and previous workers have commented upon strong effects of solution conditions for this calcium indicator.20–22 The Ca2+ affinity of the indicator is considerably lower than that of DM-nitrophen, but much higher than that of the canonical photoproducts. Thus in Ca2+ titrations with 5-nitro-BAPTA, DM-nitrophen will lead to an offset of the titration curve, compounds with comparable affinity will modify it and those with much lower affinity will not be detected. Control titrations in the presence of iminodiacetate (IDA) or unphotolysed DM-nitrophen confirmed that neither of these species perturbed the calcium titration of the indicator (see ESI, Fig. S2†) for a titration in the presence of IDA), with the exception that the indicator does not respond until all DM-nitrophen present has been saturated with Ca2+. In contrast, titrations in the presence of the pentadentate chelator N-methyl-ethylenediaminetriacetic acid23 (MEDTA) caused obvious perturbation (see ESI, Fig. S2†). A Kd value of 8.24 ± 0.82 µM (S.D., n = 3) was derived from these results, which is compatible with a reported value of 12.2 µM (at pH 8 in 20 mM MOPS).23b Details of the calculation method are given in the ESI.†
These experiments established two main points: first, that intact DM-nitrophen can be quantified from the concentration of Ca2+ that is added to reach the point at which the indicator begins to respond and second, that species with Kd values in the region of 10 µM can be readily detected. Accordingly, a solution of DM-nitrophen was irradiated and the extent of photolysis was determined as 60% by anion-exchange HPLC. Calcium titration as above gave a similar value (63.7 ± 1.3%; S.D., n = 3) for the extent of photolysis (Fig. 3A) and also showed the presence of a species with a dissociation constant close to that of 5-nitro-BAPTA (Fig. 3B). Fitting the titration data, using the formalism set out in the ESI,† gave Kd 7.7 ± 1.4 µM (S.D., n = 3) for this species, which was present as 9.7 ± 1.4% (S.D., n = 3) of the overall amount of photolysed material. This value is that found for photolysis in the absence of calcium, and the IR data described above showed that the extent of decarboxylation was 1.7-fold greater in the presence of saturating calcium. Thus the maximum proportion of the reaction proceeding by this route for Ca2+-saturated DM-nitrophen can be estimated as 16.5%. We have not attempted to do similar titration measurements for NP-EGTA 3 because the high cost of the reagent made this prohibitive.
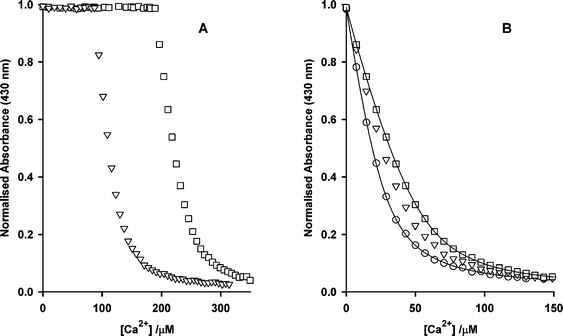 | ||
| Fig. 3 Calcium titrations of 27.5 µM 5-nitro-BAPTA in the presence of photolysed DM-nitrophen. (A) Data points correspond to DM-nitrophen concentrations prior to photolysis of 252.7 µM (▽) or 480.8 µM (□). The horizontal sections at the start of the titrations represent the concentration of intact DM-nitrophen present after the partial photolysis. (B) Expanded section of (A), offset to show only the response of 5-nitro-BAPTA. A titration of 5-nitro-BAPTA alone is shown (○) and other symbols are as in (A). The lines are examples of fits to the relevant data points, based on the equations shown in the ESI.† Data from these titrations were combined to give the values described in the text. | ||
Discussion
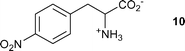
The results described above have two principal features for discussion. One is the mechanism of the hitherto undocumented decarboxylation of these compounds upon photolysis and the other is the effect of particular buffer or related salts on the course of decarboxylation. Photodecarboxylations have been reported for a wide range of compounds and aspects of the topic have been regularly reviewed.24 In the present case, the closest precedent for the decarboxylation can be found in a study of the photolysis of 4-nitrophenylalanine 10. On irradiation, this compound lost CO2 and formed 4-nitrosophenylacetaldehyde as the primary product, although this was transformed to 4-aminobenzaldehyde by secondary dark reactions.25 The decarboxylation was proposed to be initiated by single electron transfer from the amino group to the triplet excited state of the nitroaryl group. A similar process had been described earlier to explain photodecarboxylation of N-(2,4-dinitrophenyl)amino acids, albeit with a less plausible mechanistic interpretation.26 Extension of the electron transfer mechanism to any of the compounds studied here gives the process shown in Scheme 2 (exemplified for the model compound 4).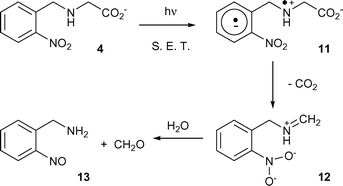 | ||
| Scheme 2 Proposed single electron transfer mechanism for photodecarboxylation of N-nitrobenzyl amino acids, as exemplified for 4. The route would apply also to para-nitro compounds. | ||
An alternative mechanism could be considered, involving direct electron transfer from the carboxylate anion of 4 to the excited state of the nitrobenzyl group. The species so produced could in principle lead to the same Schiff base 12 by decarboxylation and electronic reorganisation. However, we have previously studied both 2-nitrobenzyloxyacetate (the oxy analogue of 4) and its α-methyl homologue [1-(2-nitrophenyl)ethoxy]acetate] and observed essentially no photodecarboxylation,2 so this route seems unlikely to be significant. It thus appears that the amino group in the side chain of all these compounds has a key role in mediating the electron transfer process.
The related reaction to that of Scheme 2 for the Ca2+ chelators would give as its product a pentadentate species such as 14 or the isomeric 15 (from 2). Formation of either 14 or 15, or a mixture of the two, is evidently possible since the amino nitrogen that initiates the overall process shown in Scheme 2 can be situated either on the α-(as in all the model compounds studied here) or β-carbon (as in the previous example of compound 10) relative to the nitroaromatic ring. This possibility of different locations for the amino substituent implies that another widely used Ca2+ photorelease agent, DMNPE-4 16,28 is also likely to undergo decarboxylation to some extent during photolysis. The calcium titrations reported above provide definitive evidence for the formation of one or more species with Kd values in the 10 µM range, that can only realistically be accommodated by pentadentate species such as 14 and 15.
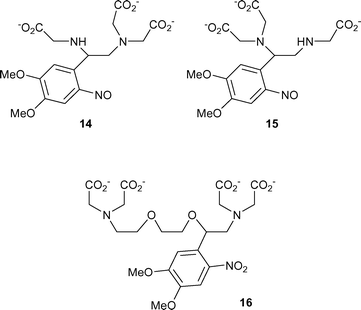
The process shown in Scheme 2 also accommodates a plausible mechanism for the observed efficient interception of the decarboxylation process by ADA or EDTA. Tertiary amines are well known as excellent one-electron donors to a range of singlet and triplet species, usually at rates close to the diffusion limit.29 It is therefore reasonable that the initial aminium radical could accept an electron from the tertiary amino group of ADA or EDTA (in both of which compounds the amino group(s) will be partially deprotonated at pH 7). Such an electron transfer would return the aminium radical of 11 and its related compounds to an even-electron state and thus would prevent the decarboxylation process. The resulting species would be the radical anion 17 and a new aminium radical such as 18 from ADA or a related species from EDTA. In fact, EDTA has been previously used as a sacrificial single electron donor, for example in photoreduction of polymer-bound methyl viologen30a or of metalloporphyrins.30b In complexes with various metal ions, EDTA has also been reported to lose one of its carboxylate groups upon photolysis as a result of similar electron-transfer chemistry.31 Comparable photodegradation of ADA has not been reported although a closely-related oxidative decarboxylation has been described.32
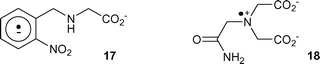
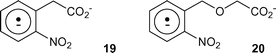
In the context of this discussion, it should be noted that interception of an initial aminium ion in the case of the calcium chelators 2 or 3 will not promote the normal photolysis pathway but merely suppresses the decarboxylation of these compounds. The fraction of the compounds reacting by this non-canonical decarboxylation route is simply diverted to a radical anion analogous to 17 and the eventual fate of Ca2+ bound to such a species is uncertain. Indeed, we have previously studied a range of radical anions derived from 2-nitrobenzyl compounds, produced either by photolysis or more cleanly by chemical means with alkaline dithionite.33 Among the species reported were the radical anions 19 and 20 from 2-nitrophenylacetate and 2-nitrobenzyloxyacetate respectively, which had lifetimes similar to those of a range of other nitro radical anions that did not bear a carboxylate group in their side chain. Thus it appears that radical anions of this general type do not decarboxylate, so loss of CO2 from 17 and related species would not be expected. In contrast, the newly-formed aminium radical 18 or the related species from EDTA should undergo the decarboxylation normally observed for such species.27 The effect for compounds such as 7 and 9, where equal amounts of [12C]CO2 and [13C]CO2 are formed upon photolysis in MOPS buffer, will be to perturb this isotopic product ratio in favour of the 12C isotope when a compound such as ADA or EDTA is present. This is because some of the decarboxylation takes place instead from the isotopically-unlabelled ADA or EDTA, to an extent that depends on the concentration of the “sacrificial” compound.
A final point of interest with respect to the single electron transfer processes from ADA or EDTA to aminium radicals such as 11 is the apparent failure of MOPS, also a tertiary amine, to act in the same way as an electron donor and so to quench the decarboxylation that takes place from 11 and related species. Evidence that MOPS does not take part in such processes came from a comparison of the IR difference spectra for photolysis of DM-nitrophen 2 recorded in solutions of either MOPS or sodium phosphate, both at the same buffer concentration and at pH 7. These spectra were identical in intensity and in all features above ∼1200 cm−1 (data not shown). Below this frequency, there were some changes owing to altered phosphate protonation but these are not relevant to the extent or pathway of photolysis of DM-nitrophen. Thus both quantitatively and qualitatively, photolysis of 2 appears to be the same in both buffers. We assume that the transfer of an electron from MOPS to aminium radicals such as 11 must be thermodynamically disfavoured, in contrast to transfer from ADA or EGTA where the newly formed aminium species is structurally (and therefore thermodynamically) similar to the initial species 11. Differences in the electron donating capacity of different tertiary amines leading to different photochemical outcomes have been noted previously.34 In particular, EDTA was reported to be a stronger electron donor than triethanolamine: the latter compound has obvious similarity to MOPS.
Conclusions
The data presented above have two principal messages that are relevant to the use of 2-nitrobenzyl compounds as photolabile species. First, protection of the amino group of amino acids by any form of 2-nitrobenzyl group, whether in synthetic chemistry or as a caged precursor, is likely to suffer from reduced product yield in the photocleavage reaction because of the non-canonical side reaction of decarboxylation. The evidence presented here indicates that between 10 and 80% of the reaction flux for these compounds may proceed via the decarboxylation pathway but the structural features that control the variable extent to which this pathway operates remain unclear. Second, in the specific case of the Ca2+ chelating agents 2 and 3, it is evident that a proportion of the hexadentate starting compound is transformed to a pentadentate product, exemplified by 14/15, rather than to the tridentate iminodiacetate fragments expected from canonical 2-nitrobenzyl cleavage. Data for model compounds analogous to 14/15 indicate that the pentadentate compound would have a calcium affinity ∼4 orders of magnitude lower than the intact, hexadentate chelators23a and the calcium titrations of photolysed 2 confirmed this. In contrast, the tridentate iminodiacetate products of canonical photocleavage have calcium affinity ∼8 orders of magnitude lower than the intact chelators.23a The formation of a proportion of 14/15 (or their analogues from 3) is likely to affect the change in [Ca2+] when calcium-loaded 2 or 3 are photolysed. Naturally, this was not considered in an earlier attempt to model these transients.35 In an extreme case, the use of a high concentration of ADA buffer could be expected to blunt the release of Ca2+, since the chelator would be protected from loss of one of its carboxylate side chains by the decarboxylation process and instead converted to a hexadentate radical anion analogous to 17. Of course, that proportion of the photolysis that proceeds by the normal 2-nitrobenzyl cleavage pathway would remain unperturbed under these conditions. A detailed study of the effects of the decarboxylation pathway on the specific question of calcium release from photolabile chelators such as 2 and 3 is beyond the scope of the present work.Although the Ca2+ titration data for DM-nitrophen are definitive in identifying and quantifying the pentadentate species, we note that attempted quantification of the extent of decarboxylation of both 1 and 2 by methods based on the IR spectra for photolysis of these compounds consistently gave higher results by a 2- to 3-fold factor. Several reasons could be responsible for this, including trivial possibilities such as the much higher concentration of the IR samples and different light source, but also aspects of the IR spectra themselves. We therefore cannot be certain that the pentadentate species identified from DM-nitrophen is the only product of decarboxylation and suggest that the quantitative measure described here is taken as a lower limit for the extent to which decarboxylation contributes to the reaction flux. More rigorous estimates would probably depend on an accurate mass balance of all photoproducts but this would be a very difficult task. Our results nevertheless provide an alert to the fact of the decarboxylation reaction and may stimulate further investigation.
Experimental
General
1H NMR spectra were determined on JEOL FX90Q or Varian Unityplus 500 spectrometers in D2O solution with acetone as internal reference, unless otherwise specified. Merck type 9385 silica gel was used for flash chromatography. Analytical HPLC was performed on Merck Lichrospher 250 × 4 mm RP8 (reverse-phase) or Whatman Partisphere 4.6 × 125 mm SAX (anion-exchange) columns with mobile phases as specified in the text. Flow rates were 1.5 mL min−1. Amino acid analyses were performed on an LKB 4151 Alpha Plus amino acid analyser with ninhydrin detection at the Department of Biochemistry, University of Cambridge.DM-nitrophen, NP-EGTA and 5-nitro-BAPTA were purchased from Molecular Probes, Eugene, OR, USA [1-13C]Glycine (99% isotopic content) was purchased from Cambridge Isotope Laboratories, Andover, MA and was converted to the ethyl ester (as its hydrochloride) by standard Fisher-Spier esterification. MEDTA was synthesised as described.23b Other reagents for synthesis were from Sigma-Aldrich. Synthetic details for compounds 1 and 7 are given below. Methods for compounds 4–6, 8 and 9 are described in the ESI.†
The above diester (333 mg, 0.87 mmol) was suspended in a mixture of EtOH (8.5 mL) and 2 M aq. NaOH (4.3 mL) and kept at room temperature overnight, then diluted with water (50 mL) and adjusted to pH 7 with dilute HCl. This solution was purified by chromatography on DEAE cellulose (column as for 1 above), eluted with a 10–250 mM linear gradient of TEAB. Fractions were analysed by anion-exchange HPLC [mobile phase, 10 mM Na phosphate, pH 5.5–acetonitrile (9 : 1 v/v)], tR 2.2 min. Fractions containing 7 were pooled, processed as described above for 1 and quantified by absorption spectroscopy at 349 nm (using ε349 5100 M−1 cm−1 determined above for the diester). The recovery was 0.85 mmol and a portion was converted to the Na+ salt (Dowex 50, H+ form); HRMS (positive ion ESI) (m/z): found: 330.0994; calcd for (12C1213C1H17N2O8)+ 330.0979; 1H NMR (δ, 500 MHz, D2O + DCl, acetone ref.): 7.91 (1H, s, Ar-H5), 7.26 (1H, s, Ar-H2), 4.89 (2H, s, ArCH2), 4.37 (2H, s, CH2CO2) superimposed on 4.37 (2H, d, 2J13C,H = 5.7 Hz, CH213CO2), 3.99 (3H, s, OMe), 3.97 (3H, s, OMe).
Quantitative photolysis experiments
(a) A solution of 1 (1.0 mM) in 25 mM Na phosphate, pH 7.0 plus 5 mM dithiothreitol was irradiated in a 1 mm path length cuvette, using a Rayonet RPR-100 photochemical reactor (16 × 350 nm lamps). Solutions at time zero and after irradiation for 60 or 90 s were analysed by reverse-phase HPLC [mobile phase 10 mM potassium phosphate, pH 5.6–MeOH (100 : 15 v/v)], tR 3.2 min for 1. The extent of photolysis was determined by comparison of peak heights with that of the non-irradiated control solution and the concentration of free glutamate was determined by quantitative amino acid analysis.Similar experiments were performed for compounds 4 and 8, as 1 mM solutions in 20 mM MOPS, pH 7 ± 10 mM dithiothreitol. The solutions of 4 were irradiated for 8 min (∼45% photolysis) and those of 8 were irradiated for 1 min (∼25% photolysis). The extent of photolysis was determined as above by reverse-phase HPLC [mobile phase 25 mM Na phosphate, pH 6–acetonitrile (20 : 1 v/v) for 4 and 25 mM Na phosphate, pH 6–acetonitrile (9 : 1 v/v) for 8]. Retention times in these systems were 5.0 and 4.8 min for 4 and 8 respectively. The samples were also analysed for glycine by quantitative amino acid analysis.
(b) Solutions of DM-nitrophen 2 and NP-EGTA 3 (each 0.51 mM) in 20 mM MOPS, pH 7 with 5 mM dithiothreitol were irradiated as above and the extent of photolysis was quantified by anion-exchange HPLC. Mobile phases were 15 mM Na phosphate, pH 6 plus 2 mM EDTA–MeCN (9 : 1) for 2 and 10 mM Na phosphate, pH 6 plus 2 mM EDTA without acetonitrile for 3. Retention times were 15.2 min and 5.6 min for 2 and 3 respectively in the relevant mobile phases. The presence of EDTA and prolonged equilibration of mobile phase with the HPLC column were both necessary to obtain reproducible, well-shaped peaks.
Infrared spectroscopic measurements
Infrared difference spectra were recorded as described previously,37 in buffers made by adjusting solutions of MOPS or ADA at the required molarity with 3 M NaOH to pH values specified in the text. Qualitative spectra and those recording differing ratios of normal and isotopic CO2 were recorded in 200 mM buffers. Spectra showing CO2 release in Fig. 1 and Fig. S1† were recorded in 500 mM buffer to ensure that the pH of the solution was not significantly perturbed by photolysis.Evaluation of CO2 bands was performed by integration of peak areas between 2370 and 2305 cm−1 for [12C]CO2 and between 2305 and 2250 cm−1 for [13C]CO2 with respect to a baseline drawn between two points at either side of the bands. These were obtained by averaging data points between 2450 and 2400 cm−1 and between 2225 and 2175 cm−1 using method “E” for integration of band areas in the Bruker OPUS software.
The band area of the antisymmetric stretching band of the nitro group near 1530 cm−1 used for normalisation of spectra was determined from fitting the difference spectra between 1600 and 1490 cm−1 with bands of mixed Gaussian and Lorentzian line shapes, using the Bruker OPUS software.
Calcium titrations
All titrations were performed in 10 mM MOPS, pH 7.0 using 10 mm path length microcuvettes, equilibrated at 18 °C. Absorbance was monitored at 430 nm on a Beckman DU 640 spectrophotometer. Concentrations of iminodiacetic acid and MEDTA were determined from weighed quantities of solid. The concentration of 5-nitro-BAPTA was determined from the published extinction coefficient (ε340 6000 M−1 cm−1 in the presence of saturating calcium21) and all titrations were performed with 27.5 µM indicator. Calcium chloride solutions were prepared by dilution from a concentrated volumetric standard.For the titrations of DM-nitrophen, a stock solution in 10 mM MOPS, pH 7 was diluted to ∼0.1 mM and its UV-visible absorption spectrum was recorded. 5-Nitro-BAPTA was added (final concentration as above), followed by aliquots of Ca2+ solution. The concentration of added calcium required to begin titrating the indicator corresponds to the concentration of DM-nitrophen, from which an absorbance coefficient of 4230 M−1 cm−1 at 348 nm was calculated (lit.10 4300 M−1 cm−1). The close agreement of these values is a useful check on the experimental methods.
For the photolysis experiment, 600 µl aliquots of a solution of DM-nitrophen (0.5 mM) in 10 mM MOPS, pH 7 with 2 mM dithiothreitol were irradiated for 25 s in two 2 × 10 mm cuvettes (Rayonet reactor, as above) and the combined aliquots were analysed by anion exchange HPLC [as above, but with a modified mobile phase of 25 mM Na phosphate and 2 mM EDTA, pH 6–MeCN (9 : 1 v/v)]. The retention time of intact DM-nitrophen was 10.7 min. The extent of photolysis was estimated as 60% by comparison of peak heights of photolysed and control samples. Calcium titrations, as above, were carried out on diluted solutions of the photolysed material, corresponding to initial DM-nitrophen concentrations of 480.9 or 252.7 µM.
Acknowledgements
We are grateful to Professor P. Wan for helpful discussions and Dr V.R.N. Munasinghe for NMR measurements. We thank the MRC Biomedical NMR Centre for access to facilities, the Knut och Alice Wallenbergs Stiftelse for funding the infrared spectrometer and Professor W. Mäntele for providing laboratory facilities during the initial part of this work. This work was supported in part by a Royal Society ESEP grant.References
- (a) Caged Compounds, in Methods in Enzymology, ed. G. Marriott, Academic Press, New York, 1998, vol. 291, Search PubMed; (b) A. P. Pelliccioli and J. Wirz, Photoremovable protecting groups: reaction mechanisms and applications, Photochem. Photobiol. Sci., 2002, 1, 441–458 RSC; (c) J. E. T. Corrie and D. R. Trentham, Caged nucleotides and neurotransmitters, in Bioorganic Photochemistry, ed. H. Morrison, Wiley, New York, 1993, vol. 2, pp. 205–243 Search PubMed; (d) Dynamic Studies in Biology, ed. M. Goeldner and R. S. Givens, Wiley-VCH, Weinheim, 2005 Search PubMed.
- J. E. T. Corrie, A. Barth, V. R. N. Munasinghe, D. R. Trentham and M. C. Hutter, Photolytic cleavage of 1-(2-nitrophenyl)ethyl ethers involves two parallel pathways and product release is rate limited by decomposition of a common hemiacetal intermediate, J. Am. Chem. Soc., 2003, 125, 8546–8554 CrossRef CAS.
- (a) Y. V. Il'ichev, M. A. Schwörer and J. Wirz, Photochemical reaction mechanisms of 2-nitrobenzyl compounds: methyl ethers and caged ATP, J. Am. Chem. Soc., 2004, 126, 4581–4595 CrossRef CAS; (b) B. Hellrung, Y. Kamdzhilov, M. Schwörer and J. Wirz, Photorelease of alcohols from 2-nitrobenzyl ethers proceeds via hemiacetals and may be further retarded by buffers intercepting the primary aci-nitro intermediates, J. Am. Chem. Soc., 2005, 127, 8934–8935 CrossRef CAS.
- G. Papageorgiou and J. E. T. Corrie, Synthetic and photochemical studies of N-arenesulfonyl amino acids, Tetrahedron, 1999, 55, 237–254 CrossRef CAS.
- E. A. Schwartz and M. Tachibana, Electrophysiology of glutamate and sodium cotransport in a glial cell of the salamander retina, J. Physiol., 1990, 426, 43–80 CAS.
- J. E. T. Corrie and D. R. Trentham, Caged nucleotides and neurotransmitters, in Bioorganic Photochemistry, ed. H. Morrison, Wiley, New York, 1993, vol. 2, p. 262 Search PubMed.
- A. Barth, J. E. T. Corrie, M. J. Gradwell, Y. Maeda, W. Mäntele, T. Meier and D. R. Trentham, Time-resolved infrared spectroscopy of intermediates and products from photolysis of 1-(2-nitrophenyl)ethyl phosphates: reaction of the 2-nitrosoacetophenone by-product with thiols, J. Am. Chem. Soc., 1997, 119, 4149–4159 CrossRef CAS.
- F. S. Parker, Applications of Infrared Spectroscopy in Biochemistry, Biology and Medicine, Plenum, New York, 1971, p. 365 Search PubMed.
- (a) G. Papageorgiou, D. C. Ogden, A. Barth and J. E. T. Corrie, Photorelease of carboxylic acids from 1-acyl-7-nitroindolines in aqueous solution: rapid and efficient photorelease of L-glutamate, J. Am. Chem. Soc., 1999, 121, 6503–6504 CrossRef CAS; (b) G. Papageorgiou and J. E. T. Corrie, Effects of aromatic substitution on the photocleavage of 1-acyl-7-nitroindolines, Tetrahedron, 2000, 56, 8197–8205 CrossRef CAS.
- J. H. Kaplan and G. C. R. Ellis-Davies, Photolabile chelators for the rapid photorelease of divalent cations, Proc. Natl. Acad. Sci. U. S. A., 1988, 85, 6571–6575 CAS.
- G. C. R. Ellis-Davies and J. H. Kaplan, Nitrophenyl-EGTA, a photolabile chelator that selectively binds Ca2+ with high affinity and releases it rapidly upon photolysis, Proc. Natl. Acad. Sci. U. S. A., 1994, 91, 187–191 CAS.
- G. Papageorgiou, D. Ogden and J. E. T. Corrie, An antenna-sensitized nitroindoline precursor to enable photorelease of L-glutamate in high concentrations, J. Org. Chem., 2004, 69, 7228–7233 CrossRef CAS.
- (a) F. Fleyfel and J. P. Devlin, FT-IR spectra of CO2 clusters, J. Phys. Chem., 1989, 93, 7292–7294 CrossRef CAS; (b) M. Kalk, Amorphous solid carbon dioxide, J. Chem. Phys., 1987, 86, 560–564 CrossRef.
- C. Ho and J. M. Sturtevant, The kinetics of hydration of carbon dioxide at 25°, J. Biol. Chem., 1963, 238, 3499–3501 CAS.
- G. Papageorgiou, A. Barth and J. E. T. Corrie, Flash photolytic release of alcohols from photolabile carbamates or carbonates is rate-limited by decarboxylation of the photoproduct, Photochem. Photobiol. Sci., 2005, 4, 216–220 RSC.
- A. Patchornik, B. Amit and R. B. Woodward, Photosensitive protecting groups, J. Am. Chem. Soc., 1970, 92, 6333–6335 CrossRef CAS.
- B. Amit, U. Zehavi and A. Patchornik, Photosensitive protecting groups of amino sugars and their use in glycoside synthesis. 2-Nitrobenzyloxycarbonylamino and 6-nitroveratryloxycarbonylamino derivatives, J. Org. Chem., 1974, 39, 192–196 CrossRef.
- A. Barth and J. E. T. Corrie, Characterization of a new caged proton capable of inducing large pH jumps, Biophys. J., 2002, 83, 2864–2871 CrossRef CAS.
- (a) J. D. Margerum and C. T. Petrusis, The photodecarboxylation of nitrophenylacetate ions, J. Am. Chem. Soc., 1969, 91, 2467–2472 CrossRef CAS; (b) P. Wan and S. Muralidharan, Structure and mechanism in the photo-retro-aldol type reactions of nitrobenzyl derivatives. Photochemical heterolytic cleavage of C-C bonds, J. Am. Chem. Soc., 1988, 110, 4336–4345 CrossRef CAS.
- R. Pethig, M. Kuhn, R. Payne, E. Adler, T. H. Chen and L. F. Jaffe, On the dissociation constants of BAPTA-type calcium buffers, Cell Calcium, 1989, 10, 491–498 CrossRef CAS.
- M. D. Rand, A. Lindblom, J. Carlson, B. O. Villoutriex and J. Stenflo, Calcium binding to tandem repeats of EGF-like modules. Expression and characterization of the EGF-like modules of human Notch-1 implicated in receptor-ligand interactions, Protein Sci., 1997, 6, 2059–2071 CrossRef CAS.
- L. Masino, S. R. Martin and P. M. Bayley, Ligand binding and thermodynamic stability of a multidomain protein, calmodulin, Protein Sci., 2000, 9, 1519–1529 CrossRef CAS.
- (a) A. E. Martell and R. M. Smith, Critical Stability Constants, Plenum, New York, 1974, vol. 1, pp. 116, 198 and 204 Search PubMed; (b) T. Christensen, D. M. Gooden, J. E. King and E. J. Toone, Additivity and the physical basis of multivalency effects: a thermodynamic investigation of the calcium EDTA interaction, J. Am. Chem. Soc., 2003, 125, 7375–7366.
- (a) D. Budac and P. Wan, Photodecarboxylation: mechanism and synthetic utility, J. Photochem. Photobiol., A, 1992, 67, 135–166 CrossRef CAS; (b) P. Wan and D. Budac, Photodecarboxylation of acids and lactones, in Organic Photochemistry and Photobiology, ed. W. M. Horspool and P. S. Song, CRC Press, Boca Raton, 1995, ch. 31, pp. 384–392 Search PubMed; (c) S. A. Fleming and J. A. Pincock, Photochemical cleavage reactions of benzyl-heteroatom sigma bonds, in Organic Molecular Photochemistry, ed. V. Ramamurthy and K. S. Schanze, Marcel Dekker, New York, 1999, ch. 5, pp. 211–281 Search PubMed; (d) F. Boscá, M. L. Marín and M. A. Miranda, Photodecarboxylation of acids and lactones: anti-inflammatory drugs, in Organic Photochemistry and Photobiology, ed. W. M. Horspool and F. Lenci, CRC Press, Boca Raton, 2003, 2nd edn, ch. 64, pp. 64·1-64·10 Search PubMed.
- C. K. Lee and P. Wan, Photoredox chemistry of p-nitrophenylalanine and p-nitrophenethylamine in basic aqueous solution: formation of an observable long-lived intermediate, J. Photochem. Photobiol., A, 1993, 76, 39–45 CrossRef CAS.
- O. Meth-Cohn, The mechanism of the photochemical transformations of N-2,4-dinitrophenyl-α-amino-acids, Tetrahedron Lett., 1970, 1235–1236 CrossRef CAS.
- (a) R. S. Davidson and P. R. Steiner, Mechanism of the photoinduced decarboxylation of carboxylic acids sensitised by aromatic ketones and quinones, J. Chem. Soc., Perkin Trans. 2, 1971, 1357–1362 Search PubMed; (b) K. O. Hiller, B. Masloch, M. Göbl and K. D. Asmus, Mechanism of the OH˙ radical induced oxidation of methionine in aqueous solution, J. Am. Chem. Soc., 1981, 103, 2734–2743 CrossRef CAS.
- G. C. R. Ellis-Davies, Synthesis of photolabile EGTA derivatives, Tetrahedron Lett., 1998, 39, 953–956 CrossRef CAS.
- (a) U. C. Yoon and P. S. Mariano, Mechanistic and synthetic aspects of amine-enone single electron transfer photochemistry, Acc. Chem. Res., 1992, 25, 233–240 CrossRef CAS; (b) J. Santamaria, Photoinduced electron transfer in organic synthesis: applications to alkaloids, Pure Appl. Chem., 1995, 67, 141–147 CrossRef CAS.
- (a) I. Willner, A. Riklin and N. Lapidot, Electron-transfer communication between a redox polymer matrix and an immobilized enzyme: activity of nitrate reductase in a viologen-acrylamide copolymer, J. Am. Chem. Soc., 1990, 112, 6438–6439 CrossRef CAS; (b) K. S. Suslick and R. A. Watson, The photochemistry of chromium, manganese and iron porphyrin complexes, New J. Chem., 1992, 16, 633–642 Search PubMed.
- (a) J. Chen, D. F. Ollis, W. H. Rulkens and H. Bruning, Photocatalyzed deposition and concentration of soluble uranium(VI) from TiO2 suspensions, Colloids Surf., A, 1999, 151, 339–349 CrossRef; (b) A. Wallo and H. G. Brittain, Photochemical behavior of the Nd(III) and Ho(III) complexes of ethylenediaminetetraacetic acid, J. Inorg. Nucl. Chem., 1981, 43, 561–563 CrossRef CAS.
- M. A. El Korshy and R. M. Hassan, Kinetics and mechanism of redox reaction between ADA and hexachloroiridate(IV) in acid perchlorate solutions, Bull. Pol. Acad. Sci., Chem., 1998, 46, 147–156 Search PubMed.
- J. E. T. Corrie, B. C. Gilbert, V. R. N. Munasinghe and A. C. Whitwood, EPR studies of the structure of transient radicals formed in photolytic reactions of some 2-nitrobenzyl compounds. Characterisation of aryl alkoxy nitroxides and nitroaromatic radical-anions in the photolysis of caged ATP and related compounds, J. Chem. Soc., Perkin Trans. 2, 2000, 2483–2491 RSC.
- K. Takahashi, T. Komura and H. Imanaga, Light-induced redox characteristics of [tetrakis(4-methylpyridyl)porphorinato]manganese, Bull. Chem. Soc. Jpn., 1983, 56, 3203–3207 CAS.
- G. C. R. Ellis-Davies, J. J. Kaplan and R. J. Barsotti, Laser photolysis of caged calcium: rates of calcium release by nitrophenyl-EGTA and DM-nitrophen, Biophys. J., 1996, 70, 1006–1016 CrossRef CAS.
- M. Wilcox, R. W. Viola, K. W. Johnson, A. P. Billington, B. K. Carpenter, J. A. McCray, A. P. Guzikowski and G. P. Hess, Synthesis of photolabile precursors of amino-acid neurotransmitters, J. Org. Chem., 1990, 55, 1585–1589 CrossRef CAS.
- A. Barth, K. Hauser, W. Mäntele, J. E. T. Corrie and D. R. Trentham, The photochemical release of ATP from “caged ATP” studied by time-resolved infrared spectroscopy, J. Am. Chem. Soc., 1995, 117, 10311–10316 CrossRef CAS.
Footnote |
| † Electronic supplementary information (ESI) available: Synthetic details for compounds 4–6, 8 and 9, Fig. S1 and S2, and details of the equations underlying the calcium titrations. See DOI: 10.1039/b515469c |
| This journal is © The Royal Society of Chemistry and Owner Societies 2006 |