Mass spectrometric studies of non-covalent compounds: why supramolecular chemistry in the gas phase?
Bilge Baytekin, H. Tarik Baytekin and Christoph A. Schalley*
Institut für Chemie und Biochemie–Organische Chemie, Freie Universität Berlin, Takustr. 3, 14195, Berlin, Germany. E-mail: schalley@chemie.fu-berlin.de; Fax: +49-30-838-55817; Tel: +49-30-838-52639
First published on 21st June 2006
Abstract
Supramolecular chemistry has progressed quite a long way in recent decades. The examination of non-covalent bonds became the focus of research once the paradigm that the observed properties of a molecule are due to the molecule itself was revised, and researchers became aware of the often quite significant influence of the environment. Mass spectrometry and gas-phase chemistry are ideally suited to study the intrinsic properties of a molecule or a complex without interfering effects from the environment, such as solvation and the effects of counterions present in solution. A comparison of data from the gas phase, i.e. the intrinsic properties, with results from condensed phase, i.e. the properties influenced by the surroundings of the molecule, can consequently contribute significantly to the understanding of non-covalent bonds. This review provides insight into the often-underestimated power of mass spectrometry for the investigation of supramolecules. Through example studies, several aspects are discussed, including determination of structure in solution and the gas phase, ion mobility studies to reveal the formation of zwitterionic structures, stereochemical issues, analysis of reactivity of supramolecular compounds in the condensed and in the gas phase, and the determination of thermochemical data.
 Bilge Baytekin Bilge Baytekin | Bilge Baytekin studied chemistry at the Middle East Technical University in Ankara and completed her M.Sc. studies under the supervision of Engin U. Akkaya in 2002. She started to work with Christoph Schalley in Bonn as a Ph.D. student and moved to the Free University of Berlin with him. Her research interests include supramolecular photochemistry, mass spectrometry of supramolecules and dendrimers, and the design and synthesis of supramolecular architectures. |
 H. Tarik Baytekin H. Tarik Baytekin | H. Tarik Baytekin graduated from the chemistry department at the Middle East Technical University in Ankara. In 1998, he received his M.Sc. degree in analytical chemistry on laser-induced fluorimetry. He completed his Ph.D. on fluorescent sensors for cations, anions, and neutral molecules and molecular electronics in organic chemistry under the supervision of Engin U. Akkaya in 2002. He joined Hans-Werner Abraham's group at Humboldt University in Berlin for post-doctoral studies in 2002. With a short-term DAAD scholarship, he then moved to the Kekulé Institute of Organic Chemistry and Biochemistry at the University of Bonn to study the self-assembly of dendrimers with Christoph Schalley, with whom he moved to the Free University of Berlin in 2005. |
 Christoph A. Schalley Christoph A. Schalley | Christoph A. Schalley finished his Ph.D. on the gas-phase ion chemistry of peroxides under the supervision of Helmut Schwarz at the Technical University of Berlin in 1997. In 1998, he joined Julius Rebek's group at the Scripps Research Institute for a post-doctorate in Supramolecular Chemistry. Back in Germany, in 1999 he started his independent career at the University of Bonn at the borderline of mass spectrometry and supramolecular chemistry. In 2005, he was appointed professor of Organic Chemistry and Modular Synthesis at the Free University of Berlin. For his work on mass spectrometric studies of supramolecular compounds, he was recently awarded the 2006 Mattauch–Herzog prize by the German Society of Mass Spectrometry. |
1. Introduction: some basic considerations
The beginnings1 of supramolecular chemistry dates back to the end of the 19th century, when Villiers and Hebd discovered cyclodextrin inclusion complexes (1891), when Werner introduced the concept of coordination chemistry (1893), when Fischer formulated the key–lock principle (1894), and when Ehrlich invented the concept of substrate receptor interactions (1906). During the following decades, intermolecular interactions always played a role in chemical research, and many of the above concepts have seen revisions and extensions. Just to mention one example, Koshland's induced-fit model for guest binding to a receptor molecule represents an important revision of the static key–lock principle.With some surprise we may note that supramolecular chemistry did not start its development into an independent field of research before the mid-1960s, and one might well ask why the importance of this area was not appreciated earlier, with many of the fundamental concepts being already developed. The first answer is a technical one: methods for studying weak, non-covalent bonds were quite limited. Methodological development has had a major impact on supramolecular chemistry. One may consider the development of soft ionisation methods2,3 for the mass spectrometric detection of biomolecules and their non-covalent complexes only one of the more recent examples for such a methodological progress, but it is one that is closely connected to the topic of this review. The second, maybe even more important answer is that a shift of paradigm was required. Early chemists considered the observations they made to be due to the molecule's properties, while the influence of the surroundings (such as the solvent) were believed to be more or less negligible. One may justify this approximation by noting that a molecule is held together by covalent bonds that are much stronger than the molecule's interactions with its environment. Nevertheless, this approximation quite often does not hold. In the late 1960s, the exceptions to the paradigm were recognised as more than just a couple of exceptions. A paradigm shift occurred, the importance of non-covalent, intermolecular forces was appreciated to a growing extent, and it became the focus of a new research program. The area of supramolecular chemistry was born, and Lehn introduced the term “supramolecule”.4
In this review we will discuss how mass spectrometry contributes to gaining knowledge about supramolecules, and why it is able to contribute much more than is usually recognised by many researchers in supramolecular chemistry.5 The preceding remarks intend to prepare the reader for an important point put forward in this article. Mass spectrometry is a method which investigates ions in a high vacuum of about or even below 10−9 mbar. Due to this low pressure, the ions do not carry a solvation shell, and they do not influence each other strongly because of the charge repulsion hindering them from approaching each other. Consequently, mass spectrometry is a method for studying isolated ions, and thus provides access to their intrinsic properties, in marked contrast to the situation in the condensed phase, i.e. usually a solution of the supramolecules in some solvent. One can compare the properties of the isolated supramolecule and its properties in solution and gain insight into the effects of solvation.
The idea to access the intrinsic properties – and this is another important aspect – is particularly valuable for the examination of weak bonds. The strengths of individual non-covalent interactions are often of the same order of magnitude as the interaction of a molecule with the solvent. In many cases, it is only a suitable spatial arrangement of binding sites6 and the additive or even cooperative contributions of several non-covalent bonds that stabilise a defined supramolecule in a solvent competing for its binding sites. Under these conditions, particularly large effects of the environment can be expected, so that the promise of mass spectrometry to provide insight into these effects becomes even more intriguing. With this in mind, it becomes clear that the potential of mass spectrometry in supramolecular chemistry is often strongly underestimated.
After a few technical remarks on how to generate non-covalently bound ions and transfer them intactly into the gas-phase, we will see that mass spectrometry goes far beyond the analytical characterisation of the complexes with respect to their exact masses, elemental compositions, isotope patterns, charge states, and their stoichiometries or the analysis of impurities. Mass spectrometry can provide structural information on the complexes. The term “structure” usually implies atom connectivities, bond lengths, bond angles, and similar parameters. The term is used here in a different sense. It denotes the “secondary structure”, i.e. the arrangement of the non-covalently bound subunits in the complex relative to each other, while atom connectivities within the individual components of a complex are known from independent experiments with each separate component before the complex is made. Other structural questions, e.g. for conformations in the gas phase or whether an ion with suitable functional groups exists as a zwitterion or a neutral complex, can be answered by mass spectrometric experiments. Although mass spectrometry is in principle an achiral method, diastereomers can be distinguished, for example by using appropriate isotope labelling strategies. Beyond structure determination, the reactivity of a supramolecule in solution and in the gas phase can be examined. The term reactivity does not only refer to the fragmentation behaviour. It also includes experiments such as hydrogen/deuterium exchange in solution or in the gas phase. Finally, we will come back to solvation effects when we discuss thermodynamic data obtained from gas-phase measurements.
Mass spectrometry offers different ionisation methods, each of which can be coupled to different analysers, in which different experiments can be performed with the ions of interest under different conditions. We cannot and will not go into too great detail with respect to the particular features of certain mass spectrometers. Instead, the experiments necessary for understanding this article will be briefly explained in the chapters where they are needed. Also, this review does not claim to be comprehensive. It focuses on more recent examples and does not include non-covalent interactions between biomolecules, which have been reviewed earlier.7 It is rather a personal statement on the development of one particular area in mass spectrometric research and thus, several of the examples chosen come from the authors' own work.
2. The preparation of non-covalently bound gaseous ions: soft ionisation methods
In the mid-1980s, two soft ionisation methods were developed, electrospray ionisation (ESI)2 and matrix-assisted laser desorption/ionisation (MALDI)3 which changed the traditional notion that mass spectrometry is a rather rough and destructive method. This allowed straightforward ionisation and desolvation of non-covalent complexes.In MALDI, the analyte is placed into a crystalline matrix (e.g. 2,5-dihydroxybenzoic acid or 9-nitroanthracene) at rather low concentration. The matrix is then irradiated with a UV laser (often an N2 laser operating at a wavelength of 337 nm). The matrix is required for two reasons. First of all, it absorbs the laser light and transfers the energy to the sample, which is vaporised and ionised. Second, the matrix helps to cool the analyte ions by removing part of its excess internal energy through collisions in the laser-generated plume. In very simple words, the laser light heats the sample with heating rates of up to 106 K s−1. Consequently, desorption/ionisation is faster than most decomposition reactions and even large, otherwise non-volatile molecules can be ionised successfully. Nevertheless, MALDI often leads to a considerable increase of the ions' internal energy, which may be incompatible with the weak non-covalent bonds of a supramolecule. Consequently, fragmentation may occur to a significant extent.
This makes ESI the more useful and more common method for the examination of non-covalent molecules in many cases. Again simplifying, ESI works by applying a high voltage (usually several kV) to the tip of a metal-coated capillary through which a solution of the desired sample is flowing at flow rates of a few µL per minute. Small droplets carrying excess charge are formed. Upon evaporation of the solvent, the droplets shrink, thereby increasing the charge repulsion, and undergo fission into even smaller droplets until the desolvated ions are formed. Whatever the details of the ESI process,8,9 the points that are important for the experiments to be described here are that: (i) the evaporating solvent molecules help to keep the internal energy of the ions low and thus not only suppress extensive fragmentation, but also make the intact ionisation of non-covalent complexes feasible, and that (ii) the sample can be ionised from almost any suitable solution, provided that a charge is present in the complex or can be delivered to it during ionisation.
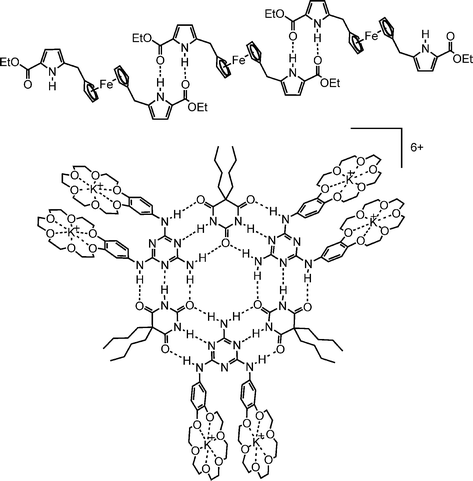
The last remark points to an important issue: can any solvent be used? Of course there are some restrictions with respect to boiling points and surface tension. Due to the solubility of most biomolecules in water, the most common spray solvent for ESI is some mixture of water and methanol. Protic solvents have the advantage of providing the protons necessary for ion generation. But how should one examine hydrogen-bonded species in such a competitive environment? Hydrogen bonds become stronger in non-competing solvents such as chloroform or dichloromethane. But if we avoid protic solvents, where should the charge come from? The answer usually requires the experimenter's imagination, and there is no general solution to this problem. Some strategies are shown in Scheme 1: the hydrogen-bonded ferrocene complex can be ionised by oxidation of the ferrocene with iodine,10 and the melamine–barbiturate rosettes can either be charged by covalently attaching cation-binding crown ethers11 or by accepting a negative charge when an appropriate source of anions, e.g. Ph4PCl for Cl−, is added to the sample solution.12 For molecular boxes based on such rosette motifs (actually ionised by MALDI), a silver ion-labelling approach was chosen.13 While these considerations are typical for hydrogen-bonded species, similar arguments may apply to other non-covalent interactions. Consequently, one may state that there is no general solution to the problem of ion generation, and that it is a matter of the experimenter's chemical intuition to find the best way.
 | ||
| Scheme 1 Hydrogen-bonded aggregates that have successfully been ionised from non-protic media. | ||
3. Pitfalls? Pitfalls!
As for any other method, limitations need to be considered for mass spectrometric experiments with supramolecules in order to avoid misinterpretations of the experiments.During the transition from condensed phase into the high vacuum of the mass spectrometer, the properties of the non-covalent bonds such as strength, directionality and geometry may change dramatically. If going from a non-competitive organic to a protic solvent often causes a complete change in binding selectivities, binding energies, or the stability of a large assembly, how could one possibly expect that no changes occur when transferring supramolecular species into the high vacuum of a mass spectrometer? More precisely, any interaction that competes with the solvent, for example a hydrogen bond in protic media, probably increases in strength upon evaporation. The same holds true for electrostatic attractions, which are weakened in solution by solvation with the dipoles of the solvent molecules. Instead, salt bridges, e.g. the carboxylate–guanine interaction in arginine-containing peptides, which are favourable in solution due to stabilisation of the charges by the solvent, may only exist in the gas phase under particularly beneficial circumstances. Indeed, neutral forms, generated by proton transfer to the carboxylate may be the energetically more stable isomers. Other forces may become weaker in the gas phase. A special case is the hydrophobic effect. In water, nonpolar molecular surfaces tend to turn towards each other. Thus, more hydrogen bonds between water molecules remain undisturbed, contributing their binding energy to the favour of the system as a whole. In the gas phase, the nonpolar molecules, after desolvation, no longer benefit from this effect, and their binding energy will be much lower than that found in solution. A series of literature reports deals with the formation of cyclodextrin inclusion complexes of, for example, different drugs, and use mass spectrometry as a means to provide evidence for their formation.14 Sometimes they are observed in the mass spectra, and sometimes not, even if the complexes exist in solution in both cases. However, this is no surprise, because in solution it is mainly the hydrophobic effect that keeps the drug molecule inside the cyclodextrin cavity. In the gas phase, this effect is replaced usually by a proton bridge between both molecules – but only for those guest molecules that have functional groups suitable for formation of these proton bridges. The result is the same in solution and the gas phase – a complex is formed – however, the reasons for complex formation are completely different!
A red-alert level warning needs to be issued for treating mass spectrometric intensities as quantitatively correlating with solution concentrations. Even though many literature reports claim this to be true, at least for ESI-MS, and cite a list of predecessors testifying in favour of this assumption, it is rather an exception than normality, if this hypothesis holds, and it does not become any more accurate by constantly repeating it. Factors such as the solvation energies influence the ESI response factors,15 which need to be determined for each single ion in order to obtain a quantitative correlation of concentration and intensity. Again, there are many studies on crown ether–alkali ion complexes, which have even arrived at contradictory rankings of binding energies. A series of elegant, real gas-phase experiments16 finally resolved the misunderstandings originating from them. These experiments clearly show that one either needs to carefully determine ESI response factors, or to rely on experiments carried out in the gas phase after carefully mass-selecting the ion of interest.
Unspecific binding is quite common and thus may become a source of error. It is often quite difficult to distinguish unspecific binding from specific binding, and thus one may be tempted to draw false conclusions on, for example, complex stoichiometry. Whenever possible, one should perform experiments aiming at a structural assignment of the ions, or use suitable controls in order to exclude unspecific binding or structural rearrangement during or after the ionisation process.
Most weakly bound species exhibit dynamic features in solution. For example, a chemical equilibrium between free host and guest on one side and the host–guest complex on the other often exists. The equilibrium reflects thermodynamic stabilities. Often, the species interchange quickly, and formation and dissociation of the host–guest complexes are fast processes. In the gas phase, there is no such equilibrium situation, unless the experiment is deliberately and carefully set up to provide the necessary conditions. Upon decomposition of the complex ions in the gas phase, the two partners are irreversibly separated from each other. Consequently, the kinetic rather than thermodynamic stability determines the results of mass spectrometric experiments on non-covalent ions. In other words, the dynamics of the supramolecule may be significantly affected upon transfer into high vacuum. This is not necessarily a disadvantage, because one gets insight into mechanistic aspects of the reactivity of the supramolecule, which are hard or impossible to obtain from solution experiments, but one needs to take into consideration that the reactivity may be significantly altered.
When comparing gas-phase data with condensed-phase results, the influence of a charge cannot be neglected. Consequently, a comparison of e.g. neutral dimeric complexes in solution with proton-bridged dimers in the gas phase almost unavoidably leads to misinterpretation.
Finally, the ill-definition of temperature is a severe problem when attempting to collect thermochemical data in the gas phase. Isolated molecules or ions do not have a temperature, which is a macroscopic property and thus is only defined for an ensemble of molecules in thermal equilibrium with each other. Thus, the Boltzmann distribution of internal energies is not realised in the gas phase. In solution, all molecules reach thermal equilibrium by exchanging energy through collisions. In contrast, no such energy exchange is realised in the gas phase, since collisions are avoided. Although it is impossible to give a full account on these methods here, some ways to tackle this problem will be discussed below. While we are on the subject of energetics, it should be mentioned that a direct comparison of ions with large size differences with respect to the ease of inducing fragmentation is not straightforward. Large ions have so many more degrees of vibrational freedom that they can store much more energy before fragmenting than smaller ions.
All these differences between the condensed and gas phases should be kept in mind when drawing conclusions concerning solvation and its effects on non-covalent binding. Despite these methodology-inherent limitations, this section does not intend to scare away the reader, but to provide the necessary attention to problems that may arise. How rewarding mass spectrometric studies on supramolecules can be will hopefully become clear in the following sections.
4. Structure determination: mechanical bonds and encapsulation
Let us now go into some detail. We will start with the question of the mass spectrometric determination of the structure of a supramolecule. Two examples will deal with mechanical bonds of topologically interesting molecules and with the encapsulation of guest molecules inside self-assembled molecular capsules.4.1. The mechanical bond: how to distinguish molecules with respect to their topology?
Scheme 2 shows the structural formula of a rotaxane, which can be synthesised by a hydrogen-bond-mediated template effect.17 The axle is mechanically trapped inside the wheel by two sterically demanding stopper groups. In order to provide definitive evidence for the intertwined topology, mass spectrometry offers collision-induced dissociation (CID) experiments. The rotaxane is ionised easily by deprotonation of the central phenol group, and can be observed as the corresponding anion in the negative mode. After ionisation, the ion of interest is mass-selected, i.e. all other ions that may be found in the mass spectrum are removed from the instrument. Subsequently, the ion is accelerated and collided with argon at a pressure of ca. 10−7 mbar. Under these conditions, every ion on average collides with an argon atom only once (so-called single-collision conditions) and part of the ion's kinetic energy is converted into internal energy. Fragmentation reactions occur, when the internal energy suffices. | ||
| Scheme 2 A rotaxane. Two bulky stopper groups at the ends of the axle prevent the axle from deslipping (“deslipping” denotes the dissociation of rotaxane in which the wheel passes one the stoppers without breaking any covalent bonds of the rotaxane). | ||
The non-intertwined structural alternative is an axle–wheel complex just held together by hydrogen bonds between the two components. In order to provide evidence for the intertwined topology of the rotaxane, it is necessary to independently generate this complex and subject it to exactly the same experiment. In practice, the hydrogen-bonded complex can be generated with sufficient intensity just by ionising a 1 : 1 mixture of the two components, i.e. axle and wheel. Fig. 1 shows the resulting CID mass spectra together with the analogous spectrum of the axle alone.18
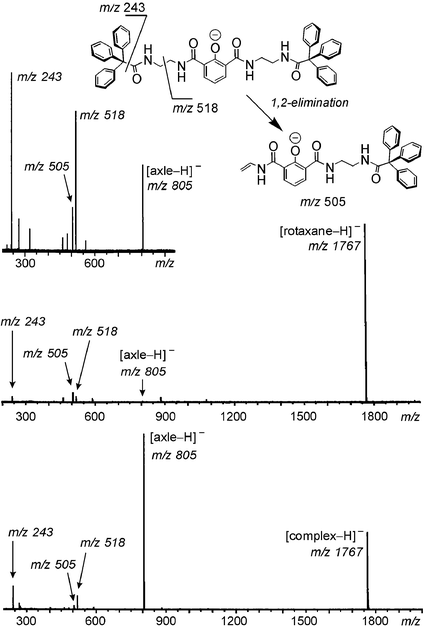 | ||
| Fig. 1 CID experiments conducted with (top to bottom) the mass-selected axle, rotaxane and the non-intertwined hydrogen-bonded axle–wheel complex. The inset above shows the fragmentations of the deprotonated axle. | ||
The CID mass spectrum of the rotaxane shows rather small fragments at m/z 243, m/z 505, m/z 518, which can unambiguously be assigned to products of covalent bond cleavages of the axle. This becomes clear from the same experiment performed with the axle in the absence of the wheel. Similar fragments are observed for the axle–wheel complex. The two CID spectra, however show two distinct differences: (i) The free, deprotonated axle is the major fragment in the CID spectrum of the complex, while it is virtually absent in the rotaxane CID spectrum, and (ii) although both spectra are obtained under the same experimental conditions, the rotaxane parent survives the experiment to an extent of ca. 85%, whereas almost two-thirds of the complex are destroyed. This indicates a less energy-demanding fragmentation for the complex. Both observations can be explained by considering that only four hydrogen bonds need to be broken in the complex in order to separate axle and wheel. The axle thus remains intact and the binding energy is low. From the rotaxane, the wheel can only be lost if the mechanical bond is released, and this requires the cleavage of a covalent bond. Since the wheel does not bear easy-to-cleave bonds, the axle is destroyed and only its fragments are observed – covalent bond cleavage is of course more energy-demanding.
While it is quite straightforward to distinguish these two species, the problem becomes more challenging when comparing the tetra- and octalactam macrocycles, catenanes and the trefoil knot shown in Scheme 3. For both fragmentation of the octalactam macrocycle and of the catenane, covalent bonds need to be broken, and one may ask whether mass spectrometry is still able to provide criteria for differentiating the two topologies.
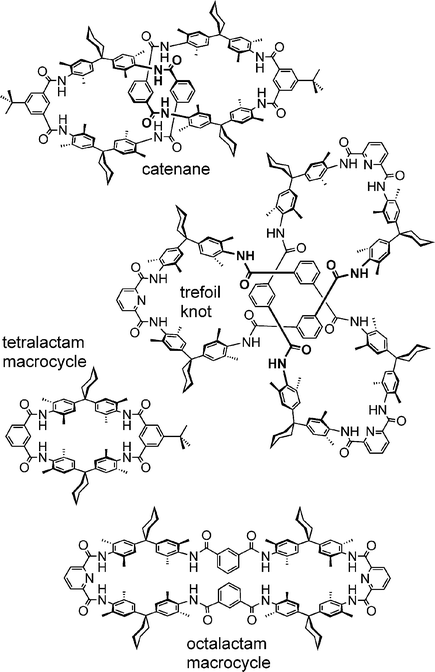 | ||
| Scheme 3 Macrocycles, catenanes and knots of the amide type. | ||
Again, CID experiments provide the structural assignment. Ionisation can be achieved by protonation in the positive mode,19 as well as deprotonation of an amide in the negative mode.18 For both species, the result is the same: All monomacrocycles fragment through several consecutive water losses, while other fragments are rather low in intensity and become clearly visible only at higher collision energies. Instead, the catenane first loses one wheel. The remaining macrocycle shows the same fragmentation reactions found for the tetralactam macrocycle. Mass spectrometry thus provides clear evidence for the intertwined topology of catenanes – an approach that has recently been used for other types of catenanes as well.20
4.2. Encapsulation of guest molecules in self-assembling capsules: the pyrogallarene hexamer
The encapsulation of guest molecules in self-assembling capsules is a topic of great interest in supramolecular chemistry. Quite often, it is rather difficult to provide clear evidence for encapsulation inside the capsule's cavity – in particular when the capsule is a highly dynamic species.21 NMR experiments may show two separate signals for the free and the encapsulated guest, provided that the guest exchange is slow enough. Complementary information from mass spectrometry is nevertheless highly welcome. Mass spectrometric structural proof for encapsulation can be achieved by using charged guests which, make ionisation easy.22 Competition experiments with different guest molecules can be used to address the size, shape and symmetry congruence of guest and capsule cavity. Heterocapsule formation can occur when two different capsules exchange their constituent subunits. This reaction permits one to address dynamic processes by mass spectrometry. Finally, tandem MS experiments may even provide some insight into the capsule's structure in the gas phase.Pyrogallarenes and resorcinarenes such as those shown in Scheme 4 self-assemble in crystal form23 and in solution24 into hexameric capsules. The assembly can be thought as a cube with one bowl-shaped monomer on each face. The monomers are connected to each other by a complex network of hydrogen bonds, and surround an interior volume of more than 1200 Å3, which can be filled with guest molecules.
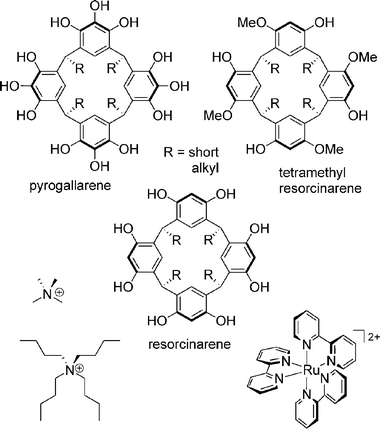 | ||
| Scheme 4 Pyrogallarenes and resorcinarenes which form hexameric capsules through hydrogen bonding. The tetramethylresorcinarene serves as a control compound. At the bottom, three different guest cations are shown, which carry charges to make the capsule MS-detectable. | ||
If the monomers are dissolved in CHCl3–acetone (2 : 1) without addition of a guest, clusters are observed, with intensities decreasing with cluster size (Fig. 2a). This is expected, when unspecific binding occurs. The addition of templating cations changes the picture. Upon addition of tetramethylammonium salts, we observe the almost exclusive formation of dimers (Fig. 2b). In line with the literature,25 these dimers can be assigned to small capsules which entrap one guest cation inside. Larger cations such as tetrabutylammonium change the size distribution (Fig. 2c), but do not specifically form hexamers. Only a guest such as tris(2,2′-bipyridine)ruthenium(II), which is almost perfectly congruent with the geometry of the cavity in size, shape and symmetry (Fig. 3), produces a reasonably clean spectrum, with the hexamer signal being the base peak (Fig. 2d).26 A control experiment with the tetramethylresorcinarene in Scheme 4 clearly rules out unspecific hexamers – no signal for any hexamer is observed with this compound, for which the formation of the hydrogen bond network is impossible. Finally, if two different resorcinarenes or a resorcinarene and a pyrogallarene are mixed directly before the mass spectrometric experiment, a completely statistical mixture of homo- and heterohexamers is observed, indicating that the exchange of monomers is fast under these conditions.
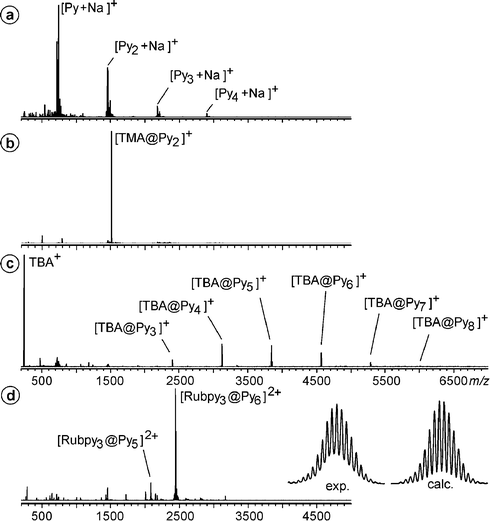 | ||
| Fig. 2 (a) ESI-FTICR mass spectrum of pyrogallarene (Py) in CHCl3–acetone (2 : 1). (b) ESI mass spectrum of the same solution after addition of 1 eq. of a tetramethylammonium (TMA) salt. (c) Distribution of clusters with tetrabutylammonium (TBA) as the guest cation. (d) ESI mass spectrum of the hexamer encapsulating Ru(bpy)32+. The experimental and calculated isotope patterns nicely match. | ||
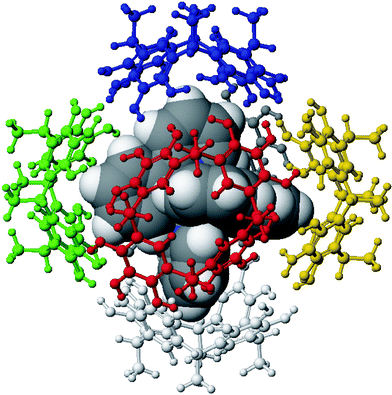 | ||
| Fig. 3 Computer model of the Ru(bpy)32+ guest encapsulated in the cavity of the hexamer. Each monomer is shown with a different colour. It can clearly be seen that the Ru complex not only fits size-wise, but also with respect to its symmetry and shape. | ||
These experiments nicely show how mass spectrometry can contribute to the assignment of a capsular structure to this hydrogen-bonded capsule, as well as metallo-supramolecular tetrahedra encapsulating a templating cation.27
5. Ion mobility: zwitterionic or neutral structures in the serine octamer?
Quite remarkably, electrospray ionisation of rather concentrated solutions (e.g. 0.1 M) of serine in methanol yields an abundant ion corresponding to an octameric amino acid cluster.28 Other cluster sizes are also generated, but with much lower intensity. The most intriguing feature of these ions is their strong tendency to form homochiral clusters. In a mixture of L-serine and isotopically labelled [13C]-D-serine, the homochiral octamer appears with an intensity higher than that expected from statistics by a factor of ca. 14, while the 4L/4D cluster is significantly less abundant than expected.29 In order to explain these features, several structures were suggested in the literature, among them structures containing zwitterionic serine molecules and structures, where all the serines existed in their non-zwitterionic form. One example for a zwitterionic structure is shown in Fig. 4. Both forms can be distinguished by their ion size. Due to the strong attractive electrostatic forces within a cluster of zwitterionic serines, a purely zwitterionic structure is expected to be much more compact than non-zwitterionic ones. In this structure, all eight serine OH groups are involved in a cyclic array of hydrogen bonds, each connected to a carboxylate oxygen of the next serine. If one changes the stereochemistry at one of the serines, this array is disrupted.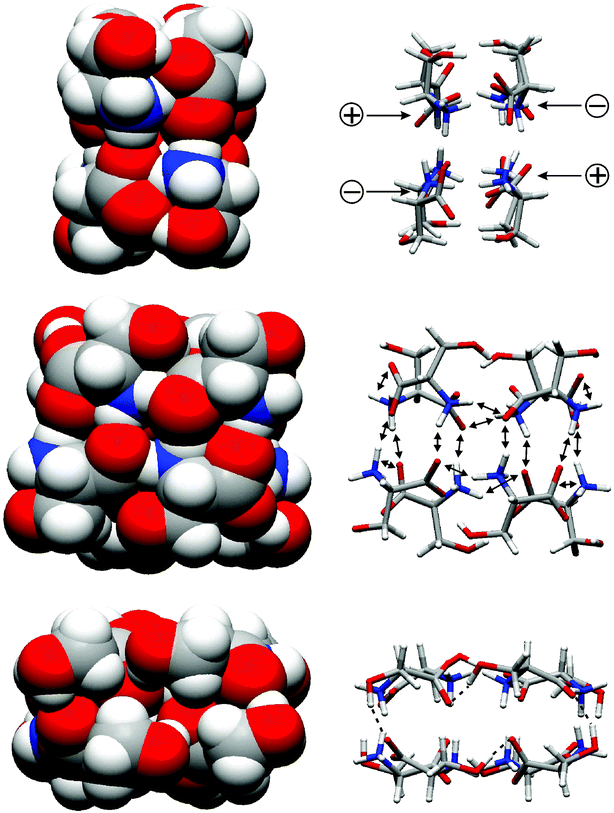 | ||
| Fig. 4 A serine octamer cluster built from zwitterionic L-serine molecules. Left: space-filling representation. Right: favourable interactions (electrostatic attraction, hydrogen bonds) holding the cluster together. Bottom: view showing a cyclic array of hydrogen bonds connecting the serines' OH groups with carboxylates from adjacent serines. Changing the stereochemistry of only one serine will disconnect this array and thus destabilise heterochiral forms. | ||
Since the octamer has not been observed in solution, a mass spectrometric method is needed to distinguish between both possibilities. With ion mobility experiments,30 such a method indeed exists. In this experiment, mass-selected ions are pulled into a helium-filled drift tube by a low voltage. Collisions with helium atoms, which usually do not cause fragmentation due to the low collision energies, decelerate larger ions to a greater extent than smaller ions. The arrival time distribution determined at the end of the drift tube can be converted into the collision cross-section, which correlates with the ion's size and shape. The collision cross-section can also be calculated with quite a high precision (uncertainty of experiment is often less than 3%).
For the serine octamer, cross-sections of 187 Å2 and 191 Å2 were obtained by experiment31 – values much too low for non-zwitterionic structures. However, the zwitterionic structure shown in Fig. 4 yields calculated values between 183 Å2 and 191 Å2, depending on the model used.32 It consequently explains both the compact size and the tendency towards homochiral clusters.
However, the picture became more differentiated recently, when H/D exchange experiments were performed in the gas phase with the serine octamer.33 In these experiments, the ions of interest are mass-selected and subsequently treated with a deuterium source, e.g. ND3 or CH3OD. The kinetics of the isotope exchange can be followed by mass spectrometry, since the isotopes have different atomic masses. In these experiments, the serine octamers turned out to consist of two non-interconverting structures, one of which exchanges protons against deuterons significantly faster than the other. The quickly exchanging population is less stable and fragments more easily, and is thus assigned to a non-zwitterionic form. One possible reason why this form was not recognised in the ion mobility experiments is the possible destruction of the ions in the drift tube. Ion mobility experiments, which previously were used mainly for the examination of gas-phase conformations, consequently show great potential for elucidating details of supramolecular structures as well. However, the slower-exchanging population, which was initially overlooked, reminds us of the potential pitfalls of a purely mass spectrometric approach.
6. Chiral recognition
Mass spectrometry is an intrinsically achiral method. Consequently, we cannot expect it to distinguish two enantiomeric forms of a compound or supramolecular complex. However, diastereomers can have different properties, and thus may well be distinguished by their mass spectra.34 Two different methods have been developed for assessing the diastereomeric excess of host–guest complexes. Basically, the first one examines mixtures of one enantiomer of the host with one enantiomer of the guest and an achiral reference host.35 In a second experiment, the other enantiomer of the guest is mixed with the same chiral and achiral hosts. From the relative peak intensities (RPI) of the two diastereomeric complexes as compared to the reference complex, the diastereoselectivity can be measured. Scheme 5 shows a few examples for chiral crown ethers which have been used to investigate by mass spectrometry their ability to recognise chiral ammonium ions.35,36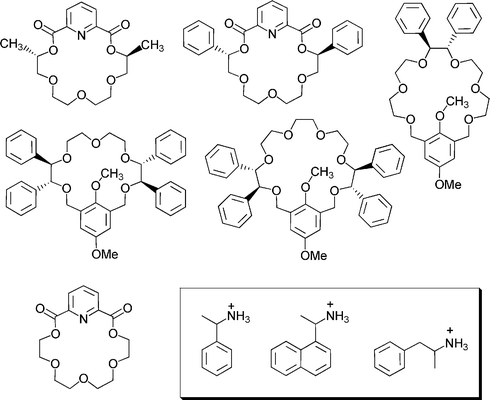 | ||
| Scheme 5 Chiral crown ethers that have been used for chiral recognition studies, with the ammonium ions in the inset. The non-chiral crown at the bottom was used as a reference. | ||
One of the critical aspects of this approach is that two different experiments have to be performed, between which the particular instrument conditions must be carefully kept constant in order not to affect the intensity ratios. This problem can be overcome by the enantiomer-labelled guest method.37 It is based on the mass spectrometric examination of one enantiomer of the host with a pseudo-racemic mixture of the guest in which one enantiomer is isotopically labelled. In order to be able to detect both diastereomers separately, one enantiomer of the guest must be isotopically labelled, usually with deuterium. In the same experiment, both diastereotopic complexes are formed and their intensities can be compared directly. However, the stereochemical effect might additionally be superimposed with an unknown isotope effect. A way to separate stereochemical and isotope effects is to perform the same experiment with the second host enantiomer.38 In one experiment both stereochemical and isotope effects disfavour the same complex, and thus work in the same direction. In the other experiment, they partly cancel each other out. Once both experiments have been performed, one can use the two experimental values for the intensity ratios of both diasteromeric complexes to deconvolute both effects.39
The diastereoselectivities observed in the MS experiments for some systems differ from those found in solution. Furthermore, some cases have been found where different ionisation methods, e.g. FAB versus ESI,40 gave rise to completely different diastereoselectivities. These findings point to the fact that the ionisation procedure might alter the ratios of the species present in solution. Therefore, an approach using true gas-phase experiments would be advantageous. Several complexes of chiral ammonium ions with the chiral crown ether in Scheme 6 have been studied with so-called cation-transfer equilibrium experiments.41 In this experiment, a crown ether–ammonium complex is generated in one of the two diastereomeric forms and mass-selected. The isolated complex ions are then reacted in the gas-phase with a pseudo-racemate of the neutral amine corresponding to the guest cation. The crown ether can be transferred together with the proton from one amine to another amine. This reaction is followed over time until equilibrium is reached. The equilibrium distribution directly provides access to relative binding energies. Steric bulk and π–π interactions between the guest and the host contribute to the intrinsic stability difference of the two diastereomeric complexes. The steric interactions can be explained by a three-point model, as depicted in Scheme 6.41 Consequently, with the right isotope labelling strategies, mass spectrometry provides access to the intrinsic energy differences between two diastereomeric complexes. As long as the intensity ratio of both enantiomers is in the range of ca. 0.25 to 4, this data is usually highly accurate because small energy differences translate into a quite large variation of the ratio of both diastereomers.
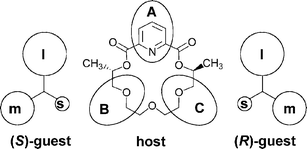 | ||
| Scheme 6 The three-point model (l = large, m = medium, s = small substituent). | ||
7. Reactivity in solution followed by mass spectrometry: Li-bridged non-covalent helicates
After the discussion of structural details such as the secondary structure of non-covalent complexes, the formation of (non-) zwitterionic clusters, and stereochemical features, reactivity will form the next topic in this article. In principle, mass spectrometry can provide two different kinds of reactivity data. It can merely serve as a highly sensitive detector for processes occurring in solution. By following the kinetics of, for example, ligand exchange reactions in solution, the dynamics of supramolecular systems can be addressed. The time needed to mix two solutions and record the first mass spectrum is of the order of (at least) a minute. Consequently, the processes under study need to be quite slow. On the other hand, mass spectrometry directly provides access to the intrinsic reactivity of a supramolecule in the gas phase. While a number of different dynamic processes such as complex formation and dissociation may exist in solution, such processes do not occur in the gas phase. Consequently, quite different mechanistic aspects can be investigated in both experiments. We will thus discuss them separately, starting here with one example from solution.Carbonyl-substituted catechols (Fig. 5) react with Ti(IV) salts under slightly basic conditions to yield tris-catecholates in a first assembly step. In the presence of Li+ ions (Na+ and K+ don't do the trick due to their larger ion sizes), two of these tris-catecholate complexes form dimers bridged by three Li+ ions.42 The crystal structures of three representative examples only differing with respect to the nature of the carbonyl substituent (aldehyde, ketone, or ester) are shown in Fig. 5.
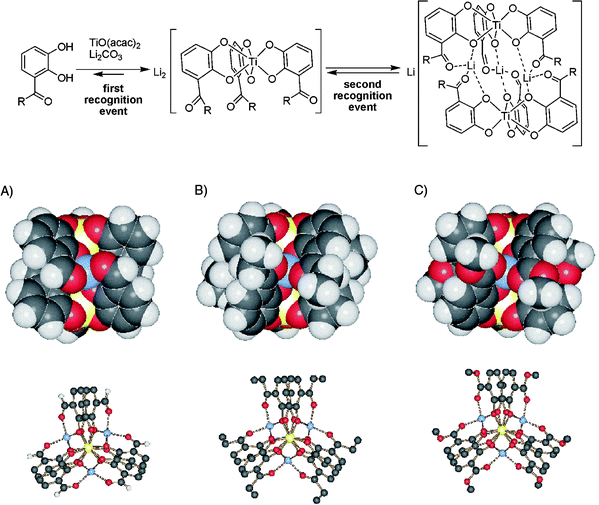 | ||
| Fig. 5 Top: self-assembly drives the formation of helical, homochiral dimeric titanium tris-catecholate complexes. Dimerisation is only mediated by Li+, while Na+ and K+ do not lead to comparable products. Bottom: crystal structures of the dimers formed from the aldehyde (left, R = H), the ethyl ketone (centre, R = C2H5), and the methyl ester (right, R = OCH3). For each, a space-filling representation (side view) and a ball-and-stick model (viewed along the Ti–Ti axis) are shown. | ||
The question to be answered by mass spectrometry is how ligand exchange proceeds in solution when two different dimers are mixed with each other. By NMR methods, this is rather difficult to answer, because a large number of species, i.e. four different monomeric species and a multitude of different dimers (seven different ligand stoichiometries, some of which exist as mixtures of isomers), can be formed in the equilibrium. Mass spectrometry can however easily detect all different stoichiometries simultaneously, as long as the two ligands differ in molecular weight.
Fig. 6 shows two series of mass spectra obtained from an equimolar mixture of two different lithium-bridged helicates with ketone-substituted catechols. Each series was measured in a particular solvent, i.e. tetrahydrofuran–methanol (1 : 1) and pure tetrahydrofuran (THF). In the mass spectra obtained immediately after mixing the two helicates (0 min), signals are observed exclusively for the two homodimers, while heterodimers are absent. While this is the same for both solvents, a first remarkable difference is found for the monomer signals (insets). While the monomers exchange ligands quickly in the presence of methanol (a statistical 1 : 3 : 3 : 1 mixture of the A3, A2B, AB2, and B3 monomers is found; A and B denote two different catecholate ligands), the ligand exchange among monomers is slow in pure THF (only the two A3 and B3 monomers are observed). This finding is easily explained by the presence of methanol, a protic solvent, which mediates catecholate exchange by protonating the catechol, and offering methoxy ligands for stabilising intermediates in which a catechol dissociates from the metal centre. A look at the last spectrum in each series shows that ultimately an almost statistical mixture of all possible dimers (A6, A5B, A4B2, A3B3, A2B4, AB5, B6, some of which likely exist as mixtures of different positional isomers) is realised, although two very different reaction times are necessary depending on the solvent mixture.
 | ||
| Fig. 6 Ligand exchange between two different dimers of titanium(IV) tris-ketochatecholates. Left: exchange followed in a 1 : 1 mixture of THF and methanol. Right: exchange in pure THF. Insets in the bottom spectra: monomer region showing fast ligand exchange between monomers in THF–MeOH and slow exchange in pure THF. | ||
Even more intriguing are the intermediate spectra. In principle, three different ligand exchange mechanisms are possible: (i) exchange of intact monomers without exchange of individual ligands. For this scenario, three signals are expected, one for each homodimer and one for the A3B3 heterodimer, which consists of one A3 and one B3 monomer; (ii) if individual ligands are exchanged between dimers without dissociation into the monomers, one would expect that the intermediate spectra evolve by first showing a U-shaped distribution which approximates a statistical distribution at the end; (iii) if the exchange of individual ligands is not possible between dimers, but is possible between monomers, we expect to see a statistical mixture of all possible dimers to grow between the two A6 and B6 homodimers. Finally, again a statistical mixture of all possible dimers is expected.
With these scenarios in mind, a look at the two series of spectra shows that no U-shaped distribution is generated in either solvent mixture. Consequently, the exchange of individual ligands between dimers or between dimers and monomers does not occur. This is quite understandable, since the Li+ ions coordinate the ligands within the dimer and slow down the ligand exchange process within the dimers. In pure THF, at first, an intense signal for the A3B3 dimer is found, while it takes much longer to generate the A5B, A4B2, A2B4, and AB5 dimers. This can only be explained by the exchange of complete monomers being faster than the exchange of individual ligands between monomers – in line with the observation that ligand exchange is slow for the monomer (see above). The latter reaction nevertheless occurs to some extent, and finally gives rise to the statistical equilibrium mixture. In the presence of methanol, finally, ligand exchange proceeds via dissociation of the dimers into the monomers, a fast ligand exchange between monomers and reassociation of the monomers to yield statistical mixtures of dimers.
This example of solution-phase reactivity analysed by mass spectrometry clearly shows how much information can be derived from some simple measurements. Qualitatively, it can be deduced which mechanisms contribute, and which don't. Quantitatively, at least a ranking of the relative rates for the different processes is obtained. Finally, this example makes clear how large the influence of the solvent may be. The change of the mixture from pure THF to THF–methanol mixtures is not too drastic, but still, significant changes in reaction mechanism and rates are found.
8. Reactivity in the gas phase: supramolecular neighbouring group assistance and dendritic effects
If one wants to study reactivity in the gas phase with large ions generated by soft ionisation methods, the ions of interest need to be activated after mass-selection. This can be achieved by (i) collision-induced decay (CID, see above), (ii) IR photons generated with a CO2 laser, (iii) electron-capture dissociation (ECD), or electron-transfer dissociation (ETD). The latter two methods require multiply charged species and therefore are mostly applied to peptide sequencing, but so far have not played a significant role in supramolecular mass spectrometry. If one uses collisions with a collision gas (usually a noble gas such as Ar), part of the kinetic energy of the ions is converted into internal, vibrational energy. One should distinguish between high-energy collisions, which occur for example in a sector-field instrument where ions with a kinetic energy of 8 keV collide with the collision gas, and low-energy collisions as usually found in e.g. FT-ICR instruments. Collision experiments should be performed under single-collision conditions, in particular when (admittedly rough) rankings of fragmentation barriers are to be determined. The absorption of several to many photons is usually required to achieve fragmentation through irradiation with the IR laser. The experiment is therefore called infrared multi-photon dissociation (IRMPD).In this section, two examples will be discussed which rely on IRMPD and CID experiments. It is important to keep in mind that ions in the gas phase are isolated particles, which do not undergo exchange processes between each other. Also, the neutral fragment formed upon dissociation does not come back; there is no chemical equilibrium. This is the most important difference from condensed-phase studies. The experiments described here thus provide a completely new view on these supramolecules and add new mechanistic insight into their reactivity, which cannot be gained in solution due to the complex equilibria present here.
8.1. Metallosupramolecular squares: a supramolecular equivalent to neighbouring group assistance
If one mixes 4,4′-bipyridine with (dppp)Pd(II) or (dppp)Pt(II) triflates (dppp = bis(diphenylphosphine)propane), both reactants spontaneously self-assemble43 to the metallo-supramolecular square shown in Scheme 7. This is due to the weakly coordinating counterions, which leave two coordination sites open. By virtue of the dppp ligand, the coordination angle of 90° is fixed. It is rather difficult to ionise these squares as intact entities, but under the right conditions (low temperatures in the ion source, acetone as the solvent and a quite high 250 µM concentration), ionisation is achieved through stripping away two or more counterions.44 Since mass spectrometry measures the mass-to-charge (m/z) ratio of the ions under study, doubly, triply, quadruply etc. charged species appear in the mass spectrum at half, a third, a quarter etc. of their molecular mass. Consequently, a doubly charged square may be superimposed by a singly charged 2 : 2 complex of bipyridine and metal corner. This is indeed observed, and can be analysed by a closer look at the isotope pattern, where singly charged ions have peak spacings of Δm/z = 1, while ions with n charges exhibit peak spacings of Δm/z = 1/n. Consequently, tandem MS experiments can easily be performed with squares in their +3 and +5 charge states, because these ions cannot contain any contributions from fragments.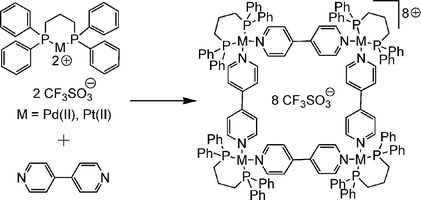 | ||
| Scheme 7 A self-assembling Stang-type square. | ||
If a tandem MS experiment is performed by carefully mass-selecting the triply charged Pt(II) squares and irradiation of the parent ion with the IR laser (IRMPD), fragmentation of the squares is easily achieved (Fig. 7). Interestingly, a doubly charged 3 : 3 complex and a singly charged 1 : 1 complex of corner and bipyridine are the primary products. The complete absence of a doubly charged 2 : 2 complex confirms that no fragmentation into two half-squares occurs, although the same number of metal–nitrogen bonds need to be broken. Instead, the singly charged half-square is a secondary fragmentation product formed from the 3 : 3 complex. These findings are summarised in Scheme 8.
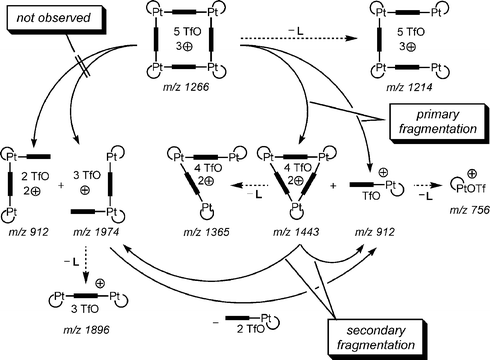 | ||
| Scheme 8 Complete analysis of the fragmentation mechanisms observed for the triply charged Pt(II) square. | ||
One may ask why only one of the two alternative reactions occurs, although both require the cleavage of two M–N bonds and thus should be expected to be similar in energy demand. One explanation involves a back-side attack mechanism. When irradiated by the IR laser, the ions' internal energy increases, and ultimately a bond is broken. The result is a chain-like ion with a higher degree of conformational freedom. If the uncomplexed pyridine end of the chain attacks the third metal centre (Scheme 9), cleavage of the second M–N bond benefits from the new M–N bond already forming during the reaction. Other conformations of the chain, which would lead to two 2 : 2 fragments, do not profit from a similar effect because that would cause too much strain. If this explanation holds true, two conclusions can be drawn: (i) although not detected in the solution equilibrium by NMR experiments, triangles can form. However, they require the particular conditions of the gas phase to survive and be detected; and (ii) if triangles can form, the strain within the cyclic structure must be lower than the binding energy of a Pt–N bond.
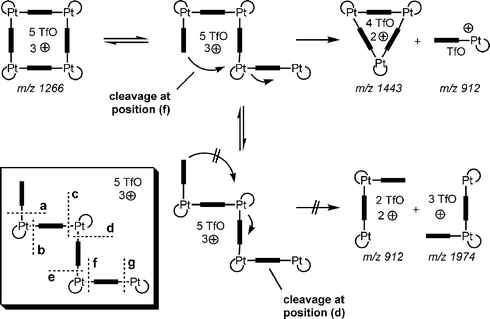 | ||
| Scheme 9 Through a back-side attack mechanism, fragmentation into 3 : 3 and 1 : 1 complexes is energetically favoured (top), while splitting into two half-squares does not benefit from such a mechanism due to the strain imposed into the structure (bottom). The inset shows all possible cleavage sites, (a)–(g). Cleavage at position (a) is the only one, which competes with that at (f). | ||
There is an alternative explanation for the experimental findings. Within a triply charged square, charge repulsion must play a role. Upon fragmentation, the charges are distributed over the two fragments. This must happen in a non-symmetrical way, generating one singly and one doubly charged fragment. Consequently, one may claim that unsymmetrical cleavage would provide better stabilisation of the charges, when two charges are located on the larger fragment and one charge remains on the smaller fragment. In order to distinguish between these two possibilities, the same experiments were performed for different charge states and all the fragments involved.45 Only two of them are necessary to provide further insight into the mechanistic problem: the quadruply charged triangle and the quintuply charged square. The triangle in its +4 charge state undergoes fragmentation by different channels, distributing the charges over the two fragments in different ways. In contrast, the fragmentation of the +5 square yields only two primary fragments: a singly charged 1 : 1 complex and a 3 : 3 complex in its +4 charge state. In this case, it would certainly be more favourable in terms of charge repulsion if two charges were to remain on one fragment and three on the other. These considerations nicely show the specificity of the fragmentation of the squares in contrast to those of the quadruply charged triangle, and thus rule out an explanation based solely on charge repulsion effects. Instead, we conclude that the supramolecular analogue of neighbouring group assistance is operative in the fragmentation of the squares.
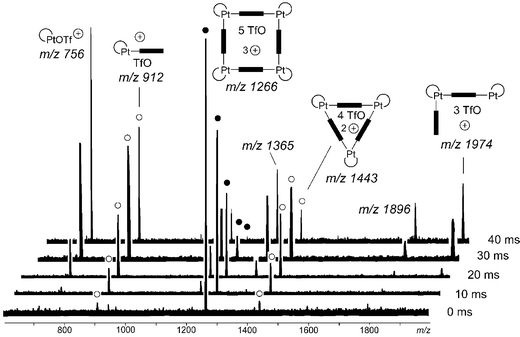 | ||
| Fig. 7 IRMPD experiment with mass-selected triply charged squares (full circles, ●). At increasing irradiation times (right), the intensity of the parent ion decreases. Primary fragments are marked with open circles (○). They correspond to a doubly charged 3 : 3 complex and a singly charged 1 : 1 complex. Splitting into two half-squares is not observed. | ||
8.2. A surprising dendritic effect: switching fragmentation mechanisms
Viologens are doubly charged bipyridinium ions, which form complexes with the molecular Klärner tweezer46 shown in Scheme 10. Since the guest is a dication, the complexes can easily be generated.47 When one tries to ionise the guest cations alone, singly and doubly charged clusters are observed with an appropriate number of counterions balancing charge repulsion. There seems to be a stability trend for the naked dications. The bare G0 viologen was not observed under any of the tested ionisation conditions, and we thus assume that it – if not intrinsically unstable – exists only as a short-lived metastable ion. However, the G1 viologen was observed under very mild ESI conditions, while it was no problem at all to generate bare G2 viologen dications. In marked contrast, addition of the tweezer destroys all clusters, and tweezer–viologen complexes are observed (even for G0) as dications. Clearly, coordination by the tweezer stabilises the dication and likely contributes to a diminution of the charge repulsion effects through charge–transfer interactions.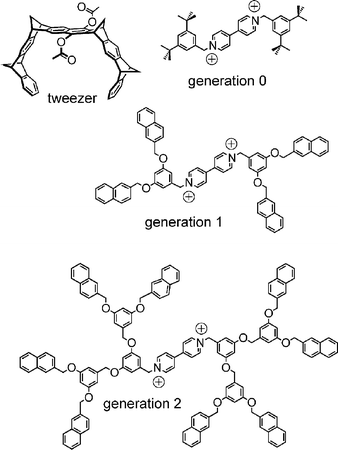 | ||
| Scheme 10 Dendritic viologens (G0–G2) and the Klärner tweezer, which forms 1 : 1 complexes with the viologen guests. | ||
In a CID experiment with mass-selected tweezer–viologen dications, two possible reaction pathways exist, since two rather weak bonds are present: the non-covalent interactions between host and guest, and the benzyl–nitrogen bond, which upon cleavage generates a well-stabilised benzyl cation and suffers from charge repulsion. The supramolecular bond can be cleaved, leading to the loss of the tweezer and formation of the bare dications. Based on the experience with the generation of these dications in the ESI source, one might expect that they undergo Coulomb explosion to yield a singly charged dendritic benzyl cation and a singly charged bipyridinium cation bearing the second dendron (bottom pathway in Scheme 11). The alternative is initial cleavage of the weak benzyl–N bond, producing a singly charged dendritic benzyl cation. The tweezer may well have sufficient residual binding energy to the remaining bipyridinium monocation to remain present in the complex (upper pathway in Scheme 11). As a consecutive fragmentation, the tweezer may be lost, ultimately generating the same fragments as in the first pathway.
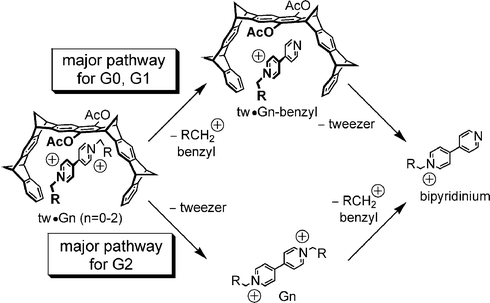 | ||
| Scheme 11 Possible pathways for the fragmentation of the tweezer–viologen complexes. Depending on the dendron size, the mechanism switches between G1 and G2 from the upper to the lower pathway. | ||
The CID spectra in Fig. 8 provide evidence that the mechanism switches from the upper pathway (realised for G0 and G1) to the bottom pathway (realised for G2) depending on the dendron size. In the CID spectrum of the tweezer complex with the G0 viologen guest dication, a fragment is observed at m/z 1059. The fragment ion appears at a higher value than its precursor simply because the latter has two charges. This fragment corresponds to the loss of one di-(tert-butyl)benzyl cation from the complex. The tweezer remains bound to the singly charged bipyridinium cation. A so-called double resonance experiment provides evidence that almost all of the bipyridinium cation at m/z 359 is due to a consecutive fragmentation of the complex at m/z 1059. In this experiment, the CID experiment is repeated under the exactly same conditions with the exception that the intermediate at m/z 1059 is constantly removed and thus can no longer produce any consecutive fragments. The intensity of the fragment at m/z 359 decreases significantly, and thus identifies this ion as a product formed from the intermediate rather the parent.
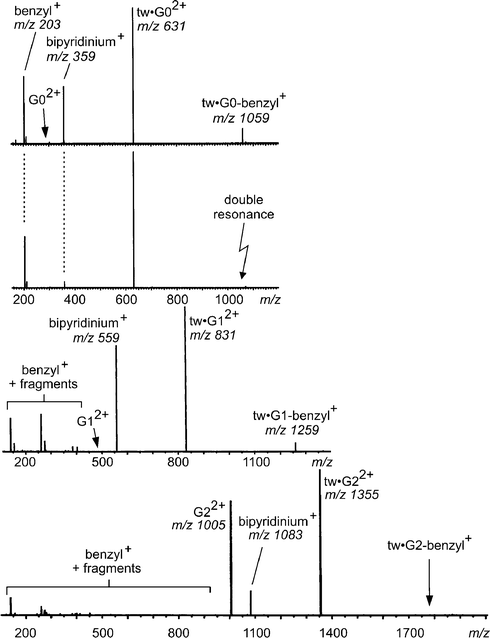 | ||
| Fig. 8 CID mass spectra of mass-selected, dicationic tweezer–viologen complexes (G0: top two rows, G1 third row, G2 bottom row). The second trace shows a double-resonance experiment, which is a CID experiment during which the fragment at m/z 1059 was constantly ejected. All consecutive fragments are thus not formed and can be identified easily. | ||
For the tweezer complex with the G1 viologen, the overall picture is the same. However, the complex with the G2 viologen guest behaves very differently. The benzyl loss intermediate is not formed at all. Instead, the tweezer is lost, generating the bare G2 dication at m/z 1005, which can then undergo further fragmentation by benzyl cation loss.
How can we understand this complete switch in mechanism, which somehow parallels the stability differences of the bare dications encountered during the ionisation? Molecular modelling suggests that the dendron arms can backfold to different extents. For G0, no backfolding is possible and the dication is not stabilised by internal solvation. For G1, the peripheral naphthalene groups can surround the dication and stabilise it through charge-transfer interactions. In the G2 viologen, such an interaction is possible even with the much more electron-rich dihydroxybenzyl branching units. Consequently, internal solvation stabilises the dication with increasing dendron size. The tweezer competes with this interaction easily for the G0 and G1 viologens. The benzyl–N bond is the weakest in the complex and breaks first. However, the G2 viologen can self-stabilise to such an extent that the dication is stable. The internal stabilisation also strengthens the benzyl–N bond, and at the same time weakens the interaction with the tweezer. The interaction between tweezer and guest is now the weakest bond, and thus in the CID experiment the tweezer is lost preferentially.
This example shows gas-phase reactivity to be quite different from that in solution. Such a clear-cut dendritic effect cannot be expected to be found in solution, because counterions are present which compensate charge repulsion and thus make this effect vanish more or less completely. In summary, mass spectrometry provides a completely new view of the reactivity of supramolecular complexes.
9. Thermochemistry: how to measure gas-phase thermochemical data of supramolecules
There exist several methods for the extraction of thermochemical data from gas-phase experiments. In connection with the chiral recognition of ammonium ions by crown ethers, we have already briefly discussed gas-phase equilibrium experiments. Another method – Cook's kinetic method48 – relies on a central building block complexing two different ligands at identical binding sites. The more weakly bound ligand will dissociate more frequently and the abundances of daughter ions provide a measure of their relative binding energies. Also, bracketing experiments will provide some (albeit rough) relative energies.A greater challenge is to determine accurate absolute thermochemical data. As discussed in Chapter 3, one of the problems is that gaseous ions are usually not in thermal equilibrium, because they don't collide often enough to be thermalised. Three methods to circumvent these problems will be presented in this section, two of which have been applied to supramolecular chemistry:
(i) The first method employs collision-induced dissociation experiments with ions of exactly controlled kinetic energy. The threshold for a reaction then is a measure of the activation barrier (or, assuming that there is no reverse barrier, the binding energy). These so-called threshold collision-induced dissociation (TCID) experiments49 however, have severe limitations when the ion size becomes large.
(ii) If one applies IRMPD to induce fragmentation, the ions absorb multiple photons until an equilibrium is reached, at which the same number of IR photons is absorbed and emitted in a given time interval. The internal energies at which this thermal equilibrium is reached depends on the laser flux density. Consequently, a modified Arrhenius plot can be obtained, if one determines the rate constant for a reaction at different laser flux densities. This method was developed by Marshall et al.50 and permits the extraction of the activation energy. However, since the ion temperature is unknown, the pre-exponential factor in the Arrhenius equation cannot be derived.
(iii) Finally, blackbody infrared radiation from the instrument's walls may activate ions for fragmentation. After a short induction period, the ion is in thermal equilibrium with the walls through the exchange of blackbody (IR) photons. With a heatable wall whose temperature is known, it is thus possible to determine the ion temperature just by reading out the instrument's wall temperature. A blackbody infrared radiative dissociation (BIRD) experiment51 conducted at different wall temperatures allows the experimenter to determine rate constants of gas-phase reactions at different temperatures. With the help of the Arrhenius equation, both the activation barrier and the pre-exponential factor can be derived.
All three methods require special equipment, which with the exception of the IRMPD set-up is usually commercially unavailable. These experiments are thus by no means routine.
9.1 Crown ether–alkali complexes: questioning the best-fit model
The binding of alkali metal cations to crown ethers follows the best-fit model in solution, i.e. the cation which has the appropriate size for binding inside the cavity of the crown will bind with the highest affinity (e.g. Na+ in 15-crown-5, K+ in 18-crown-6 etc.). These trends are usually observed for protic solvents such as methanol. In order to compare the binding energies in solution with gas-phase data, Armentrout and his group52 collected a large number of gas-phase binding energies by threshold collision-induced fragmentation experiments. In Table 1, the gas-phase binding energies of monodentate dimethylether (DME), bidentate dimethoxyethane (DXE), 12-crown-4, 15-crown-5, and 18-crown-6 to the alkali metal cations M = Li+–Cs+, as determined by TCID experiments, are summarised. In order to facilitate comparison, the values for the sums of two DME, four DME, and two DXE ligands are also included.| Ligand | Li+ | Na+ | K+ | Rb+ | Cs+ |
|---|---|---|---|---|---|
| a Estimated value. | |||||
| 1 DME | 1.71 | 0.95 | 0.76 | 0.64 | 0.59 |
| 2 DME | 1.25 | 0.85 | 0.71 | 0.57 | 0.49 |
| 3 DME | 0.92 | 0.72 | 0.59 | 0.38 | 0.41 |
| 4 DME | 0.70 | 0.63 | 0.52 | 0.40a | 0.37a |
| 1 DXE | 2.50 | 1.64 | 1.23 | 0.97 | 0.59 |
| 2 DXE | 1.44 | 1.20 | 0.92 | 0.51 | 0.56 |
| 12-Crown-4 | 3.85 | 2.61 | 1.96 | 0.96 | 0.88 |
| 15-Crown-5 | — | 3.05 | 2.12 | 1.18 | 1.04 |
| 18-Crown-6 | — | 3.07 | 2.43 | 1.98 | 1.74 |
| 1 + 2 DME | 2.96 | 1.80 | 1.47 | 1.21 | 1.08 |
| 3 + 4 DME | 1.62 | 1.35 | 1.11 | 0.89 | 0.78 |
| 1–4 DME | 4.58 | 3.15 | 2.58 | 1.99 | 1.86 |
| 1 + 2 DXE | 3.94 | 2.84 | 2.15 | 1.48 | 1.15 |
Several clear trends emerge:
(i) As expected, the first ether ligand bound to the metal exhibits higher bond dissociation energy than the second, and so forth.
(ii) The binding energy of any ligand L in the MLn+ complexes under study decreases from Li+ to Cs+, probably due to the more concentrated charge on Li+ and better orbital overlap, since Li+ and the oxygen donor are in the same row of the periodic table. This trend has also been observed in a study employing the infrared multiphoton dissociation (IRMPD) technique.53
(iii) The binding energy increases from 12-crown-4 to 18-crown-6 for all metal ions (for Li+ this trend still needs to be confirmed, since no binding energies have been reported for the Li+(15-crown-5) and Li+(18-crown-6) complexes so far). The number of oxygen donors in the crown ether is thus much more important than the geometric fit of the cation inside the cavity of the ligand.
(iv) Nevertheless, geometric properties play a secondary role. The binding energy of 15-crown-5 to Na+, the preferred partner in solution, is the same as for 18-crown-6, although it bears only five instead of six oxygen donors. Seemingly, the better fit for 15-crown-5 compensates the additional binding energy from the sixth oxygen. The increase in binding energies from 15-crown-5 to 18-crown-6 is particularly drastic for Rb+ and Cs+, while the difference is much smaller between the two smaller crowns. This would not be expected if there were no size argument, since the binding energies for each additional donor atom usually decrease with increasing number. Seemingly, the number of donor sites in the crown and the degree of geometric fit both contribute to the total binding energy.
(v) Finally, the sum of the binding energies for two DME ligands is larger than that of one bidentate DXE ligand. The same applies if four DME groups are compared to two DXEs, and in the series of the tetradentate complexes M(DME)4+, M(DXE)2+, and M+(12-crown-4), the crown ether always has the lowest total binding energy. This trend can be rationalised by the entropic (and enthalpic) costs of forming five-membered cyclic –M+–O–CH2–CH2–O– subunits within the complexes. Conformations in the CH2CH2 backbone cannot freely interconvert as they can in the free ligand after dissociation, and the optimal staggered geometry is not easily feasible. While the O–C–C–O dihedral angle in free dimethoxyethane is 74°, it is 48°, 55°, 59°, 61°, and 63° for Li+–Cs+, respectively. Of course, the crown ethers suffer most from this effect.
The remaining question is why the “best fit” plays such a great role in polar solvents, while it is of minor importance in the gas phase. That brings us to the role of solvation, which can be analysed based on these data. In methanol, for example, a crown ether competes with an appropriate number of solvent molecules for binding to the alkali metal ion. The intrinsic binding energies from the gas phase predict that the interaction with the solvent is somewhat (but probably not too much) greater than that of the crown ether. However, two other effects come into play in solution: entropy and geometric fit. It is less favourable, for example, to bring together one Li+ ion and four methanol molecules than to form a complex from just two components, Li+ and 12-crown-6. This entropic effect is more or less the same for any alkali metal ion, independent of its size. Consequently, the geometric fit finally determines which ion binds best. In the gas phase however, there is no methanol replacement ligand competing with the crown. Consequently, the binding energies are governed by the number of oxygen donors, because there is no balanced interplay with the solvent. The entropy effects may play a role during ion formation, but once mass-selected, the reaction is always the same – loss of one ligand producing two particles from one, levelling out the entropy. Finally, geometric fit cannot overcompensate the binding energies determined by the number of donor atoms, and thus only contributes a minor fraction of the binding energy. In conclusion, the major achievement resulting from the gas phase data is a much more profound understanding of the role of solvation in cation binding by crown ethers.
9.2. BIRD: Arrhenius kinetics of oligonucleotide strand separation in the gas phase
The BIRD approach has been utilised to decide the question whether short oligonucleotide double strands still have a Watson–Crick base paired structure. Schnier et al.54 argued that one could conclude the Watson–Crick base pairing to be conserved in the gas phase, if the gas-phase barriers follow linearly the same trend as the melting enthalpies determined with UV methods in solution. The triply charged double strands examined had four, six or seven base pairs and reveal features expected for a correct pairing pattern. A higher number of hydrogen bonds, which relates to a higher G:C content, leads to a higher activation energy. For example, palindromic (TGCA)23− has an activation barrier of 1.41 eV, while the (CCGG)23− double strand undergoes separation when a barrier of 1.51 eV can be surmounted. Also, mismatched complexes (A7·A73−: 1.26 eV; T7·T73−: 1.40 eV) melt at lower activation barriers than matched ones (A7·T73−: 1.68 eV). When the gas-phase activation energy is plotted against melting enthalpies from solution, a near-linear relationship is found. All these findings provide evidence for intact Watson–Crick base pairing in the gas phase. Molecular dynamics calculations agree with this conclusion as far as the hydrogen bonding is concerned. However, the effects of the three unsolvated negative charges on the backbone phosphates become clearly visible in the molecular dynamics simulation after ca. 100 fs – the double helix starts to disrupt. After ca. 400 fs, the helical structure is completely converted into a globular complex with maximised charge–charge distances, but still with an intact hydrogen bonding pattern.10. Conclusions
The examples discussed here come from quite different fields in supramolecular chemistry, and have been selected to provide an idea of the diversity of the complexes and aggregates of interest, as well as the non-covalent interactions mediating the binding. After discussing different aspects of structure determination, reactivity, and thermochemistry, it is also obvious that these topics do not stand separate from each other, but are intimately connected with each other. For example, the determination of activation barriers for oligonucleotide strand separation indirectly provides the structural assignment that the Watson–Crick base pairing is still intact in the gas phase. For the rotaxanes and catenanes discussed at the beginning, the reactivity in the gas phase allows one to draw conclusions with respect to the topology. Consequently, we need to finally think of the different topics discussed in this article as one complete gas-phase approach to supramolecular chemistry. Mass spectrometry, meanwhile, has revealed its enormous potential for supramolecular chemistry in quite a number of studies, and will hopefully continue to do so in the future.References
- For a brief introduction into the history of supramolecular chemistry, see: J. W. Steed and J. L. Atwood, Supramolecular Chemistry, Wiley, New York, 2000 Search PubMed. For original papers mentioned here, see: A. Werner, Z. Anorg. Chem., 1893, 3, 267 Search PubMed; E. Fischer, Ber. Dtsch. Chem. Ges., 1894, 27, 2985 Search PubMed; A. Villiers and C. R. Hebd, Seances Acad. Sci., 1891, 112, 435 Search PubMed; A. Villiers, C. R. Hebd. Seances Acad. Sci., 1891, 112, 536 CrossRef CAS; P. Ehrlich, Studies on Immunity, Wiley, New York, 1906 Search PubMed; D. E. Koshland, Jr., Proc. Natl. Acad. Sci. U. S. A., 1958, 44, 98 Search PubMed.
- J. B. Fenn, M. Mann, C. K. Meng, S. F. Wong and C. M. Whitehouse, Mass Spectrom. Rev., 1990, 9, 37 CAS; P. Kebarle and L. Tang, Anal. Chem., 1993, 65, 972A CrossRef CAS; S. J. Gaskell, J. Mass Spectrom., 1997, 32, 677 CrossRef CAS; J. B. Fenn, Angew. Chem., Int. Ed., 2003, 42, 3871 CrossRef CAS.
- F. Hillenkamp, M. Karas, R. C. Beavis and B. T. Chait, Anal. Chem., 1991, 63, 1193A CAS; M. Karas, U. Bahr and F. Hillenkamp, Int. J. Mass Spectrom. Ion Processes, 1989, 92, 231 CrossRef CAS; M. Karas, U. Bahr and U. Gießmann, Mass Spectrom. Rev., 1991, 10, 335 CAS; K. Tanaka, Angew. Chem., Int. Ed., 2003, 42, 3989 CrossRef.
- J.-M. Lehn, Pure Appl. Chem., 1978, 50, 871 CrossRef CAS.
- C. A. Schalley, Int. J. Mass Spectrom., 2000, 194, 11 CrossRef CAS; C. A. Schalley, Mass Spectrom. Rev., 2001, 20, 253 CrossRef CAS.
- D. J. Cram, Angew. Chem., Int. Ed. Engl., 1986, 25, 1039 CrossRef.
- Reviews on non-covalent complexes involving biomolecules: R. D. Smith, J. A. Loo, R. R. Ogorzalek Loo, M. Busman and H. R. Udseth, Mass Spectrom. Rev., 1991, 10, 359 Search PubMed; R. D. Smith and K. J. Light-Wahl, Biol. Mass Spectrom., 1993, 22, 493 CAS; M. Przybylski and M. O. Glocker, Angew. Chem., Int. Ed. Engl., 1996, 35, 806 CAS; J. A. Loo, Mass Spectrom. Rev., 1997, 16, 1 CrossRef CAS.
- M. Dole, L. L. Mack, R. L. Hines, R. C. Mobley, L. D. Ferguson and M. B. Alice, J. Chem. Phys., 1968, 49, 2240 CrossRef CAS; F. W. Röllgen, E. Bramer-Wegner and L. Buttering, J. Phys. Colloq., 1984, 45(suppl. 12), C9–C297.
- J. V. Iribarne and B. A. Thomson, J. Chem. Phys., 1976, 64, 2287 CrossRef CAS; B. A. Thomson and J. V. Iribarne, J. Chem. Phys., 1979, 71, 4451 CrossRef CAS.
- M. Scherer, J. L. Sessler, M. Moini, A. Gebauer and V. Lynch, Chem.–Eur. J., 1998, 4, 152 CrossRef CAS.
- C. M. Drain, R. Fischer, E. G. Nolen and J.-M. Lehn, J. Chem. Soc., Chem. Commun., 1993, 243 RSC.
- X. Cheng, Q. Gao, R. D. Smith, E. E. Simanek, M. Mammen and G. M. Whitesides, Rapid Commun. Mass Spectrom., 1995, 9, 312 CAS; X. Cheng, Q. Gao, R. D. Smith, E. E. Simanek, M. Mammen and G. M. Whitesides, J. Org. Chem., 1996, 61, 2204 CrossRef CAS.
- K. A. Joliffe, M. Crego Calama, R. Fokkens, N. M. M. Nibbering, P. Timmerman and D. N. Reinhoudt, Angew. Chem., Int. Ed., 1998, 37, 1247 CrossRef CAS.
- For a discussion of this problem, see: J. B. Cunniff and P. Vouros, Rapid Commun. Mass Spectrom., 1994, 8, 715 Search PubMed . For a review on cyclodextrins in the gas phase, see: C. B. Lebrilla, Acc. Chem. Res., 2001, 34, 653 CAS.
- E. Leize, A. Jaffrezic and A. Van Dorsselaer, J. Mass Spectrom., 1996, 31, 537 CrossRef CAS.
- Review: J. S. Brodbelt and D. V. Dearden, ‘Mass Spectrometry’, in: Comprehensive Supramolecular Chemistry, vol. 8, ed. J. E. D. Davies and J. A. Ripmeester, Pergamon, Oxford, 1996, p. 567 Search PubMed.
- P. Ghosh, O. Mermagen and C. A. Schalley, Chem. Commun., 2002, 2628 RSC; P. Ghosh, G. Federwisch, M. Kogej, C. A. Schalley, D. Haase, W. Saak, A. Lützen and R. Gschwind, Org. Biomol. Chem., 2005, 3, 2691 RSC.
- C. A. Schalley, P. Ghosh and M. Engeser, Int. J. Mass Spectrom., 2004, 232–233, 249 CrossRef.
- C. A. Schalley, J. Hoernschemeyer, X.-y. Li, G. Silva and P. Weis, Int. J. Mass Spectrom., 2003, 228, 373 CrossRef CAS.
- M. Amman, A. Rang, C. A. Schalley and P. Bäuerle, Eur. J. Org. Chem., 2006, 1940 Search PubMed; M. Hutin, J. R. Nitschke, C. A. Schalley and G. Bernardinelli, Chem.–Eur. J., 2006, 12, 4069 Search PubMed.
- F. Hof, S. L. Craig, C. Nuckolls and J. Rebek, Jr., Angew. Chem., Int. Ed., 2002, 41, 1488 CrossRef CAS.
- C. A. Schalley, J. M. Rivera, T. Martín, J. Santamaría, G. Siuzdak and J. Rebek, Jr., Eur. J. Org. Chem., 1999, 1325 CrossRef CAS; C. A. Schalley, R. K. Castellano, M. S. Brody, D. M. Rudkevich, G. Siuzdak and J. Rebek, Jr., J. Am. Chem. Soc., 1999, 121, 4568 CrossRef CAS; M. S. Brody, D. M. Rudkevich, C. A. Schalley and J. Rebek, Jr., Angew. Chem., Int. Ed., 1999, 38, 1640 CrossRef CAS; C. A. Schalley, T. Martín, U. Obst and J. Rebek, Jr., J. Am. Chem. Soc., 1999, 121, 2133 CrossRef CAS; A. Lützen, A. R. Renslo, C. A. Schalley, B. M. O'Leary and J. Rebek, Jr., J. Am. Chem. Soc., 1999, 121, 7455 CrossRef; B. M. O'Leary, T. Szabo, N. Svenstrup, C. A. Schalley, A. Lützen, M. Schäfer and J. Rebek, Jr., J. Am. Chem. Soc., 2001, 123, 11519 CrossRef.
- L. R. MacGillivray and J. L. Atwood, Nature, 1997, 389, 469 CrossRef CAS; T. Gerkensmeier, W. Iwanek, C. Agena, R. Fröhlich, S. Kotila, C. Näther and J. Mattay, Eur. J. Org. Chem., 1999, 2257 CrossRef CAS.
- See, for example: L. Avram and Y. Cohen, J. Am. Chem. Soc., 2002, 124, 15148 Search PubMed; A. Shivanyuk and J. Rebek, Jr., J. Am. Chem. Soc., 2003, 125, 3432 CrossRef CAS; L. Avram and Y. Cohen, Org. Lett., 2003, 5, 3329 CrossRef CAS; L. C. Palmer and J. Rebek, Jr., Org. Lett., 2005, 7, 787 CrossRef CAS; L. Avram and Y. Cohen, Org. Lett., 2006, 8, 219 CrossRef CAS.
- H. Mansikkamäki, M. Nissinen, C. A. Schalley and K. Rissanen, New J. Chem., 2003, 27, 88 RSC; H. Mansikkamäki, C. A. Schalley, M. Nissinen and K. Rissanen, New J. Chem., 2005, 29, 116 RSC.
- N. K. Beyeh, M. Kogej, A. Åhman, K. Rissanen and C. A. Schalley, Angew. Chem., DOI:10.1002/anie.200600687.
- I. Müller, D. Möller and C. A. Schalley, Angew. Chem., Int. Ed., 2005, 44, 480 CrossRef.
- Review: S. C. Nanita and R. G. Cooks, Angew. Chem., Int. Ed., 2006, 45, 554 Search PubMed.
- R. G. Cooks, D. Zhang, K. J. Koch, F. C. Gozzo and M. N. Eberlin, Anal. Chem., 2001, 73, 3646 CrossRef CAS; K. J. Koch, F. C. Gozzo, D. Zhang, M. N. Eberlin and R. G. Cooks, Chem. Commun., 2001, 1854 RSC; K. J. Koch, F. C. Gozzo, S. C. Nanita, Z. Takats, M. N. Eberlin and R. G. Cooks, Angew. Chem., Int. Ed., 2002, 41, 1721 CrossRef CAS.
- E. A. Mason and E. W. McDaniel, Transport Properties of Ions in Gases, Wiley, New York, 1988 Search PubMed.
- A. E. Counterman and D. E. Clemmer, J. Phys. Chem. B, 2001, 105, 8092 CrossRef CAS; R. R. Julian, R. Hodyss, B. Kinnear, M. F. Jarrold and J. L. Beauchamp, J. Phys. Chem. B, 2002, 106, 1219 CrossRef CAS.
- C. A. Schalley and P. Weis, Int. J. Mass Spectrom., 2002, 221, 9 CrossRef CAS.
- Z. Takats, S. C. Nanita, G. Schlosser, K. Vekey and R. G. Cooks, Anal. Chem., 2003, 75, 6147 CrossRef CAS; U. Mazurek, M. A. Farland, A. G. Marshall and C. Lifshitz, Eur. J. Mass Spectrom., 2004, 10, 755 CrossRef CAS.
- Applications of Mass Spectrometry to Organic Stereochemistry, ed. J. S. Splitter and F. Turecek, VCH, Weinheim, 1994 Search PubMed.
- M. Sawada, Y. Okumura, M. Shizuma, Y. Takai, Y. Hidaka, H. Yamada, T. Tanaka, T. Kaneda, K. Hirose, S. Misumi and S. Takahashi, J. Am. Chem. Soc., 1992, 115, 7381; M. Sawada, Y. Okumura, H. Yamada, Y. Takai, S. Takahashi, T. Kaneda, K. Hirose and S. Misumi, Org. Mass Spectrom., 1993, 28, 1525 CAS.
- G. Pócsfalvi, M. Lipták, P. Huszthy, J. S. Bradshaw, R. M. Izatt and K. Vékey, Anal. Chem., 1996, 68, 792 CrossRef CAS.
- Review: M. Sawada, Mass Spectrom. Rev., 1997, 16, 73 Search PubMed.
- M. Sawada, Y. Takai, T. Kaneda, R. Arakawa, M. Okamoto, H. Doe, T. Matsuo, K. Naemura, K. Hirose and Y. Tobe, Chem. Commun., 1996, 1735 RSC.
- A simple formalism for the deconvolution of the stereochemical and isotope effects has been described: G. Hornung, C. A. Schalley, M. Dieterle, D. Schröder and H. Schwarz, Chem.–Eur. J., 1997, 3, 1866 Search PubMed.
- M. Sawada, Y. Takai, H. Yamada, J. Nishida, T. Kaneda, R. Arakawa, M. Okamoto, K. Hirose, T. Tanaka and K. Naemura, J. Chem. Soc., Perkin Trans. 2, 1998, 701 RSC.
- D. V. Dearden, C. Dejsupa, Y. Liang, J. S. Bradshaw and R. M. Izatt, J. Am. Chem. Soc., 1997, 119, 353 CrossRef CAS; Y. Liang, J. S. Bradshaw, R. M. Izatt, R. M. Pope and D. V. Dearden, Int. J. Mass Spectrom., 1999, 185–187, 977 CrossRef; I.-H. Chu, D. V. Dearden, J. S. Bradshaw, P. Huszthy and R. M. Izatt, J. Am. Chem. Soc., 1993, 115, 4318 CrossRef CAS.
- M. Albrecht, S. Mirtschin, M. de Groot, I. Janser, J. Runsink, G. Raabe, M. Kogej, C. A. Schalley and R. Fröhlich, J. Am. Chem. Soc., 2005, 127, 10371 CrossRef CAS; M. Albrecht, M. Baumert, J. Klankermayer, M. Kogej, C. A. Schalley and R. Fröhlich, Dalton Trans., submitted Search PubMed. Earlier work on ligand exchange within helicates: L. J. Charbonnière, A. F. Williams, U. Frey, A. E. Merbach, P. Kamalaprija and O. Schaad, J. Am. Chem. Soc., 1997, 119, 2488 Search PubMed.
- For reviews on self-assembled metallo-supramolecular complexes, see: C. Piguet, G. Bernardinelli and G. Hopfgartner, Chem. Rev., 1997, 97, 2005 Search PubMed; D. L. Caulder and K. N. Raymond, Acc. Chem. Res., 1999, 32, 975 CrossRef CAS; S. Leininger, B. Olenyuk and P. J. Stang, Chem. Rev., 2000, 100, 853 CrossRef CAS; B. J. Holliday and C. A. Mirkin, Angew. Chem., Int. Ed., 2001, 40, 2022 CrossRef CAS; M. Fujita, K. Umemoto, M. Yoshizawa, N. Fujita, T. Kusukawa and K. Biradha, Chem. Commun., 2001, 509 CrossRef CAS.
- C. A. Schalley, T. Müller, P. Linnartz, M. Witt, M. Schäfer and A. Lützen, Chem.–Eur. J., 2002, 8, 3538 CrossRef CAS . For a different method to ionise and characterise metallo-supramolecular complexes by mass spectrometry, see: S. Sakamoto, M. Fujita, K. Kim and K. Yamaguchi, Tetrahedron, 2000, 56, 955 Search PubMed . Early work on metallo-supramolecular compounds: E. Leize, A. Van Dorsselaer, R. Krämer and J.-M. Lehn, J. Chem. Soc., Chem. Commun., 1993, 990 CrossRef CAS; G. Hopfgartner, F. Vilbois and C. Piguet, Rapid Commun. Mass Spectrom., 1999, 13, 302 Search PubMed.
- M. Engeser, A. Rang, M. Ferrer, A. Gutiérrez and C. A. Schalley, Int. J. Mass Spectrom., in press Search PubMed.
- F.-G. Klärner and B. Kahlert, Acc. Chem. Res., 2003, 36, 919 CrossRef.
- C. A. Schalley, C. Verhaelen, F.-G. Klärner, U. Hahn and F. Vögtle, Angew. Chem., Int. Ed., 2005, 44, 477 CrossRef CAS.
- R. G. Cooks, J. S. Patrick, T. Kotiaho and S. A. McLuckey, Mass Spectrom. Rev., 1994, 13, 287 CAS.
- P. B. Armentrout, Top. Curr. Chem., 2003, 225, 233 CAS.
- M. A. Freitas, C. L. Hendrickson and A. G. Marshall, Rapid Commun. Mass Spectrom., 1999, 13, 1639 CrossRef CAS; M. A. Freitas, C. L. Hendrickson and A. G. Marshall, J. Am. Chem. Soc., 2000, 122, 7768 CrossRef CAS.
- W. D. Price, P. D. Schnier, R. A. Jokusch, E. F. Strittmatter and E. R. Williams, J. Am. Chem. Soc., 1996, 118, 10640 CrossRef CAS; W. D. Price, P. D. Schnier and E. R. Williams, J. Phys. Chem. B, 1997, 101, 664 CrossRef CAS.
- M. B. More, E. D. Glendening, D. Ray, D. Feller and P. B. Armentrout, J. Phys. Chem., 1996, 100, 1605 CrossRef CAS; D. Ray, D. Feller, M. B. More, E. D. Glendening and P. B. Armentrout, J. Phys. Chem., 1996, 100, 16116 CrossRef CAS; M. B. More, D. Ray and P. B. Armentrout, J. Phys. Chem. A, 1997, 101, 831 CrossRef CAS; M. B. More, D. Ray and P. B. Armentrout, J. Phys. Chem. A, 1997, 101, 4254 CrossRef CAS; M. B. More, D. Ray and P. B. Armentrout, J. Phys. Chem. A, 1997, 101, 7007 CrossRef CAS; M. B. More, D. Ray and P. B. Armentrout, J. Am. Chem. Soc., 1999, 121, 417 CrossRef CAS; P. B. Armentrout, Int. J. Mass Spectrom., 1999, 193, 227 CrossRef CAS.
- D. M. Peiris, Y. Yang, R. Ramanathan, K. R. Williams, C. H. Watson and J. R. Eyler, Int. J. Mass Spectrom., 1996, 157–158, 365.
- P. D. Schnier, J. S. Klassen, E. F. Strittmatter and E. R. Williams, J. Am. Chem. Soc., 1998, 120, 9605 CrossRef CAS.
| This journal is © The Royal Society of Chemistry 2006 |