Fluorescence technologies for the investigation of chemical libraries†
Eric
Trinquet
and
Gérard
Mathis
CISBio International, BP 84175, 30204, Bagnols sur Cèze cedex, France
First published on 19th June 2006
1 Introduction
Fluorescent techniques have been developing dramatically this last decade and are now in position to represent more than 60% of the detection technologies used in High-Throughput Screening (HTS).20 The reason for this hegemony originates from two intrinsic properties of fluorescence.Sensitivity
The fluorescence intensity IF is expressed by IF = I0 εϕ Cl where I0 stands for the excitation light source intensity, C for the fluorophore concentration, l for the light path. ε and ϕ are respectively the molar absorptivity and quantum yield and are characteristics of the fluorophore.33It is obvious that, at low concentration, increasing the excitation power will lead to an increase of the measured signal and therefore, if background can be controlled, to a theoretically unlimited sensitivity.
A second consequence of this relation is that unlike radioactivity or luminescence, the fluorescence is proportional to the quantity of tracer in the observed volume.
High content of the fluorescent signal
The extraordinarily rich content of fluorescence output, characterized by energy (absorption and emission wavelength), lifetime, quantum yield, and anisotropy. Together with the large panel of possible interactions within the photo physical pathways, like electron or energy transfer and variation of rotational or translational correlation time, these characteristics have enabled the construction of homogeneous assays that do not require separation steps, for example, the very popular polarization and fluorescence resonance energy transfer (FRET) assays.The possibility of having mix and measure formats that do not require separation steps as well as the extreme sensitivity and relative independence of the measurement on the volume of the sample, have made fluorescence techniques the core detection technologies for miniaturized ultra-HTS (uHTS).
This unique set of properties has convinced instrument makers to introduce versatile, multi-technology microplate readers adapted for HTS.
However, this ideal description should not overlook the difficulties encountered when using homogeneous fluorescent technologies in the real world.
In fact, it is worthwhile to note that all these homogeneous methods were developed in the 1970s and early 1980s with a targeted application in automated diagnostic immunoassay systems.21,44 Despite the extraordinarily creative work of E. Ullman and co-workers at SYVA Company, none of the technologies they developed could be launched on this market, primarily as a result of the extremely variable optical and quenching behaviour of human serum. Among possible interferences, one can make distinctions between:10
–Optical interference generated by the variations of the optical properties of the media at the excitation or emission wavelength (inner filter effect).
–Interference with the intra- and intermolecular photophysical processes.
–Interference by the fluorescence of proteins, compounds, or nonspecific adsorption of the tracer on proteins.
Because of the very stringent reliability requirements for diagnostic applications, the only homogeneous techniques that have survived in this field are the fluorescence polarization (FP) methods originally developed by Abbott21 and the homogeneous time resolved fluorescence (HTRF) and TRACE® approaches developed later by CIS bio international.25,26
The aim of this chapter is not to review in great details all the fluorescent technologies used in HTS because they have already been largely described in dedicated articles or books.
We will instead describe rapidly the principles of each one, making reference to more detailed descriptions while focusing more on the robustness and possible hurdles and drawbacks which may be encountered when these technologies are used to screen chemical libraries in the real world of HTS.
2 Dissociation-enhanced lanthanide fluoroimmunoassay
The dissociation-enhanced lanthanide fluoroimmunoassay (DELFIA) technology uses lanthanide chelates as fluorescent probes. These chelates, which exhibit a long-lived fluorescence lifetime, are based on the noncovalent association of a chelate and a lanthanide ion, usually europium or terbium.19 The chelate protects the lanthanide ion from potential quenching by its environment and acts as an antenna by collecting the energy from the excitation source before transferring it to the lanthanide ion. The long fluorescence lifetime of the complex is an intrinsic property of the lanthanide ion.Such probes, which can be excited in the UV using a nitrogen laser or a Xenon flash lamp, emit their fluorescence between 500 and 700 nm, depending on the specific lanthanide ion used. Their fluorescence lifetime is usually longer than 100 µs. Their use as fluorescent tracers allows the establishment of a time resolved fluorescent detection using pulsed excitation sources (Figure 1). This detection mode makes it possible to reject most of the fluorescent background given by biological media, by instrumentation components, or by the chemical compounds to be tested in HTS.
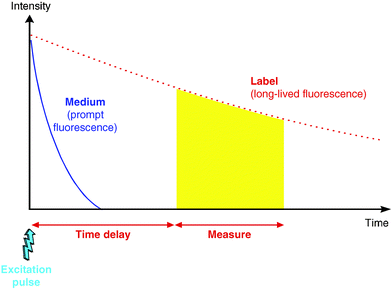 | ||
| Fig. 1 Time-resolved detection of a fluorescent signal. The fluorescent signal from the long-lived tracer (dashed line) is integrated after a fixed delay time to exclude the fluorescence background (solid line) from the measurement window (shaded area). | ||
The luminescent lanthanide chelates designed for DELFIA are not stable in biological media. To circumvent this limitation, a heterogeneous assay based on a two-step approach was designed. In the first step, biomolecule conjugates bearing nonluminescent chelates (derivatives of EDTA or diethylenetriaminepentaacetate (DTPA)) were used to carry the lanthanide ions during the biological reaction. In the second step, the lanthanide ions were dissociated from the nonfluorescent chelates by adding a large excess of a different chelating agent that generates a strongly luminescent complex.36
Due to its heterogeneous nature (separation of the biological media prior to the measurement) and the use of a time-resolved detection, DELFIA is quite insensitive to fluorescence background, so very low detection limits can be achieved.48 In this technology, the rare earth ion is in fact the tracer and can be present at very low concentration. Therefore, with DELFIA, the main risks for interference come from possible contamination by other rare earth ions, which can be released by the vessels (glass) or present in dust. DELFIA has been used to probe a large diversity of molecular interactions; however, the washing steps needed to run a DELFIA assay strongly limit its implementation in HTS.10 Therefore, homogeneous technologies using fluorescence like enzyme fragment complementation (EFC), FP, or HTRF are progressively replacing it for a large number of applications.
3 Enzyme fragment complementation
This technology uses complementation of β-galactosidase fragments to generate a fluorescent or a chemiluminescent signal. When a small α fragment peptide of 4 kDa called ProLabel interacts with an ω-deletion mutant of the enzyme (called Enzyme Acceptor), an active tetrameric form of the β-galactosidase results.11 The active enzyme can generate a signal by hydrolysing fluorescent substrates like 4-methylumbelliferyl β-D-galactopyranoside (4-MUG) or Resofurin, or other luminescent substrates. Since the interaction between the selected enzyme fragments occurs with a nanomolar affinity, detection limits in the same concentration range can be achieved without separation steps in homogeneous assays.The ProLabel peptide can be chemically conjugated or recombinantly fused to various biomolecules. To probe molecular interactions, EFC assays are based on a competition between the free and the ProLabel peptide-conjugated form of the biomolecule involved in the interaction under study. Bound to its interaction partner, the ProLabel-labelled biomolecule is not able to complement with the Enzyme Acceptor. Therefore the signal generated by the β-galactosidase is proportional to the concentration of the free biomolecule in the assay.11
EFC assays can be easily automated and miniaturized due to their homogeneous format and can therefore be used to screen large libraries of chemical compounds against a large diversity of biological targets, such as kinases or G Protein Coupled Receptors.15
However, depending on the substrate used in the enzymatic reaction, EFC is sensitive to compound interferences. Fluorescent compounds may increase the signal background of the assay, particularly if a green-fluorescent substrate like 4-MUG is used to generate the signal. The use of a red-shifted fluorescent substrate like Resofurin reduces the number of interferences from auto-fluorescent compounds.49 Since the EFC signal readout is only based on a fluorescence or luminescence intensity, coloured compounds, or compounds which interfere with substrates by affecting their photo-physical properties can decrease the EFC signal and therefore may be interpreted as false positives in HTS.16 Moreover, as for any enzyme, galactosidase inhibitors may be present in libraries and impair the quality of the results.
4 Fluorescence polarization
In FP, the use of polarized light to excite a solution of fluorescent molecules results in preferential excitation of the molecules that have their transition moments (dipoles) parallel to the direction of the polarized light of excitation. The polarization of their emitted light depends upon how fast the fluorescent probes rotate during the lifetime of its excitation state:9 the faster the rotation, the smaller the polarized signal (P).The fluorescent probes usually used in FP possess fluorescent lifetimes shorter than 10 ns. For such probes, significant changes in their polarized signal can be detected in a range of molecular mass between 5 and 40 kDa.33
A large number of homogeneous assays have been developed using FP by inducing a dramatic change in the molecular mass of the moiety carrying the fluorescent probe. As an example, an increase of the polarized signal of a small fluorescently labelled peptide freely diffusing in solution could be detected after its binding to a receptor.4
A relatively simple instrument set-up can be used to detect such changes in the polarized signal (Figure 2). Fluorescence detected using the two polarization filters successively placed in the fluorescence emission pathway, one parallel (Iparallel) and one orthogonal (Iorthogonal) to the polarized excitation light, enables the polarized signal (P) to be calculated according to the following formula:
| P = (Iparallel − Iorthogonal)/(Iparallel + Iorthogonal) |
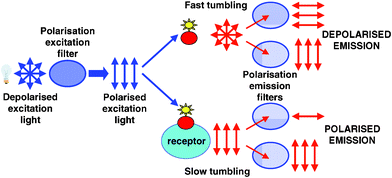 | ||
| Fig. 2 Schematic diagram of the instrument set-up used to detect a polarized signal. Arrows indicate the orientation of the excitation light and the orientation of the fluorescence emitted by the probe, which is dependent on its tumbling speed. | ||
The ratiometric nature of the polarized signal makes FP independent of the fluorescence intensity and more tolerant to fluorescence quenching and light scattering than the fluorescence intensity-based measurements.10,33
However, fluorescence background from chemical compounds or biological media can affect the accuracy of FP. As such fluorescence background mainly arises in the wavelength range between 400 and 550 nm, the use of red dyes emitting above 550 nm can be an effective way to partially overcome this problem.43
The hydrophobic nature of some small fluorescent ligands can also induce their non-specific binding to various proteins like bovine serum albumin (BSA). This binding artificially increases the rotational correlation time and, as a consequence, their polarized signal and therefore may affect the assay result.
Despite a limited sensitivity in the low-range nanomolar, the large availability of FP-compatible instruments, the simplicity and low cost of the assay make FP quite popular in HTS. However, the short fluorescence lifetimes of the conventional fluorescent labels (below 10 ns) limit the use of FP to biological interactions involving molecules with a molecular weight below 15 kDa. To overcome this limitation, fluorophores possessing longer lifetime, like ruthenium(II) complexes with lifetimes around 300 ns, have been used to probe the interaction between larger proteins.39 However, these fluorescent labels are not very bright, which very much limits their use in HTS.42
5 Fluorescence correlation spectroscopy
Fluorescence correlation spectroscopy (FCS) is based on the measurement of intensity fluctuations. These fluctuations can be detected when the volume of solution under investigation is so small that the fluorescent signal measured is no longer randomized over many fluorescent molecules but arises when individual molecules pass through the detection volume, the signal is therefore related to their diffusion coefficient. Typically, the detection volume is around one femtoliter (confocal volume) and requires a confocal microscopic instrument set-up to be investigated. Fluorescent intensity fluctuations are analysed using autocorrelation techniques. The resulting autocorrelation function gives information regarding the concentration of fluorescent molecules, their diffusion time through the confocal volume, and the average brightness per molecule.30Variations in the diffusion time of the fluorescent molecules can therefore be detected and used to probe molecular interactions in FCS. Such variations are induced by a large increase in the molecular mass of the fluorescence molecules (>10 fold) upon their binding to a specific partner (e.g. a large protein like a receptor).33
Due to the use of a confocal volume, FCS is particularly suited for miniaturization in HTS and relatively insensitive to auto fluorescent test compounds.30 Moreover, in compound testing, the small path length of the confocal volume greatly limits any filter effects on fluorescence intensity.33 As in FP, the requirement for large differences in mass in the assay design is a limitation to the applicability of FCS. However, it can be overcome by methods like Fluorescence Intensity Distribution Analysis (FIDA) or two-colour cross correlation derived from the original FCS concept.17,47
The high cost of a FCS instrument limits its use in HTS, as does the relatively long reading time (several seconds) required at the sub-nanomolar concentrations of fluorescent labels needed to accurately calculate the autocorrelation function.33 Again, as for FP, non-specific adsorption of the labelled ligand onto endogenous proteins, inducing a large variation of diffusion coefficient, can occur and lead to impaired results. Quenching processes can also modify the tracer lifetime and have an impact on the quality of the results.
6 Amplified luminescent proximity homogeneous assay (AlphaScreen™)
AlphaScreen™ is a bead-based technology that allows the development of homogeneous assays in HTS.35 A donor bead and an acceptor bead are used in AlphaScreen™, each one bearing a biological partner of the interaction under investigation. When the biological interaction brings the beads in close proximity, the 680 nm laser excitation of the donor beads induces a cascade of chemical reactions leading to the generation of a fluorescent signal from the acceptor bead. Upon laser excitation, the photosensitizer (phthalocyanine) in the donor bead excites ambient oxygen to the singlet state; the singlet oxygen then diffuses across to react with thioxene derivatives in the acceptor bead. Chemiluminescence is therefore generated by thioxene derivatives and activates fluorophores contained in the same acceptor bead through an energy transfer process. The fluorophores subsequently emit fluorescence in the 520–620 nm wavelength range.Since the lifetime of singlet oxygen in a non-quenching media is around 4 µs, it can diffuse over a distance of about 200 nm. AlphaScreen™ can therefore probe interactions over distances similar to the dimensions of large biological molecules, allowing the investigation of a large number of biological targets. Because of the high concentration of photosensitizer in the donor bead, up to 60,000 singlet oxygen molecules can be generated per second resulting in a significant signal amplification after the donor bead excitation. Therefore, very low detection limits can be achieved.
Because of its homogeneous format, AlphaScreen™ can be easily miniaturized, making it suitable for screening chemical compound libraries.7,46 However, special cautions have to be taken in handling the donor beads because of the sensitivity of the photosensitizer to ambient light.10
An excitation wavelength higher than the emission wavelength ensures a low assay fluorescent background by avoiding any auto fluorescence from biological media or compounds. However, AlphaScreen™ may be sensitive to other types of interferences. Antioxidants or other quenchers of reactive oxygen species like metal ions can strongly affect the emitted signal.1,22,32 Moreover, since the AlphaScreen™ detection is only based on a fluorescence-intensity measurement, coloured compounds absorbing in the 500–600 nm wavelength range artificially decrease the AlphaScreen™ signal and therefore may be detected as false positives in HTS.10
7 Fluorescence resonance energy transfer
FRET is a photophysical process based on a non-radiative energy transfer between a fluorescent donor and a suitable energy acceptor.38 To occur, FRET requires an energetic compatibility between the two components of the FRET pair. Such compatibility exists if the absorption spectrum of the acceptor overlaps the emission spectrum of the donor. Since the efficiency of the FRET process is dependent on the inverse sixth power of the distance between the two molecules, donor and acceptor have to be in close proximity to allow a significant FRET.38 For commonly used FRET pairs, a 5-nm R0 value (corresponding to a 50% FRET efficiency) can be attained, giving an operative distance in the range of 1–8 nm.28 Beyond this range, the FRET efficiency decreases very rapidly. FRET could therefore probe interactions over distances similar to the dimensions of biological molecules. For this analysis, both molecules involved in the interaction have to be labelled by one component of the FRET pair.FRET allows the design of homogeneous assays in which different methods can be used to discriminate the specific signal from other signals emitted by the free donor and/or the free acceptor (Figure 3). Most commonly used FRET readouts are based on detecting variations in fluorescence intensity: a decrease in fluorescence emission from the donor,37 increase in fluorescence emission from the acceptor (if the chosen acceptor is a fluorescent probe),8 or a change in their ratio (e.g. acceptor fluorescence emission/donor fluorescence emission).29 Since the FRET process also changes the donor fluorescence lifetime (the higher the FRET efficiency, the lower the donor fluorescence lifetime), monitoring this parameter can also be used as a FRET detection method.5 This analysis can be achieved using specific instruments based on modulation-phase techniques or on photon-counting techniques.
 | ||
| Fig. 3 Design of a homogeneous FRET assay. The spatial proximity between the donor and the acceptor induced by the binding of the biomolecules allows the FRET to occur. Upon FRET, the donor emission is decreased while the sensitized acceptor can emit fluorescence (if a fluorescent probe is used as acceptor). | ||
To screen chemical libraries, readouts based on a ratio of fluorescence intensities as well as on donor fluorescence lifetime variations can be of a great advantage to correct the FRET signal from the optical variations induced by some of the highly coloured compounds that are often found in libraries.10 This correction can limit false-positive results in HTS; however, in practise, these analyses are difficult to implement.
The utility of ratiometric detection is strongly limited by the large overlaps in the excitation spectra and/or between the fluorescence emission spectra of the fluorescent probes commonly used as donor or acceptor in FRET. Because of these overlaps, the acceptor can be excited directly at the donor excitation wavelength and the donor can emit fluorescence at the acceptor fluorescence detection wavelength. This lack of spectral selectivity results in a significant background signal and therefore significantly reduces the signal/background ratio of the FRET assays using FRET pairs such as fluorescein/rhodamine or cyanine for in vitro applications, or cyan fluorescent protein (CFP)/yellow fluorescent protein (YFP) for intracellular applications.13
The use of the donor fluorescence lifetime as a FRET readout is currently limited by several parameters:
• The FRET process is not the only factor that can modify the donor fluorescence lifetime. The local environment of the donor or its quenching by any compound of the library under investigation can also change its lifetime significantly and therefore disturb the FRET detection.
• An accurate determination of the fluorescence lifetime of the donor molecules involved in a FRET process can be difficult to achieve, particularly when only a small percentage of the total number of donor molecules are involved in the FRET process.
• Until recently, none of the plate readers commonly used in HTS was able to determine the lifetime of a fluorescent probe.16
Therefore, due to the practical limitations described above, the use of a non-fluorescent acceptor (usually called a quencher) is still the most popular way to use FRET in HTS applications. Most of the time, FRET is used to probe a protease activity using a peptide substrate labelled at each end of its sequence with the fluorescent donor and the quencher. In that case, the FRET readout is an increase in the donor fluorescence emission upon peptide cleavage by the protease.14 However, as discussed above, such FRET readouts can lead to a significant number of false positive results in HTS.
8 Bioluminescence resonance energy transfer
Like FRET, bioluminescence resonance energy transfer (BRET) is based on non-radiative energy transfer between a donor and an acceptor. However, in BRET, the donor is a luminescent molecule, excited by the enzyme Renilla Luciferase (Rluc), and not a fluorescent molecule. The BRET acceptor can be a fluorescent protein like green fluorescent protein (GFP) or YFP. If the enzyme and the fluorescent protein are in close proximity (d < 10 nm), an energy transfer will occur between the Rluc substrate (coelanterazine) and the fluorescent protein, leading to emission from the latter.18Since Rluc and GFP recombinantly fused proteins can be expressed in living cells, BRET is an interesting tool for monitoring molecular interactions in cell-based assays. BRET has been particularly used for the study of GPCRs by probing receptor oligomerization or activation.40
The BRET signal is determined ratiometrically by dividing the acceptor emission intensity by the donor emission intensity. Moreover, the use of an enzyme to excite the luminescent donor (coelanterazine) avoids the use of any excitation source, thereby eliminating interferences from auto fluorescent compounds and inner filter effects at the excitation wavelength of the donor in HTS. However, like in FRET assays using ratiometric detection, the signal/background ratio of BRET assays is significantly affected by the overlap between the Rluc substrate and the GFP emission spectra. An improved BRET version, named BRET2, has been developed to overcome this problem.18 A coelanterazine analogue, called Deep Blue C, is used as Rluc substrate, resulting in a significant shift in the Rluc emission from 480 to 400 nm. A specially designed green fluorescent protein (GFP2) mutant emitting at 510 nm is used as BRET2 acceptor. Therefore, the spectral resolution of BRET2 is significantly higher than that of BRET (110 nm instead of 50 nm), allowing its use in HTS to screen for GPCR targets.45 However, the use of Deep Blue C as Rluc substrate gives a much lower quantum yield than coelanterazine, and as a result a highly sensitive instrument must be used for BRET2.
9 Homogeneous time resolved fluorescence
HTRF is a homogeneous technology which combines a FRET process with time-resolved fluorescence detection to probe biomolecular interactions.27,44 This combination is made possible through the use of a long lifetime fluorescent FRET donor, a lanthanide cryptate. Cryptates are formed by the inclusion of a rare earth ion (e.g. europium) into the 3-dimensional cavity of a ligand called cryptand.3 The cryptand plays the same role as the chelate in the luminescent lanthanide chelates used in DELFIA; it protects the lanthanide ion from potential quenching by the environment, and it acts as an antenna by collecting the energy from the excitation source before transferring it to the lanthanide ion.2 However, due to its caged structure, the cryptate kinetic stability is dramatically higher than the one of the lanthanide chelates. Rare earth chelates would be dissociated in acidic media or in the presence of divalent ions like Mn2+, while rare earth cryptates can be used under drastic chemical conditions, like reverse phase chromatography in the presence of trifluoroacetic acid, and are not affected by the presence of divalent ions in the media.6Europium cryptates are excited in the UV wavelength range either by a xenon flash lamp or by a nitrogen laser. Their fluorescence occurs in a wavelength range between 550 and 710 nm with typical narrow emission lines. Since the electronic transitions of the europium ion are forbidden by quantum mechanical rules, the cryptate fluorescence lifetime is exceptionally long, in the range of 100–1000 µs.
Europium cryptates can be associated with various acceptors, originally with a cross-linked allophycocyanin called XL66525 or with small fluorescent near infrared dyes that have been selected so that their photophysical properties fit those of the europium cryptate for an efficient FRET process:
–High molar absorptivity at the cryptate emission wavelength, which allows a high transfer efficiency (R0 value above 7 nm).
–Fluorescence emission in a spectral range (665 nm) where the cryptate signal is insignificant (Figure 4).
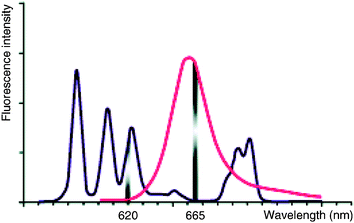 | ||
| Fig. 4 Spectral selectivity of the HTRF signal. Characteristics of the emission spectra both of the europium cryptate (darker line) and the acceptor (paler line) are responsible for the spectral selectivity between the acceptor fluorescence emission at 665 nm and the donor fluorescence emission at 620 nm. | ||
–A high fluorescence quantum yield, which allows an optimal FRET signal.
In FRET, the lifetime of the acceptor's emission contains a contribution equal to the donor's lifetime in the presence of energy transfer.25,31,34 Therefore, the use of a long lifetime donor like the europium cryptate leads to a long-lived emission of the acceptor, which allows time-resolved fluorescence measurements. In the time domain, at the acceptor emission wavelength, a clear distinction can be made between the long-lived signal from the acceptor involved in the FRET process with the europium cryptate and the short-lived signal emitted by the freely diffusing acceptor. This temporal selectivity allows the isolation of a FRET signal free from the short-lived fluorescent background25 (Figure 5).
 | ||
| Fig. 5 Temporal selectivity of the HTRF signal. At the acceptor emission wavelength (665 nm), the FRET signal from the sensitized acceptor (C) and the small signal from the europium cryptate (B) can be easily distinguished from the free acceptor signal and from the background caused by chemical compounds or biological media (A). | ||
The exceptionally large spectral selectivity obtained with the different FRET pairs used in HTRF allows the establishment of an efficient ratiometric signal detection. The measurement of the cryptate emission signal (usually done at 620 nm) reflects any absorption by the assay medium at the excitation wavelength. Since the acceptor signal at 665 nm is also inversely proportional to the media absorbance, it can be ‘ratioed’ to the cryptate signal to give a measurement, which is then independent of the media optical properties at the excitation wavelength. The ratio of acceptor signal to europium cryptate signal thus depends solely on the specific biological interactions under study.23–25
The high FRET efficiency obtained in HTRF assays enables a large variety of biological events to be probed. Protein/protein interactions, enzymatic activities (e.g. kinases or proteases), or a large number of biomarkers have been detected with a very low detection limit.6 Like the other homogeneous fluorescent technologies like FP or FCS, HTRF can be easily automated and miniaturized down to a 1536# wells plate format for the HTS of large libraries of chemical compounds.12
Moreover, the HTRF signal readout minimizes the instances of compound interference in HTS: the ratiometric signal measurement overcomes the influence of highly coloured compounds while the time-resolved fluorescence detection discards most of the fluorescence background originating from biological media and/or chemical compound autofluorescence.10
With HTRF, the only possible interferences that are not easily corrected are due to the inner filter effect at the acceptor emission wavelength. However, only very few compounds in the libraries absorb highly in the near infrared region. Possible cryptate quenching is even corrected to a certain extent by the signal ratio, while only acceptor quenching is not taken into account, similar to the situation with the other technologies.
10 Conclusion
As noted in the introduction, even if the fluorescence technologies are extremely sensitive, versatile, and well adapted to automation for HTS, one should not forget the intrinsic limitations of these technologies, which can be caused by three types of effects.• Quenching generated by external interactions with the intramolecular excitation process (electron transfer, FRET, and bleaching).
• Optical interferences generated by coloured products absorbing at the excitation or emission wavelengths (inner filter effects), or light diffusion by small particles or imperfectly dissolved compounds.
• Fluorescence of the library compounds or the biological proteins.
It is important to realize that no studies have been published describing the fluorescent and absorption properties of library compounds in general, and analysis of libraries from this perspective are not routinely carried out.
Unpublished results41 show that very high fluorescence can indeed be reached by a non-negligible number of compounds, even in the near infrared part of the spectrum. Light diffusion can also be caused by insoluble compounds.
What type of impact such compounds have on the assay response depends very much on the assay format and the specific technology used.
For example, in a FRET assay for the research of a receptor ligand inhibitor, the presence of a library compound which fluoresces at the acceptor wavelength will lead to a false negative result (compensation of the decrease of the FRET signal by the fluorescent compound); on the contrary, the same compound would give a false positive result in a cytokine assay using a sandwich format with two monoclonals (compound fluorescence will be interpreted as an FRET increase). In both cases, the use of HTRF would have corrected for the fluorescence of the compound in the acceptor channel.
It is our experience that the results obtained by using fluorescent techniques that do not use ratiometric measurement and/or time resolution should be carried out and validated with great care in order to avoid false positive or negative results.
Careful simulation of the influence of such drawbacks should be performed and proper references and thresholds set before implementing automatic interpretation of the data.
References
- M. P. Alia and J. Matysik, Amino Acids, 2001, 21(2), 195–200 Search PubMed.
- B. Alpha, R. Ballardini, V. Balzani, J. M. Lehn, S. Perathoner and N. Sabbatini, Photochem. Photobiol., 1990, 52, 299 CrossRef CAS.
- B. Alpha, J. M. Lehn and G. Mathis, Angew. Chem., Int. Ed. Engl., 1987, 26, 266 CrossRef.
- M. Allen, J. Reeves and G. Mellor, J. Biomol. Screening, 2000, 5(2), 63–69 Search PubMed.
- P. Bastiaens and P. Parker, Patent WO 00/43780, 2000 Search PubMed.
- H. Bazin, E. Trinquet and G. Mathis, J. Biotechnol., 2002, 82(3), 233–250 CAS (Review).
- R. Bossé, C. Illy, J. Elands and D. Chelsky, Drug Discovery Today, 2000, 1, 42–47 CrossRef CAS.
- S. Chan, D. Arndt-Jovin and T. Jovin, J. Histochem. Cytochem., 1979, 27, 56 Search PubMed.
- W. J. Checovich, R. E. Bolger and T. Burke, Nature, 1995, 375, 254–256 CAS.
- J. Comley, Drug Discov. World, 2003, 4(3), 91–97 Search PubMed.
- R. M. Eglen, Assay Drug Dev. Technol., 2002, 1, 97–104 Search PubMed.
- M. Ferrer, P. Zuck, G. Kolodin, S. Mao, R. Peltier, C. Bailey, S. Gardell, B. Strulovici and J. Inglese, J. Anal. Biochem., 2003, 317, 94 Search PubMed.
- F. Gaits and K. Hahn, Sci. STKE, 2003, 2003, pe3 Search PubMed.
- J. George, M. L. Teear and C. G. Norey, J. Biomol. Screening, 2003, 8(1), 72–80 Search PubMed.
- R. Golla and R. Seethala, J. Biomol. Screening, 2002, 7(6), 515–525 Search PubMed.
- P. Gribbon and A. Sewing, DDT, 2003, 8(22), 1035–1043 Search PubMed.
- U. Haupts, M. Rüdiger, S. Ashman, S. Turconi, R. Bingham, C. Wharton, J. Hutchinson, C. Carey, K. J. Moore and A. J. Pope, J. Biomol. Screening, 2003, 8, 19–33 Search PubMed.
- A. Heding, Expert Rev. Mol. Diagn., 2004, 4(3), 403–411 Search PubMed.
- I. Hemmila, S. Dakubu, V. M. Mukkala, H. Siitari and T. Lövgren, Anal. Biochem., 1984, 137, 335–343 CrossRef CAS.
- Hightech Business Decisions, High Throughput Screening, 2003, survey Search PubMed.
- M. E. Jolley, J. Anal. Toxicol., 1981, 5, 236–240.
- T. Kon, T. Tanigawa, K. Hayamizu, M. Shen, T. Tsuji, Y. Naito and T. Yoshikawa, Redox Rep., 2004, 9(6), 325–330 Search PubMed.
- M. Mabile, G. Mathis, E. J. P. Jolu, D. Pouyat and C. Dumont, Method for Measuring the Luminescence in a Luminescent Assay, 1991 Search PubMed WO 9213264. US 5527684.
- M. Mabile, G. Mathis, E. J. P. Jolu, D. Pouyat and C. Dumont, Apparatus for Measuring Luminescence in a Luminescent Assay, 2002 Search PubMed US 6 352 672.
- G. Mathis, Clin. Chem., 1993, 39(9), 1953–1959 CAS.
- G. Mathis, F. Socquet, M. Viguier and B. Darbouret, Anticancer Res., 1997, 17, 3011–3014 CAS.
- G. Mathis, Clin. Chem., 1995, 41(9), 1391 CAS.
- J. J. Meng, M. Rojas, W. Bacon, J. T. Stickney and W. Ip, Methods Mol. Biol., 289, 34, 341–357 Search PubMed.
- A. Miyawaki, J. Llopis, R. Heim, J. Mc Cafferty, J. Adams, M. Ikura and R. Tsien, Nature, 1997, 388, 882 CrossRef CAS.
- K. J. Moore, S. Turconi, S. Ashman, M. Ruediger, U. Haupts, V. Emerick and A. J. Pope, J. Biomol. Screening, 1999, 4(6), 335–353 Search PubMed.
- L. E. Morrison, Anal. Biochem., 1988, 174, 101–120 CrossRef CAS.
- Packard Website, AlphaScreen™ Technology—Application Note AC-012, Analysis of Potential Compound Interference of AlphaScreen™ Signal, http://www.perkinelmer.co.jp/tech/tech_ls/protocol_collection/asc-012.pdf, 2001 Search PubMed.
- A. J. Pope, U. M. Haupts and K. J. Moore, DDT, 1999, 4, 350–362 Search PubMed.
- P. W. Schiller, in Biochemical Fluorescence Concepts, Vol 1, F.C. Chem and H. Edeldoch (eds), Marcel Dekker, New York, 1976, 285–303 Search PubMed.
- R. Seethala and F. Prabhavathi, Handbook of Drug Screening, Marcel Dekker, New York, 2001, 106 Search PubMed.
- E. Soini and T. Lovgren, Crit. Rev. Anal. Chem., 1987, 18, 105 CrossRef CAS.
- D. Sokol, X. Zhang, P. Lu and A. Gewirtz, Proc. Natl. Acad. Sci. U. S. A., 1998, 95, 11538 CrossRef CAS.
- L. Stryer, Annu. Rev. Biochem., 1978, 47, 819 CrossRef CAS.
- E. Terpetschnig, H. Szmacinski and J. R. Lakowicz, Anal. Biochem., 1995, 227, 140–147 CrossRef.
- S. Terrillon, T. Durroux, B. Mouillac, A. Breit, M. Ayoub, M. Taulan, R. Jockers, C. Barberis and M. Bouvier, Mol. Endocrinol., 2003, 17(4), 677 Search PubMed.
- E. Trinquet and U. Böhmer, to be published.
- S. Turconi, R. P. Bingham, U. Haupts and A. J. Pope, DDT, 2001, 6(12), S27–S39 Search PubMed.
- T. C. Turek-Etienne, E. C. Small, S. C. Soh, T. A. Xin, P. V. Gaitonde, E. B. Barrabee, R. F. Hart and R. W. Bryant, J. Biomol. Screening, 2003, 8(2), 176–184 Search PubMed.
- E. F. Ulmann, J. Chem. Ed. Chem. Visc. Edu., 76, 6, 781–788 Search PubMed.
- M. Vrecl, R. Jorgensen, K. Pogacnick and A. Heding, J. Biomol. Screening, 2004, 9(4), 322 Search PubMed.
- A. Von Leoprechting, R. Kumpf, S. Menzel, D. Reulle, R. Griebel, M. J. Valler and F. H. Buttner, J. Biomol. Screening, 2004, 9(8), 719–725 Search PubMed.
- T. Winckler, U. Kettling, A. Koltermann and M. Eigen, Proc. Natl. Acad. Sci. U. S. A., 1999, 96, 1375–378 CrossRef.
- F. B. Wu and C. Zhang, Anal. Biochem., 2002, 311, 57–67 CrossRef CAS.
- X. Zhao, S. Panah, H. Pham, J. Araujo and R. Eglen, http://www.discoverx.com.
Footnote |
| † This is Chapter 10 taken from the book Exploiting Chemical Diversity for Drug Discovery (Edited by M. Entzeroth and P. A. Bartlett) which is part of the RSC Biomolecular Sciences series. |
| This journal is © The Royal Society of Chemistry 2006 |