Optimized protocols for the isolation of specific protein-binding peptides or peptoids from combinatorial libraries displayed on beads
Thomas Kodadek* and Kiran Bachhawat-Sikder
Departments of Internal Medicine and Molecular Biology, Division of Translational Research, University of Texas Southwestern Medical Center, 5323 Harry Hines Blvd., Dallas, TX 75390-9185, USA. E-mail: Thomas.kodadek@utsouthwestern.edu
First published on 28th November 2005
Abstract
Many methods have been published by which combinatorial libraries may be screened for compounds capable of manipulating the function(s) of a target protein. One of the simplest approaches is to identify compounds in a library that bind the protein of interest, since these binding events usually occur on functionally important surfaces of the protein. These protein-binding compounds could also be of utility as protein capture agents in the construction of protein-detecting microarrays or related analytical devices and as reagents for the affinity purification of proteins from complex mixtures. In this article, we provide optimized methods for screening libraries of molecules displayed on the beads on which they were synthesized. This is a particularly convenient format for library screening for laboratories with limited budgets and modest robotics capabilities.
 Thomas Kodadek | Thomas Kodadek received his BS in Chemistry from the University of Miami in 1981, a PhD in organic chemistry from Stanford University in 1985 and pursued post-doctoral studies at UCSF from 1985–1987 in biochemistry. He was a member of the Chemistry & Biochemistry faculty at the University of Texas at Austin until 1998, at which time he moved to his present position as Professor of Internal Medicine and Molecular Biology at the University of Texas Southwestern Medical Center in Dallas. He was appointed Director of the Division of Translational Research in 2005. |
 Kiran Bachhawat-Sikder | Kiran Bachhawat-Sikder obtained her MSc in Biochemistry from the University of Delhi, New Delhi, India and her PhD in Molecular Biophysics from the Indian Institute of Science, Bangalore, India under the supervision of Professor A. Surolia. She joined the proteomics group in Professor Thomas Kodadek's laboratory in 2001 as a post-doctoral researcher. She now holds the rank of Instructor. |
Introduction
A central tool in modern chemical biology is the ability to identify molecules from combinatorial libraries or compound collections that recognize specific proteins with high affinity.1 These protein-binding agents have a number of uses, ranging from potential pharmacological agents that either stimulate or inhibit the function of the target protein, to protein capture agents for the purification or detection of proteins in complex mixtures.2–4 Not surprisingly therefore, an enormous amount of effort has been expended in both commercial and academic laboratories to optimize different methods for screening compound collections or libraries. A comprehensive review of these methods is beyond the scope of this article, but these methodologies can be generally categorized as phenotypic screens, directed mechanistic screens, or binding assays.Phenotypic screens employ compounds or compound mixtures that have been segregated into the wells of microtiter plates,5,6 where they are mixed with cells or living organisms. One then monitors each well for some desired biological end point (phenotype) brought about by compounds in the library.7 This approach has proven to be a powerful system for the identification of biologically active small molecules, though its utility in providing a true chemical equivalent of genetic screens has been hampered by the difficulty in identification of the protein target(s) of the bioactive molecule.8 Directed mechanistic screens, usually for enzyme inhibitors, are procedurally similar in that the compounds are arrayed into the wells of microtiter plates and assessed in some straightforward, high-throughput biochemical assay. Therefore, both of these screening approaches require a significant infrastructure capable of arraying the compounds of interest into the wells of microtiter plates and to monitor the outcomes of the assays in each well.
Binding assays, on the other hand, can be done with far less investment in robotics, plate readers, etc. and thus may be more attractive to smaller laboratories without access to elaborate screening equipment. While protein-binding agents will not always modulate the function of the target protein, this is often the case (9 and references therein). In this report, we present optimized methods for screening combinatorial libraries of peptides and peptoids10 displayed on beads. We restrict our comments to these species because the structures of the compounds on a single bead can be deduced directly by protein sequencing methods, eliminating the need to encode a library created by split and pool methods. However, the protocols that we present for the screening process itself are quite general and can be used with any type of library. Indeed, Schepartz and coworkers recently reported adapting our methods to screening libraries of β-peptides on beads.11 Several versions of our basic method have been developed that differ only by the type of instrumentation employed. As is discussed below, certain pieces of equipment can increase the speed and convenience of bead screening, but even laboratories with access only to a fluorescence microscope and a protein sequencer can carry out the simplest version of this protocol.
Results and discussion
Selection of the solid support, library preparation and quality control
When we first decided to conduct library screens on beads, it was not absolutely clear what resin would be optimal for these efforts. An ideal resin would be suitable for both synthesis of the library, but also be able to act as a support for subsequent screening against the protein(s) of interest. This demands that the beads swell efficiently in both organic and aqueous solvents, that they have good mechanical stability, a suitable density of functional sites and low non-specific protein-binding properties. Furthermore, if one wishes to screen against fluorescently labeled proteins, as we do, then the beads must have low intrinsic fluorescence at the emission maximum of the label. After considerable experimentation, we found that TentaGel macrobeads (Rapp Polymere) represented the best compromise. We employ 170 micron beads, which have a loading capacity of about 0.5 mmol g−1. There are more than half a million beads in a gram of this material. The TentaGel beads have a cross-linked polystyrene core modified with long polyethylene glycol (PEG) chains, which endow them with good swellibility characteristics in both organic and aqueous solvents. The PEG chains also drastically reduce non-specific protein binding to the beads. More common polystyrene-based beads lacking the PEG modification, while convenient for synthesis, are unsuitable for library screening in aqueous solution. As will be detailed below, there are two significant drawbacks to TentaGel however. One is that many beads in any given batch display significant intrinsic fluorescence.12 The other is that Edman sequencing of peptoids with certain functional groups does not work well on this resin. Specifically, side chains derived from using glycine as the building block do not provide an obvious Edman derivative and, more seriously, somehow poison subsequent reactions, making it impossible to derive sequence downstream of this residue. We do not understand the chemical nature of this problem since on other types of resins, peptoids containing glycine-derived building blocks sequence efficiently. This is a significant limitation in our protocol that remains to be addressed. We do not know if this problem extends to all carboxylate side chains. Finally, it is not clear that proteins can access peptoids in the interior of the bead, so the amount of protein captured may be quite low. However, this is not a serious drawback since the fluorescently-labeled protein can be detected quite sensitively. It is worthwhile mentioning that we also tested ArgoPore beads (Argonaut Technologies), which have many of the same favorable characteristics of TentaGel, but much lower intrinsic fluorescence. Unfortunately, these beads are more sensitive mechanically and in the process of making the library, specifically during the shaking steps, a significant fraction of the beads broke, which provided problems in the protein screening steps because the broken beads tended to precipitate labeled protein, providing false positives. Therefore, we settled on TentaGel for all of our experiments. Note that other investigators have screened peptide libraries displayed on PEGA-NH2 resin (Novabiochem) (for example, see ref. 13) and this may be a good alternative choice, though we have not explored this resin.Both peptide and peptoid libraries have been made and screened on TentaGel beads. Experimental protocols are provided in the Methods section, but a few general points are worth making here. It is well known in combinatorial chemistry that an important issue is the purity of the compounds in the library. Low quality libraries, in which each supposedly pure compound is actually a mixture of the desired molecule and various side products, can cause major headaches later in the project where one must validate binding of the putative hit to the target protein. In the worst case, the real ligand might be a minor component that proves impossible to track down and characterize. Peptide synthesis is well developed and generally provides reliably clean products. For the creation of peptoid libraries however, we adopted a conservative approach of validating every synthetic building block prior to using it in a library synthesis.
Peptoids are made by the so-called “sub-monomer” route described by Zuckermann and co-workers at Chiron.14 This involves addition of an activated derivative of α-bromoacetate to the N-terminal nitrogen of the growing chain, followed by displacement of the bromide with a primary amine. In split and pool synthesis, the primary amine thus represents the diversity-generating element.15,16 If a new amine is to be employed that has not been used by us in library synthesis previously, we validate it in two ways. First, as suggested by Zuckermann and colleagues,15 we synthesized a pentamer in which the amine to be tested was sandwiched between two α-methylbenzyl amine-derived monomers, which behave extremely well in this chemistry. Unless the yield of the final product was at least 90%, we rejected this amine. In addition, we also synthesized a single peptoid containing sub-units derived from each amine to be used in the library synthesis to ensure their efficient incorporation into the oligomer. Single beads from this synthesis were picked and sequenced on an automated protein sequencer using Edman degradation chemistry (vide infra) to ensure that a clean peak was observed at each step. We also conducted the synthesis of the oligomer on standard polystyrene synthesis beads so that the final product could be cleaved from the resin with TFA and analyzed by HPLC. Again, >90% purity of the crude product was demanded in order for all of the building blocks to be employed for a library synthesis.
Once all of the monomers had been validated, we used the standard split and pool scheme to generate the combinatorial peptide or peptoid libraries. Several libraries have been synthesized in our laboratory varying between 4 and 10 residues in length and using from 5–12 different amino acid or amine building blocks.
Upon completion of the synthesis, 20 beads were picked at random from the library and subjected to sequencing by Edman degradation. If the library contains at least several thousand members, then all of these molecules should be different and each one must provide a clean sequence (i.e., only a single major peak at each step of the Edman sequencing reaction) in order for the library to be considered of good quality. Shown in Fig. 1, is a representative sequence chromatogram derived from a single bead picked at random from a peptoid library. This type of chromatogram, with a single strong peak at each step of the sequencing reaction, is indicative of a good quality library.
 | ||
| Fig. 1 (A) Comparison of the backbone framework of a peptide and a peptoid. (B) Representative sequence chromatogram of a bead picked up at random from a 6 mer peptoid library. (C) Deduced structure of the 6 mer peptoid. | ||
After synthesis and quality control are completed, the library beads are washed with dichloromethane, dried and stored at 4 °C until further use. Before using these beads for screening, they are soaked in DMF for 2 h and then overnight, at 4 °C in 1× Phosphate Buffered Saline (PBS).
Pre-screening and screening
Several different methods have been described for screening bead-displayed libraries for protein ligands. All of them have advantages and disadvantages. After considerable experimentation, we settled on screening against fluorescently labeled proteins and have published the results of several successful screens of this type.16–18 The experiment is relatively simple. One incubates the bead-displayed library with a labeled protein as well as unlabeled competitor proteins in an appropriate buffer. The beads are then washed thoroughly and those that retain the most fluorescent proteins are collected as potential hits. The protein is then removed from the beads and the sequence of the peptide or peptoid is obtained by Edman sequencing of the single bead. However, there are a number of extremely important details to which the experimenter must pay attention in order to obtain a suitable result. These are detailed below.In most of our experiments, we have employed proteins that have been labeled with lysine-reactive fluorescein or Texas Red reagents. A detailed protocol for protein labeling is provided in the Methods section. The general point however, is to ensure that the protein is not over-labeled. These fluorophores are relatively hydrophobic molecules that may promote binding interactions that are not indicative of the native protein, which is obviously to be avoided if possible. Thus, one should take care to check the conjugated product for the average ratio of fluorescent molecules to protein molecules and use only preparations where this number is no higher than 1.0–1.2. More recently, we have begun to employ native (i.e., not chemically-modified) proteins as targets, detecting the beads to which they are bound by subsequent incubation with a specific antibody against the target protein and a fluorescently-labeled secondary antibody. This protocol rules out the possibility that one will isolate a ligand that recognizes only a chemically-modified form of the target protein, but it also requires that one pre-screen the library for molecules that will bind to the primary and secondary antibodies (see below). Since we have not optimized this approach, it will not be discussed in detail here, but antibody-based detection is a potentially attractive screening method, assuming good antibodies are available for the protein of interest.
Ideally, one would pre-screen the bead library prior to exposure to the protein so as to remove any beads that exhibit significant intrinsic fluorescence. As mentioned above, one of the drawbacks of TentaGel beads is that there is a problem with background fluorescence.12 We have found that any particular batch of TentaGel represents a highly heterogeneous mixture of beads of different fluorescence intensities with an emission maximum in the green. This is a particular problem when screening against fluorescein-labeled proteins. In most batches, about 10–20% of the beads are bright enough to complicate “calling” a hit by simple observation under a microscope (vide infra) and would ideally be removed prior to the screen. However, the feasibility of doing so is highly dependent on the equipment available.
We have adapted a COPAS instrument (Union Biometrica) that was originally designed as a fluorescence-activated cell sorter (FACS) for large cells such as Drosophila embryos to perform as a bead sorter for handling combinatorial libraries.19 Like any preparative FACS machine, the instrument forces the particles to pass in a single file through a tube where they are irradiated by a laser. There is then a gate that either shunts the bead to a collection chamber if it exhibits a fluorescence intensity above a threshold set by the experimenter, or, if it does not, allows it to pass through. Since the flow rate of this instrument is approximately 10 beads per second, it is practical to pre-screen even relatively large bead libraries in a reasonable period of time. If funds are available and many screens are planned, we recommend obtaining a COPAS or equivalent instrument, since it can also be quite useful in the screening process itself (vide infra). However, this represents a significant investment, so we have also developed methods that provide at least a partial solution to the problem of background fluorescence (vide infra).
The same screening protocol is employed whether or not the library has been pre-screened. The beads (we generally employ ≈100![[thin space (1/6-em)]](https://www.rsc.org/images/entities/char_2009.gif) 000) are first blocked by incubation with a large excess of a cleared Escherichia coli lysate followed by washing with TBST buffer (see Methods). As will be reported in detail elsewhere (Reddy and Kodadek, in preparation) we have found the use of the diverse mixture of proteins present in an E. coli lysate to be a particularly effective source of non-specific competitor proteins, which has the effect of competing binding of relatively hydrophobic, “sticky” molecules in the library to the fluorescently-labeled protein. This is desirable, because while these sticky ligands can often exhibit good affinity, they are rarely specific18,20 and are to be avoided if possible. We have found that the use of serum albumin, or any other single unlabeled competitor protein, is not as good in this regard as using a complex mixture of different competitors. Lysate derived from bacterial, rather than eukaryotic, cells is used for two reasons. One is that large amounts of bacterial extract can be obtained more easily and cheaply than is the case for mammalian or even yeast lysates. Second, we generally target eukaryotic proteins and thus wish to avoid adding to the screening solution proteins that might interact specifically with the target.
000) are first blocked by incubation with a large excess of a cleared Escherichia coli lysate followed by washing with TBST buffer (see Methods). As will be reported in detail elsewhere (Reddy and Kodadek, in preparation) we have found the use of the diverse mixture of proteins present in an E. coli lysate to be a particularly effective source of non-specific competitor proteins, which has the effect of competing binding of relatively hydrophobic, “sticky” molecules in the library to the fluorescently-labeled protein. This is desirable, because while these sticky ligands can often exhibit good affinity, they are rarely specific18,20 and are to be avoided if possible. We have found that the use of serum albumin, or any other single unlabeled competitor protein, is not as good in this regard as using a complex mixture of different competitors. Lysate derived from bacterial, rather than eukaryotic, cells is used for two reasons. One is that large amounts of bacterial extract can be obtained more easily and cheaply than is the case for mammalian or even yeast lysates. Second, we generally target eukaryotic proteins and thus wish to avoid adding to the screening solution proteins that might interact specifically with the target.
The beads are then incubated with the labeled proteins (100–500 nM) in the presence of a 1000- to 10000-fold excess (based on mass) of the cleared bacterial lysate, again to compete non-specific interactions. In cases where the labeled protein is a fusion construct, for example of glutathione-S-transferase (GST) to the protein of interest, a 100-fold excess of unlabeled GST is also added to discourage the isolation of peptides or peptoids that bind this part of the fusion protein. We have employed different buffers in different screens depending on the desired stringency. In general, we would recommend that the experimenter employ the buffer in which he or she eventually wishes the ligand to function. A standard biochemical buffer such as TBST supplemented with the desired amount of salt is a good choice. Specific buffer conditions for some of the screens that we have carried out are provided in the Methods section. After a suitable incubation, the beads are washed thoroughly with the buffer lacking any proteins.
One must then identify the relatively rare hits in this large collection of beads. How this is done depends strongly on whether or not a COPAS or the equivalent is available. If so, the bead mixture is poured into the instrument, which is then programmed to collect beads of interest. Of course, if a COPAS is available then the library employed will have been pre-screened. In this step, the beads were gated on a time-of-flight (TOF) vs. extinction (EXT) dot-plot using the region as shown in Fig. 2A in order to obtain a relatively homogenous population with regard to bead size and low fluorescence. The sorting dot plot in Fig. 2B displays a rectangular region positioned around the beads that are isolated from the whole population during a prescreen corresponding to low auto-fluorescent bead population. The sort region was defined using green fluorescence intensity and TOF as the two parameters. A collection dish was used to collect the beads of interest. Typically 60–80% of beads were collected and used in the protein screen. When using the instrument to identify hits in the bead population, the gate is set differently, so as to collect beads with much higher fluorescence intensity than the mass of the bead population (Fig. 2C). Our particular instrument contains lasers and filters optimized for fluorescein, thus making this the label of choice for a semi-automated screen with a pre-screened library. The instrument is able to distinguish hits from background easily in this case. For example, Fig. 3B shows a fluorescence photomicrograph displaying the significant contrast between a bead scored as a hit and those scored as negatives in a screen of about 66000 chalcone-conjugated peptoids against a fluorescein-labeled, Mdm2-containing fusion protein.17
 | ||
| Fig. 2 Gating and sorting regions defined for sorting beads on COPAS Select 500. (A) Gating region defined for beads based on their time-of-flight to sort uniform sized beads. (B) Sorting region for prescreening beads in an attempt to remove intrinsically fluorescent beads. (C) Sorting region selected for selecting beads after incubation with fluorescently tagged protein. | ||
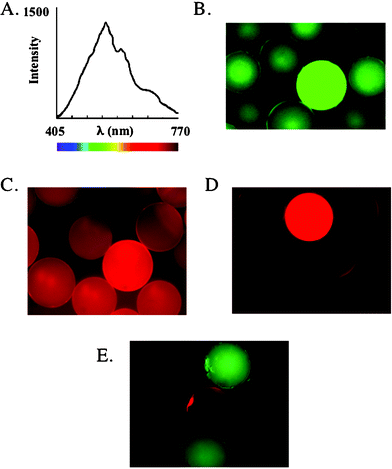 | ||
| Fig. 3 (A) Fluorescence emission spectra of TentaGel beads recorded on a hyperspectral microscope (excitation 330–380 nm). Reprinted with permission from ref. 12. Copyright (2003) Wiley-VCH Verlag GmbH & Co KG. Photomicrographs of (B) Sorted beads from an 500 nM MBP-Mdm2-Fluorescein semi-automated screen mixed with beads that did not show any binding. (C) 500 nM MBP-Mdm2-Texas red based manual screen that shows very low contrast between the “hit” and “non-hit” beads. (D) GST-CBP-Texas red screened against a 6 mer peptoid library yielded very good contrast and a very specific ligand for CBP. (E) Mixture of beads displaying a ubiquitin binding and a control peptide incubated with biotinylated ubiquitin and subsequently visualized with streptavidin-coated quantum dots. The beads displaying the ubiquitin binding peptide shows up as a red fluorescent bead whereas the control beads show a distinct green fluorescence. | ||
If a COPAS machine is not available, then the evaluation of the results must be done by eye under a fluorescence microscope. This is the one piece of instrumentation that is absolutely essential to screening against fluorescently-labeled proteins. Indeed, even if the COPAS instrument is used to sort the hits, it is highly recommended that these beads be checked visually against the negatives (as in Fig. 3B) to ensure that the machine has not picked a bead in error. In the absence of the COPAS, of course, the library employed will not have been pre-screened and care must be taken not to mistake an intrinsically fluorescent bead as a false positive. We have two protocols for such cases.
One is to simply employ Texas Red-labeled proteins as targets in the screen, since the intrinsic bead fluorescence is much weaker in the red (see Fig. 3A for the emission spectrum of the beads). Usually, one can distinguish true hits from background under a fluorescence microscope, though the level of contrast is such that one must look carefully. This makes visual evaluation of the results of a screen a tedious process in some cases. To illustrate this, Figs. 3C and 3D show photomicrographs of one the poorest and one of the best cases, respectively, of hit to background contrast that we have observed. The Fig. 3C micrograph shows a field of beads after exposure to Texas Red-labeled MBP-Mdm2 under the conditions described above. Upon sequencing, resynthesis and validation, the peptoid on this bead was shown to be a bona fide Mdm2 ligand with a KD of 37 µM.16 The micrograph shown in Fig. 3D is from a screen of peptoid hexamers against a GST fusion protein containing a fragment of the mammalian transcriptional coactivator CBP. This compound proved to be a highly specific 3 µM ligand for CBP and was subsequently shown to bind the protein in living cells.18 In cases like the CBP-binding peptoid, it is relatively straightforward to visually scan microscope fields for the brightest beads and then pick them using a micropipette. In less optimal cases such as the Mdm2 screen, the visual scan is far more tedious. This is tolerable if only a small number of proteins are to be screened against, but is not appropriate for higher throughput.
The other, more appealing, approach is to use red quantum dots in detection.12 Quantum dots are semi-conductor nanoparticles that have tight, intense emissions and, even more importantly, exhibit tremendous Stokes shifts. We used this to our advantage by purchasing streptavidin (SA)-coated quantum dots (Quantum Dot Corporation) and screening against a biotinylated protein. In this protocol, the beads are incubated with the biotinylated protein and washed. Then, the SA-conjugated quantum dots are added and, after another wash, the beads are examined under a fluorescent microscope. Using a band pass filter normally employed to illuminate DAPI dye (390–410 nm), beads that have failed to pick up significant biotinylated protein and, therefore, SA-conjugated quantum dots, fluoresce green. Those that have bound protein are intensely red due to the huge Stokes shift and high emission intensity of the quantum dot, providing for a simple two color assay that easily distinguishes hits from the background12 (Fig. 3E). The only drawback to this methodology was that the quantum dots were sticky and great care had to be taken to wash the beads thoroughly. Even then, some problems were encountered with non-specific binding to non-biotinylated competitor proteins picked up by beads in the screen. Since the time we did these experiments however, the formulation of the dots has been changed to include a PEG layer that drastically reduces this non-specific binding problem. We therefore intend to revisit this methodology and anticipate that quantum dot-based screening will become a facile detection method for libraries that have not been pre-screened. Optimized protocols will be reported in due course.
Identification of hits from library screens
Once beads are identified that represent hits by one of the methods described above, the structure of the molecule must be determined. While all of the protocols described above could be applied to screening almost any kind of bead-displayed library, characterization is highly specific for the type of library employed. We have focused on peptides and peptoids because these molecules can be identified by Edman degradation. In theory, one could also employ tandem mass spectrometry to identify the hits, but we have employed TentaGel beads that lack a cleavable linker and we therefore do not have a simple method to release the compounds from the beads for MS–MS analysis. Of course, this could be built into the library design if desired.Singe beads identified as hits either visually or by the COPAS instrument were washed thoroughly with hot 1% SDS buffer prior to sequencing. This was critical to the success of the sequencing experiment. In early work, we found that if the beads were simply washed with the buffer used for screening, the quality of the Edman sequences was usually very poor compared to that obtained from beads that had not been exposed to protein. This indicated that proteins bound to the beads were interfering with the sequencing reaction and thus suggested that a strong denaturing wash be employed to remove them prior to sequencing. After the denaturing wash, the bead is washed again with buffer and then placed in the sample chamber of a standard protein sequencer (in our case an Applied Biosystems, ABI 476A). For peptides, the sequencer was used according to the manufacturer's guidelines. However, for peptoids, the gradient is allowed to run a little longer to ensure that all monomers are eluted from the column. Of course, for peptoids, one must create a sample chromatogram prior to the screening experiment that allows one to assign a peak unequivocally to a particular Edman product. This is most easily done by sequencing the defined oligomers containing each building block used in the library. As mentioned above, we make these oligomers as a test for the chemical efficiency of each amine in the sub-monomer protocol anyway. This protocol provides, in most cases, an unequivocal assignment of the structure of the hit. For example, Fig. 4 shows the Edman trace obtained for one of the chalcone-capped peptoids that binds Mdm2 (Lys(chalcone)-Nlys-Npip-Nlys-Nser-Nlys-Nlys-Nlys-Nlys-Npip-Npip).17
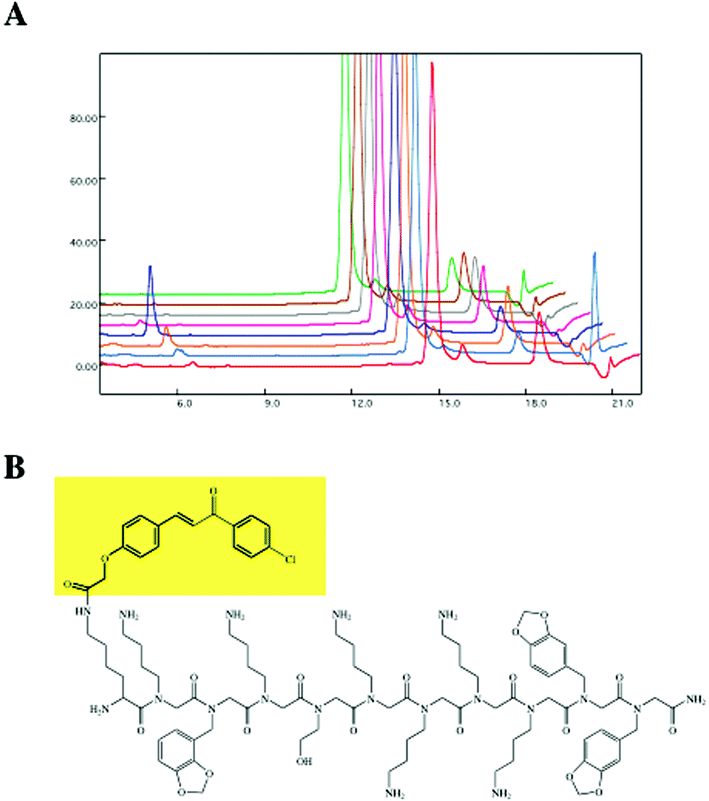 | ||
| Fig. 4 (A) Edman sequence chromatograph of the brightest bead identified from the MBP-Mdm2 screen shown in Fig. 3C. (B) The structure of the “hit” as deduced from the Edman trace. Reprinted from Reddy et al., Transformation of Low-Affinity Lead Compounds into High-Affinity Protein Capture Agents, Chem. Biol., 2004, 11, 1127–1137, Copyright (2004), with permission from Elsevier. | ||
Biochemical validation of hits from screening experiments
The final step of the entire procedure is to validate the hits as bona fide ligands. This requires some type of biochemical assay. The type employed will depend on the intended use of the ligand. For example, if the goal is to obtain a pharmacological reagent with which to modulate the activity of the target protein, then a critical issue is to make sure that the binding of the peptide or peptoid on the bead surface translates to solution. This is not always the case, particularly when the target protein is a homodimer or higher order multimer. In these cases, even weak peptide– or peptoid–protein interactions can support capture of the protein on beads through surface-mediated avidity effects.21 Simple false positives are also possible. Finally, it is also possible that promiscuous ligands that bind many different proteins can come through the screen (for example see ref. 18), though the conditions that we describe above, in particular the use of a 1000- to 10000-fold excess of E. coli proteins, minimize this problem.We generally employ one of three different types of biochemical assays to ask if hits from the screen are specific ligands for the protein of interest. Again, the preferred methodology depends on the equipment available as well as the solubility of the target protein and the hit. If the investigator has access to a fluorescence spectrometer capable of measuring polarization, then fluorescence anisotropy22 is a convenient method for monitoring peptide or peptoid binding to proteins. In this case, when the peptide or peptoid is resynthesized, an activated carboxyfluorescein is added to the N-terminus of the molecule on the resin or, in some cases, a lysine with carboxyfluorescein conjugated to the side chain nitrogen is employed as the N-terminal residue.18,23 The labeled peptide is then titrated with increasing amounts of the target protein or, as a control, other proteins to determine the KD and specificity of the interaction. Fig. 5 shows such an experiment where a peptoid identified as a putative CBP ligand was titrated with a GST fusion protein containing a fragment of CBP or, as controls, GST lacking a fused fragment and bovine serum albumin (BSA).18 These data showed that the peptoid was a bona fide and specific CBP ligand with a KD of about 5 µM. An advantage of the fluorescence anisotropy assay, in addition to its simplicity, is that it requires relatively modest amounts of protein (<100 µg for low micromolar interactions). However, if the hit is a relatively hydrophobic molecule, the fluorescein derivative is usually more so and can aggregate, making it difficult to measure binding affinity.
 | ||
| Fig. 5 (A) Fluorecence polarization experiment of peptoid identified as a putative CBP ligand titrated with a GST fusion protein containing a fragment of CBP, GST alone or BSA. This yielded a binding affinity of 5 µM for the peptoid and CBP. (B) Structure of the 6 mer peptoid identified in the screen against GST-CBP. Reprinted in part with permission from Liu et al., A potent transactivation domain mimic with activity in living cells, J. Am. Chem. Soc.,2005, 127, 8254–8255, Copyright (2005) American Chemical Society. | ||
An alternative is isothermal calorimetry,24,25 if one has access to a microcalorimeter. This technique measures the heat given off or taken up upon titration of one binding partner with an aliquot of the other. This is an outstanding technique for monitoring binding since, in addition to determining a binding constant, one can obtain information about the enthalpy and entropy of the interaction as well. Fig. 6 shows the results of an ITC experiment in which we validated binding of a chalcone-capped peptoid to MBP-Mdm2 and also showed that the synthetic molecule did not recognize the MBP part of the fusion protein. ITC does not require the addition of any exogenous labels to either the synthetic molecule or the protein. The downside of this technique is that it requires very large amounts of protein (milligram quantities) and demands that both binding partners are soluble at relatively high concentrations.
 | ||
| Fig. 6 Isothermal titration calorimetry data for the binding of chalcone-peptoid with MBP-Mdm2 and MBP. The equilibrium dissociation constants are highlighted below the titration profiles. Reprinted from Reddy et al., Transformation of Low-Affinity Lead Compounds into High-Affinity Protein Capture Agents, Chem. Biol., 2004, 11, 1127–1137, Copyright (2004), with permission from Elsevier. | ||
An economical alternative to fluorescence anisotropy and ITC is photo-triggered oxidative cross-linking,26 a technique that requires no specialized equipment whatsoever. In this case, the peptide or peptoid is resynthesized with a biotin tag somewhere in the molecule, usually at the N- or C-terminus. It is then titrated with the protein of interest or control proteins in the presence of ruthenium(II) tris-bipyridyl dication (Ru(bpy)32+) and ammonium persulfate (APS). When photolyzed with 450 nm light (a powerful flashlight will do26) in the presence of APS, Ru(bpy)32+ is photo-oxidized, providing a Ru(III) species capable of creating tyrosine and tryptophan radicals on the protein or peptide through one-electron oxidation followed by loss of a proton from the resultant arene radical cation.27 These reactive intermediates lead to efficient cross-linking of many complexes. We have shown that this cross-linking reaction occurs only between intimately bound molecules.27,28 Thus, the relative yield of the reaction, which is determined by gel electrophoresis and staining with labeled streptavidin, is a reflection of the degree of complex formation.29 This assay is somewhat more tedious than ITC and anisotropy for quantitative work since each point in the titration curve requires a lane on a gel. Therefore, we use this approach less frequently since we have the appropriate instruments to carry out anisotropy and ITC measurement routinely. However, the photo-crosslinking reaction can be quite effective as a tool for measuring binding constants and may be the method of choice for laboratories lacking access to ITC and fluorescence polarization instruments. Fig. 7 shows an example of the use of this technique to determine the stoichiometry and equilibrium dissociation constant of a complex between the yeast Gal80 transcriptional repressor and a 20 residue library-derived peptide23 that binds specifically to it.29
 | ||
| Fig. 7 KD of the G80BPA/Gal80 complex was measured by photo-activated cross-linking. Ru(II)(bpy)32+ was used to cross-link biotinylated G80BPA to increasing concentrations of Gal80. The crosslinked bands were quantified and used to measure the KD (±10%) of the complex. A streptavidin-probed blot is shown. Reprinted from Amini et al., Using oxidative crosslinking and proximity labeling to quantitatively characterize protein–protein and protein–peptide complexes, Chem. Biol., 2003, 10, 1115–1127, Copyright (2003), with permission from Elsevier. | ||
Methods and materials
General
All commercial reagents and chemicals were used as received. Combinatorial library synthesis was done on TentaGel macrobeads (TentaGel MB NH2; 140–170 µm diameter) procured from Rapp Polymere GmbH, Tubingen, Germany. There are approximately 520000 beads with a loading capacity of 0.4–0.6 mmol per gram. The identified hits from the primary screen were resynthesized on Rink Amide AM resin (200–400 mesh, 0.71 mmol g−1 capacity) purchased from Novabiochem. Semi-automated screening was done on COPAS Select 500 instrument (Union Biometrica, Harvard Bioscience Company) adapted by us for sorting beads. Fluorescence photomicrographs were recorded on a Nikon Eclipse TE300 fluorescence microscope fitted with a Chroma 61002 triple band pass filter set and a CCD camera. Sequencing of peptides as well as peptoids was done on ABI 476A protein sequencer manufactured by Applied Biosystems. Peptoids were sequenced using the FSTNML program and a standard gradient (Gradient 1). The FSTNML program was modified by adding a 60 s “wait” step at the end of the cycle to enable the gradient to run a little longer than normal. Analytical HPLC was performed on a Biocad Sprint system with a C18 reversed-phase HPLC column (Vydac, 5 µm, 4.6 mm id × 250 mm). A gradient elution of 10–50% B in 20 min followed by 50–80% B in 5 min was used at a flow rate of 1 ml min−1 (solvent A: H2O/0.1%TFA; B: CH3CN/0.1%TFA). MALDI-TOF MS was done on a Voyager-DE PRO workstation marketed by Applied Biosystems using alpha-cyano-4-hydroxycinnamic acid as the matrix. Isothermal titration measurements were made on a VP-ITC manufactured by MicroCal LLC.Combinatorial library synthesis
The general scheme for the synthesis of a combinatorial library on beads followed the “split and pool” method as described previously.16 Microwave-accelerated peptoid library synthesis30 was performed in a 1000 W Whirlpool microwave (model MT113SG) operated at 10% power. We understand the use of domestic microwave ovens is less desirable than carrying out reactions in a microwave-assisted workstation, but we do not have access to such an instrument and in any case have found the commercial microwave protocol to be quite reliable. Peptide libraries were synthesized on a Symphony solid-phase peptide synthesizer (Protein Technologies Inc) using Fmoc chemistry.Preparation of E. coli lysate for screening experiments
E.coli BL21-RIL cells were grown overnight at 37 °C in 1 L of Luria broth. The cells were harvested by centrifugation at 4000 rpm. The cell pellet was resuspended in sonication buffer (50 mM NaH2PO4, pH 8.0, 300 mM NaCl, 0.1% Tween20 + one complete protease inhibitor cocktail tablet from Roche Applied Science) pelleted again and finally resuspended in 10 mL of the same buffer. The cells were then lysed by sonication and the soluble and insoluble fractions separated by centrifugation at 22000 rpm to remove cell debris and yield the cleared cell lysate. The cleared lysate was dialyzed against 1× Tris buffered saline (TBST, 50 mM Tris, pH 7.4, 150 mM NaCl pH 7.4 + 0.1% Tween20) at 4 °C with at least 2 changes of buffer. The concentration of the lysate was estimated by Coomassie Plus Protein Assay Reagent (Pierce Biotechnology). BSA was used to plot the standard curve. Seven dilutions of BSA (ranging from 25 to 0 µg ml−1) were used for generating the standard curve as outlined in the Pierce instruction booklet.Protein purification
GST-CBP(387–817)18 protein was expressed and purified from the E.coli BL21-RIL strain. The cells were monitored for their growth at OD600 till 0.8 wherein they were induced with 1 mM IPTG. After further growth at 37 °C for 3 h, the cells were harvested at 4000 rpm, 10 mins, 4 °C. The cell pellet was resuspended in sonication buffer and lysed by sonication. The lysed cells were centrifuged at 22000 rpm to remove cell debris. The cleared lysate was then incubated with glutathione beads, thoroughly equilibrated with phosphate buffered saline (PBS, 10 mM phosphate buffer, 2.7 mM potassium chloride, and 150 mM sodium chloride, pH 7.4), at 4 °C for 1 h. The beads were washed with 10–12 volumes of PBS and packed into a column and further rinsed with PBS. GST bound to the beads was eluted with 10 mM reduced glutathione in PBS and fractions collected and analyzed on a 12% SDS-PAGE. The pure fractions were pooled and dialyzed against PBS + 10% glycerol. The protein concentrations were estimated as described above. MBP-mdm2 was overexpressed from pMAL-mdm2 in BL21-RIL cells. Herein, the conditions were slightly modified; cells were grown in the presence of 0.2% glucose and induced at OD600nm = 0.5 with 0.3 mM IPTG and grown for a further 3 h. 20 mM Tris-HCl + 200 mM NaCl + 1 mM EDTA, pH 7.4 (column buffer) was used as the buffer. The protein was bound to amylose resin and after thorough washing, eluted with 10 mM Maltose made in the column buffer.Conjugating dye to protein
The protein solution (preferably 2 mg ml−1 in a suitable buffer) was adjusted to pH 8.3 with 0.2 M NaHCO3 pH 8.3 in a total volume of 200 µl. To this added 5 µl of 50 mg ml−1 Texas Red solution in DMF. This was then incubated for 1 h at room temperature with tumbling, after which the reaction was stopped with 100 µl freshly prepared 1.5 M Hydroxylamine. Subsequently, the dye conjugated protein was separated from the free dye using a prepacked disposable Sephadex G-25 column (NAP-5™ column), sold by Amersham Biosciences. The degree of labeling (DOL) was estimated using the following formula:where Amax = Absorbance of the protein dye conjugate at λmax for the dye (494 and 595 nm for Fluorescein and Texas red, respectively), MW = MW of protein, εdye = extinction coefficient of the dye at its absorbance maximum (68
 000 and 80000 for Fluorescein and Texas red, respectively) and protein concentration in mg ml−1; detailed in Invitrogen product specification handbook.
General screening methodology
For each screen approximately 200 mg of the combinatorial library on beads were used. The weighed out beads were first soaked in DMF for 2 h at room temperature, then rinsed with 1× TBST and soaked overnight in the same buffer at 4 °C. Subsequently, the beads were blocked with 1000-fold excess of E.coli lysate, for 2 h at 4 °C with tumbling. The beads were then washed thrice with 1× TBST and incubated with 500 nM target protein in the presence of a 1000-fold excess of E.coli lysate for 2 h at room temperature with tumbling. Buffer in the protein incubation cocktail for MBP-Mdm2 screen contained an additional 1 M NaCl and 1% Tween 20. For the GST fusion protein screens, a 50- to 100-fold excess of unlabeled GST is also added to discourage binding of library-derived molecules to GST. The beads were thoroughly washed with 1× TBST and visualized under a fluorescence microscope fitted with an appropriate filter. The brightest beads were identified and isolated manually with a pipet tip.Semi-automated screening in our laboratory has used the COPAS Select 500 instrument sold by Union Biometrica. The initial bead processing and blocking steps are as highlighted above. The ease of scanning beads with the COPAS has allowed library presorting to remove auto-fluorescent beads. The library beads were put into the general purpose sheath buffer compatible with the instrument and gently pushed through an 18 gauge needle to dissociate any clumps that may have formed during incubation. All the beads were poured into the sample cup at a density of about 50 beads per ml. Data acquisition was initiated for 100 beads. Depending on the distribution of the beads, regions for gating and sorting were defined as detailed in the Results section. Subsequently, beads were sorted to yield similar sized and low background fluorescence beads. The presorted beads in the collection tray were then incubated with 500 nM protein in the presence of 1000 fold excess of E.coli lysate. For the purpose of screening for hits, sorting region was defined again as discussed previously and depicted in Fig. 2. Sorting for hits, at this stage was done in a Petri dish, all the sorted beads were then analyzed under fluorescence microscope and the brightly fluorescent ones were manually isolated with the help of a pipet tip.
For screens with native protein, the same procedure is employed with the addition of primary and secondary antibody incubations before the presorting step (if semi-automated screening is done) and after the native protein incubation step. We are in the process of optimizing this.
Each isolated “hit” bead was suspended in 1% SDS solution and heated to 95 °C for 5 mins. This done, the bead was loaded into the sequencing machine and sequencing was performed on the bead as described.16
Acknowledgements
The experiments described in the article were supported by the National Institutes of Health through grants RO1 GM58175 and P01-DK58398, a contract (NO1-HV-28185) from the National Heart, Lung and Blood Institute (NHLBI) to establish the UT-Southwestern Center for Proteomics Research and a grant from the Welch Foundation (I-1299).References
- S. L. Schreiber, Chem. Eng. News, 2003, 81, 51–61.
- T. Kodadek, Chem. Biol., 2001, 8, 105–115 CrossRef CAS.
- T. Kodadek, Trends Biochem. Sci., 2002, 27, 295–300 CrossRef CAS.
- T. Kodadek, M. M. Reddy, H. J. Olivos, K. Bachhawat-Sikder and P. G. Alluri, Acc. Chem. Res., 2004, 37, 711–718 CrossRef CAS.
- H. E. Blackwell, L. Perez, R. A. Stavenger, J. A. Tallarico, E. C. AEatough, M. A. Foley and S. L. Schreiber, Chem. Biol., 2001, 8, 1167–1182 CrossRef CAS.
- P. A. Clemons, A. N. Koehler, B. K. Wagner, T. G. Sprinings, D. R. Spring, R. W. King, S. L. Schreiber and M. A. Foley, Chem. Biol., 2001, 8, 1183–1195 CrossRef CAS.
- C. M. Crews and U. Splittgerber, Trends Biochem. Sci., 1999, 24, 317–320 CrossRef CAS.
- L. Burdine and T. Kodadek, Chem. Biol., 2004, 11, 593–597 CrossRef CAS.
- W. Zhu, R. S. Williams and T. Kodadek, J. Biol. Chem., 2000, 275, 32098–32105 CrossRef CAS.
- R. J. Simon, R. S. Kania, R. N. Zuckermann, V. D. Huebner, D. A. Jewell, S. Banville, S. Ng, L. Wang, S. Rosenberg, C. K. Marlowe, D. C. Spellmeyer, R. Tan, A. D. Frankel, D. V. Santi, F. E. Cohen and P. A. Bartlett, Proc. Natl. Acad. Sci. U. S. A., 1992, 89, 9367–9371 CAS.
- J. A. Kritzer, N. W. Luedtke, E. A. Harker and A. Schepartz, J. Am. Chem. Soc., 2003, 127, 14584–14585.
- H. J. Olivos, K. Bachhawat-Sikder and T. Kodadek, ChemBioChem, 2003, 4, 1242–1245 CrossRef CAS.
- Z. Wu, G. Belanger, B. B. Brennan, J. K. Lum, A. R. Minter, S. P. Rowe, A. Plachetka, C. Y. Majmudar and A. K. Mapp, J. Am. Chem. Soc., 2003, 125, 12390–12391 CrossRef.
- R. N. Zuckermann, J. M. Kerr, S. B. H. Kent and W. H. Moos, J. Am. Chem. Soc., 1992, 114, 10646–10647 CrossRef CAS.
- G. M. Figliozzi, R. Goldsmith, S. C. Ng, S. C. Banville and R. N. Zuckermann, Methods Enzymol., 1996, 267, 437–447 CAS.
- P. G. Alluri, M. M. Reddy, K. Bachhawat-Sikder, H. J. Olivos and T. Kodadek, J. Am. Chem. Soc., 2003, 125, 13995–14004 CrossRef CAS.
- M. M. Reddy, K. Bachhawat-Sikder and T. Kodadek, Chem. Biol., 2004, 11, 1127–1137 CrossRef CAS.
- B. Liu, P. G. Alluri, P. Yu and T. Kodadek, J. Am. Chem. Soc., 2005, 127, 8254–8255 CrossRef CAS.
- M. Meldal, Biopolymers, 2002, 66, 93–100 CrossRef CAS.
- S. L. MacGovern, E. Caselli, N. Grigorieff and B. K. Shoichet, J. Med. Chem., 2002, 45, 1712–1722 CrossRef CAS.
- J. L. Naffin, Y. Han, H. J. Olivos, M. M. Reddy, T. Sun and T. Kodadek, Chem. Biol., 2003, 10, 251–259 CrossRef CAS.
- T. Heyduk, Y. Ma, H. Tang and R. H. Ebright, Methods Enzymol., 1996, 274, 492–503 CAS.
- Y. Han and T. Kodadek, J. Biol. Chem., 2000, 275, 14979–14984 CrossRef CAS.
- J. E. Ladbury and B. Z. Chowdhry, Chem. Biol., 1996, 3, 791–801 CrossRef CAS.
- S. Leavitt and E. Freire, Curr. Opin. Struct. Biol., 2001, 11, 560–566 CrossRef CAS.
- D. A. Fancy and T. Kodadek, Proc. Natl. Acad. Sci. U. S. A., 1999, 96, 6020–6024 CrossRef CAS.
- D. A. Fancy, C. Denison, K. Kim, Y. Xie, T. Holdeman, F. Amini and T. Kodadek, Chem. Biol., 2000, 7, 697–708 CrossRef CAS.
- C. Denison and T. Kodadek, J. Proteome Res., 2004, 3, 417–425 CrossRef CAS.
- F. Amini, C. Denison, H.-J. Lin, L. Sun and T. Kodadek, Chem. Biol., 2003, 10, 1115–1127 CrossRef CAS.
- H. J. Olivos, P. G. Alluri, M. M. Reddy, D. Saloney and T. Kodadek, Org. Lett., 2002, 4, 4057–4059 CrossRef CAS.
| This journal is © The Royal Society of Chemistry 2006 |