Development of a respirometric biochip for embryo assessment
Ciara
O'Donovan
a,
Eoin
Twomey
b,
John
Alderman
b,
Tom
Moore
a and
Dmitri
Papkovsky
*a
aBiochemistry Department, Analytical and Biological Chemistry Research Facility, Cavanagh Pharmacy Building, Universlty College Cork, Cork, Ireland. E-mail: d.papkovsky@ucc.ie
bTyndall National Institute, Lee Maltings, Prospect Row, Cork, Ireland
First published on 6th September 2006
Abstract
A prototype respirometric biochip dedicated to monitoring oxygen consumption of preimplantation embryos has been developed. The biochip comprises a linear array of eight flow-through microchambers profiled on silicon substrate, and functions together with a phosphorescent oxygen sensitive probe and fluorescence plate reader detection. A high level of sensitivity to changes in dissolved oxygen was achieved through miniaturisation and optimization of biochip geometry, and incorporation of appropriate sealing and humidification systems. The biochips have allowed characterisation of oxygen consumption, by 2 cell and blastocyst stage preimplantation mouse embryos, through monitoring as few as ten preimplantation embryos over a one-hour time period. They provide a non-invasive, simple and convenient means for assessing preimplantation embryo metabolism.
Introduction
Preimplantation mammalian embryos are routinely cultured in vitro for a variety of research, commercial and medical applications. Their characterisation has been the focus of active research, with improved understanding of preimplantation embryo physiology having wide ranging implications, not least in improving in vitro culture systems and allowing better selection of embryos for clinical assisted reproduction. The current criteria for embryo selection are based largely on cell number, morphological appearance and timing of embryo cleavage.1–3 However these criteria are relatively poor predictors of implantation and their subjective nature makes standardisation problematic.In an effort to develop reliable, cost-effective and efficient tests of embryo physiology, alternative approaches for characterising preimplantation embryos are being investigated. These include analysis of biochemical markers such as embryonic HLA-G4 and embryo produced platelet activating factor,5 as well as analysis of metabolic markers.6 There are significant data characterising the metabolism of preimplantation mammalian embryos in terms of carbohydrate, lipid and amino acid metabolism.6–8 Such non-invasive metabolic profiling can provide information on the ability of embryos to develop in culture.
The usefulness of oxygen consumption as a marker of metabolism is well known, and a number of approaches have been employed to measure oxygen consumption by preimplantation embryos.9–12 Early efforts involved the use of a manometric Cartesian diver. This system proved useful in characterising trends in mouse embryo oxygen consumption throughout the preimplantation period; however, the requirement for 15–100 embryos for measurement and the difficulty in performing measurements has limited its use.9 Polarographic systems using Clark-type oxygen electrodes are more sensitive, however they consume oxygen and their requirement for physical contact between the sample and electrode can cause problems with sterility.10 A scheme based on oxyhaemoglobin, which relies on binding chemistry and absorbance measurements has also been employed; however, this scheme is complex and also difficult to miniaturise.11,13,14 Fluorescence-based oxygen sensing provides direct, non-chemical, contact-less and rather simple optical means for monitoring biological oxygen consumption.15 This approach being non-invasive circumvents problems of sterility and allows a great deal of versatility in terms of assay platform and miniaturization; however, measurement formats described to date suffer a number of limitations with regard to monitoring oxygen consumption by preimplantation embryos.
Thus, a fluorescence oxygen sensing scheme based on pyrene dye uses a capillary set-up containing two liquid phases: pyrene dissolved in oil acting as the oxygen sensor which is interfaced with an aqueous sample containing groups of embryos.12,16 This scheme provides moderate sensitivity (samples containing groups of 10–30 embryos are measured over 4–6 hours), but requires complicated modelling of oxygen diffusion between aqueous and oil phases, in addition its sealed nature limits development towards embryo culture, and treatment and there are issues concerning the toxicity of pyrene which may leach into the sample. More recently schemes employing water-soluble oxygen probes based on long-decay phosphorescent metalloporphyrins and microtitre plate formats have been described and successfully applied to monitoring oxygen consumption of a number of cell types and small organisms.17–21 However, the formats and the level of sensitivity of these schemes are inadequate for the monitoring of oxygen consumption by small groups of preimplantation embryos.
Single preimplantation embryos consume oxygen in the nanolitre per hour range,9–12 thus a high level of sensitivity to oxygen consumption is essential for such monitoring. Other requirements include non-invasive measurements, short assay times and compatibility with standard and readily available instrumentation. The ability to manipulate embryos and monitor multiple samples in parallel provides further advantages. With these goals in mind, we have developed a prototype respirometric biochip for monitoring oxygen consumption of preimplantation embryos, described in this paper. The biochip has been designed to allow further integration of a flow through system thus providing a platform for embryo culture and treatment, in addition to functioning as a measurement platform for biochemical characterisation of embryos via oxidative metabolism.
Experimental
Biochip fabrication
Silicon/SU-8 biochips were fabricated using micro-machining techniques on standard 4 inch silicon wafers. The surface of the wafers was profiled to produce the designs outlined in Fig. 1 using conventional photolithography tools (EV420 electronic vision aligner) and SU8-based polymerisation chemistry and processes.22 Briefly this comprises: surface pre-treatment to enhance adhesion, spinning the required thickness of photopolymer, exposing the alternative designs, developing and curing to remove unwanted material and to fully cross-link the polymer, followed by separating with standard diamond tipped sawing and cleaning. The devices were then sealed using a glass coverslip and UV-glue (Loctite 302). The UV-glue was deposited onto the SU-8 portion of the biochip, and a glass coverslip was placed on top. The biochip was then exposed to UV light, 40 mW cm−3 for 30 seconds to cure the glue. The cured glue bonds the coverslip to the SU-8 giving a sealed microchamber array biochip. | ||
| Fig. 1 Schematic representation of biochips where A: loading area, B: entry channel, C: measuring area, D: capture device, E: exit channel. | ||
Etched silicon biochips were fabricated using micro-machining techniques on standard 4 inch silicon wafers. A photoresist is applied onto the silicon wafers and the acetate design mask is exposed to the photoresist. The exposed areas of the positive photoresist are removed in a dedicated developer solution, the remaining photoresist now acts as a dry etch mask. The silicon wafers are loaded into a STS REI dry etching system for etching and the remaining photoresist is removed from the silicon wafer, which is then cleaned. A Pyrex lid (sodium ion containing for anodic bonding applications) is anodically bonded onto the silicon-etched wafers. Finally the fabricated biochips are released by dicing along designed dicing lines incorporated in the starting design.
Both the silicon/SU-8 and the etched silicon biochips comprise a linear array of eight flow-through microchamber units and were fabricated with the location of the measuring chambers corresponding to the footprint of a 96-well plate (i.e. 9 mm pitch between adjacent measuring chambers). The devices can therefore be easily aligned on a dedicated base/holder (gridded metal plate, L = 128 mm, W = 86 mm, H = 6 mm) for measurement on standard microplate readers with epi-fluorescence optics. The depth of the biochip structures was set at 160 µm to allow loading of the embryos which range in size up to ∼100 µm. Dimensions of other parts of the biochip and its general design are described in detail in the results section and illustrated in Fig. 1.
Preimplantation mouse embryo culture
B6CBF1, female mice, 3–4 weeks old, underwent superovulation treatment by intraperitoneal injection of 5 IU of pregnant mare's serum gonadotrophin (PMSG, Sigma) followed 48 hours later by administration of 5 IU of human chorionic gonadotrophin (hCG, Sigma). Following hCG, females were mated with males of the same strain overnight. Zygotes were collected 24 hours post hCG administration in M2 medium (Sigma). Culumus masses were dispersed by brief incubation with 300 µg ml−1 hyaluronidase from bovine testes (Sigma). Zygotes were cultured to the blastocyst stage (usually for five days), in 50 µl droplets of M16 medium (Sigma) under mineral oil (Sigma) at 37 °C in a humidified atmosphere of 5% CO2 in air. All expertiments involving laboratory animals were performed in compliance with the Cruelty to Animals Act 1876 as amended by the European Communities Regulations 2002, with the approval by Animal Experimentation Ethics Committee and under the guidelines of Good Research Practice of University College Cork.Optimisation of biochip measuring chamber
Measuring chamber size was optimised to give the smallest measuring chamber that provided a sufficient level of probe signal for measurements to be carried out. Oxygen sensitive probe, A65N-1 (Luxcel Biosciences), was dissolved to a concentration of 1.25 µM in phosphate buffer saline, pH 7.4 (PBS). The probe solution was loaded into the Si/SU8 biochips with different measuring area diameters (see Fig. 1, designs 1a–c) by simple pipetting. Control biochips were loaded with PBS alone. The biochips were then aligned on the base with dimensions matching that of a standard microtitre plate and the footprint of a 96-well plate outlined on it. The footprint outline allows alignment of the biochip in the plate reader in the X–Y plane, while the height of the plate ensures it's alignment in the Z plane. Fluorescence intensity measurements were performed using a SpectraMax Gemini plate reader (Molecular Devices), with excitation and emission set at 380 nm and 650 nm respectively (optimal for the probe) and an emission cut-off set at 630 nm. Signal to blank ratios were determined from average fluorescence readings with and without the probe.Optimisation of channel dimensions was carried out with respect to the flow of aqueous liquid through the sealed Si/SU8 biochips. PBS was repeatedly loaded into the micro-chamber devices and the flow of liquid was graded according to Table 1.
| Entry of liquid into a given area | Score |
|---|---|
| No entry | 1 |
| Entry but no exit | 2 |
| Entry and stalled exit | 3 |
| Entry and exit | 4 |
| Flow of liquid through a given area | Score |
|---|---|
| No flow | 1 |
| Insufficient flow | 2 |
| Sufficient flow but of an undesirable rate | 3 |
| Sufficient flow of a desirable rate | 4 |
Monitoring of oxygen consumption
Examination of biochip sensitivity and performance was done by measuring enzymatic oxygen consumption. Glucose oxidase (Sigma) was diluted to the desired concentrations in sodium acetate buffer pH 5.5 containing 100 mM β-D-glucose (Sigma), and 1.25 µM A65N oxygen probe, control samples comprised the above reaction mixture without glucose oxidase. Approximately 10 µl of the reaction mixture was loaded into the biochips by simple pipetting, the biochips are then set into a custom designed humidification unit, to prevent evaporation of sample. The humidification unit comprises the perviously described metal plate base, 4 × 200 µl wells adhered to the base and a standard omniplate lid (L = 125 mm, W = 82 mm, D = 6 mm). For monitoring, the biochip is aligned on the base for 96-well plate reader detection, the wells are filled with water and the lid is placed on top and sealed with parafilm. This set-up creates a 61.5 cm3 sealed area around the biochip which becomes humidified. The lid can easily be removed by breaking the parafilm seal allowing recovery of the biochip after monitoring. Analysis of oxygen consumption was carried out using the above instrument and settings, with microplate compartment temperature set at 35 °C. Oxygen probe fluorescence in each microchamber was monitored over one hour at 90 second intervals, time profiles of fluorescence intensity units (IU) thus obtained were processed to determine the rate of signal increase, which reflects the rate of oxygen consumption.23For preimplantation embryo oxygen consumption measurements, ∼10 µL of M16 media (Sigma) containing 1.25 µM oxygen probe was added to the loading area of the biochips. Groups of 5, 10 and 20 embryos were added to this solution by pipetting using extruded Pasteur pipettes, the sample was carried to the measuring area by capillary action. Control samples comprised M16 maedia (Sigma) containing 1.25 µM oxygen probe but no embryos. The devices were then set into the humidification unit as outlined above and analysis of oxygen consumption was carried out for one hour at 37 °C as described above. Fluorescence signal increase was converted to decrease in disolved oxygen with test and control samples being repeated 5 times per sample group.23 For comparison of embryo samples these values were expressed as a percentage of the highest respiration rate i.e. that of 20 blastocyst stage embryos.
The Welch modified 2 sample test was used to compare the (a) UV glue and anodicially bonded sealing systems and (b) the 2 cell and blastocyst stage embryos. The Bonferroni correction was used to determine significance, which was found to be 0.0125 and 0.0167 for the sealing system and the embryo comparison, respectively.
Results and discussion
General design of the respirometric biochip
The respirometric biochip was designed to facilitate an assay cycle that involves loading of samples with embryos into the biochip, monitoring signal from a soluble phosphorescent oxygen-sensitive probe and recovery of the embryos subsequent to measurement. Monitoring is usually done at physiological temperature (37 °C) over a period of time sufficient to determine oxygen consumption rates (typically in less than 1 hour). General features of the biochip design that facilitate these requirements are outlined in Fig. 1a. The devices, when covered, allow loading of embryos onto the loading area (A), where they are carried by capillary action through the entry channel (B) and into the measuring area (C). The embryo capture device (D), prevents the embryo escaping the measuring area through exit channel (E) while allowing flow of liquid through the system. Back flushing of the system allows recovery of the embryo subsequent to monitoring. The biochips were produced as a linear array of 8 microchambers consistent with a 96-well plate footprint. The array allows parallel analysis of 8 samples with standard fluorescence plate reader instrumentation. The measuring area comprises a sealed compartment separated from ambient oxygen by narrow channels filled with liquid sample. This arrangement minimises back diffusion of ambient oxygen into the sample, and allows the development of oxygen gradients associated with embryo respiration. During the assay dissolved oxygen concentration decreases from air-saturated at the start of the experiment (∼200 µM, depending on measurement temperature). The decrease in dissolved oxygen concentration is monitored by measuring the oxygen probe's fluorescent signal, which increases over time due to reduced quenching by oxygen.To achieve the high level of sensitivity necessary for monitoring low levels of oxygen consumption of single preimplantation embryos, a miniaturisation approach was adopted. The level of miniaturisation is restricted by embryo size (channel depth) and by the measurement instrumentation (size of measuring area). The materials used for the biochip design optimisation (a silicon base with SU-8 polymer) were chosen for their biocompatibility and rapid prototyping capabilities.24 However, due to the relatively high gas permeability and also the fluorescent background of SU8 polymer, structures based on etched silicon with anodically bonded glass covers were subsequently employed.
Optimisation of biochip dimensions
As preimplantation mouse embryos typically reach 100 µm in diameter, a depth restriction of ∼160 µm was placed on the biochip. Thus optimisation was achieved by altering the diameter of the measurement area. Decreasing the biochip volume, through reducing the measurement area diameter offers increased sensitivity to oxygen consumption. However, this also gives rise to a reduction in signal to blank ratio, due to increased background signal, originating from the non-focused lamp-based excitation. Biochips with measurement area diameters of 8 mm, 5 mm and 3 mm giving sample volumes of 10 µl, 6 µl and 4 µl respectively were assessed (Fig. 1, designs 1a–c). Reducing the biochip volume from 10 µl to 6 µl causes a ∼5-fold increase in background signal, representing a decrease in signal to blank ratio from 100 to 14, further reducing the biochip volume to 1 µl caused a further 18-fold increase in non-specific signal, causing the signal to blank ratio to drop to 1.3. The 6 µl volume biochip was chosen for further development as it provided the optimal level of miniaturisation that maintained a sufficient signal to blank ratio for measurements to be reliably carried out.Effects of measuring area shape were also assessed by comparison of designs 2a–c and 3 (Fig. 1). Design 3, which incorporates a smoothening of the measuring area shape proved superior to the more angular design outlined in design 2 as it prevented the occurrence of air bubbles in the biochip on loading of liquid sample. The biochip entry channel dimensions were also optimised to ensure reliable self-loading of aqueous samples. This sample loading was graded according to a number of criteria outlined in Table 1, such that the highest scoring design is considered optimal. Briefly the flow was graded according to (a) the entry and exit of liquid into a given area, (b) the flow of liquid through a given area and (c) the presence of air bubbles in the biochip on loading of liquid. The biochip was divided into three areas for this assessment, namely; the entry and exit channels and the measuring area. Scores for biochips with entry channel lengths ranging from 1000 µm to 4000 µm and widths ranging from 100 µm to 600 µm were assessed. The biochip design with an entry channel width of 400 µm and length of 2000 µm gave the highest score and was chosen as optimal. The overall demensions of this design are outlined in Fig. 1 design 3 and include loading area, entry channel and exit channel lengths of 7000 µm, 2000 µm and 4000 µm, respectively, and widths of 3000 µm, 400 µm and 600 µm, respectively, and a measuring area diameter of 5000 µm. These dimensions provide consistent gentle flow of samples through the system driven by capillary action.
In addition to optimising biochip dimensions, an embryo capture structure was examined. This structure, located in the measuring area, consists of a number of pillars set 50 µm apart to prevent embryos escaping the measuring chamber, while allowing liquid to flow through. A number of different embryo capture structures were examined to identify one that allowed liquid to flow through the system unperturbed. Design 3 outlined in Fig. 1 proved most effective. Others such as those outlined in designs 1b, 2a and 2b, while capable of maintaining the embryos in the measuring chamber, also perturbed the flow of liquid through the system.
Assessment of biochip seal and performance
While assay platform miniaturisation plays an important role in establishing sensitivity to changes in oxygen, sealing the devices to prevent back diffusion of ambient oxygen into the measurement area is also critical.Previous work involving a similar platform for monitoring oxygen consumption by mammalian cells (low-volume sealable microplates),24 utilised glass coverslips held in place for the duration of the measurements, with excess of samples being loaded onto the devices prior to sealing. This approach however is not suitable for the biochips as embryos can escape from the measurement chambers during sealing. For reliable loading of samples into the biochip through capillary action, a permanent seal is necessary.
The initial approach involved bonding a glass coverslip to the silicon/Su8 biochips by depositing UV-glue onto the SU-8 portion of the biochip, covering the biochip with a glass coverslip and treating with UV light to cure the glue. The cured glue adheres the coverslip to the SU-8 giving a sealed biochip. The second approach involves anodic bonding of Pyrex glass to the biochips made from etched silicon, where the glass becomes bonded to the silicon with a permanent chemical bond.
To evaluate these factors and perform biochip optimisation, a glucose/glucose oxidase enzymatic system was used, this system allows production of well-defined and easily controlled rates of oxygen consumption proportional to enzyme concentration.25 The assay, carried out at optimal enzyme conditions (pH 5.5 and 35 °C), enables simple assessment of biochip performance in respirometric experiments and selection of a seal that gives optimal sensitivity to low levels of oxygen consumption. Enzyme concentrations that produce oxygen consumption rates in the nanolitre per hour range, which correspond to those of small groups of preimplantation mouse embryos were used.9–12
In addition, measurement of small samples, especially for prolonged periods of time and at elevated temperatures, can be critically affected by sample evaporation. To minimise this, a humidification accessory unit (outlined in the experimental section) was employed which effectively prevented evaporation of samples from the biochip during measurements.
Fig. 2 shows an oxygen consumption profile obtained with this biochip and enzymatic system. It illustrates the increase in probe phosphorescence over time as oxygen depletes within the system. Fig. 3 shows a comparison between the two sealing systems based on enzymatic consumption of oxygen, presented as the rate of change of probe phosphorescence. One can see that the biochip with anodicially bonded seal provides superior sensitivity to oxygen consumption; while not significantly different at the lower glucose oxidase concentrations, the assay displayed significant differences where the glucose oxidase concentration was 0.1 µg ml−1 (p = 0.004) and non-significant but notable differences where the glucose oxidase concentration was 0.033 µg ml−1 (p = 0.021). In addition, the anodicially bonded seal provides a higher level of reproducibility. As the enzyme activity has been characterised, this change in phosphorescence intensity over time (i.e. initial slope) can be used to determine the sensitivity of the system, i.e. lowest detectable levels of oxygen consumption. The system was found to be sensitive to oxygen consumption in the nL h−1 range, which is sufficient for the experiments with embryos. These biochips were employed to monitor embryo respiration.
 | ||
| Fig. 2 Change in probe intensity from consumption of oxygen by glucose oxidase at 3.3 × 10⁻⁵ mg ml−1 (open circles) and control (solid circles), probe concentration was 0.6 µM, pH was 5.5 and temperature was 35 °C. | ||
 | ||
| Fig. 3 Comparison of sensitivity to oxygen consumption between UV-glue bonded glass cover slip seal (solid circles) and anodicially bonded Pyrex glass seal (open circles). | ||
Monitoring of preimplantation mouse embryos
Initially 20 blastocyst stage embryos were monitored to determine the applicability of the system to monitoring preimplantation mouse embryos. A respiration profile of such a sample is given in Fig. 4. It shows large and easily measurable changes in dissolved oxygen concentration over time, due to embryo respiration.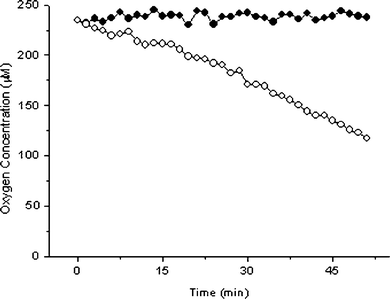 | ||
| Fig. 4 Changes in dissolved oxygen with aerobic respiration by 20 blastocyst stage embryos (open circles) and control (solid circles). Probe concentration 0.6 µM, temperature 37 °C. | ||
Having established the ability of the respirometric assay system to monitor relatively large numbers of blastocyst stage embryos, monitoring of smaller groups of embryos at different stages of their development was attempted. The ability of the system to distinguish between oxygen consumption of the 2 cell and the blastocyst stage embryos was investigated. Mouse embryos at the 2 cell and the blastocyst stage of development are known to display markedly different metabolic profiles. Cleavage stage embryos including the 2 cell stage typically consume oxygen at a rate two to four times lower than blastocyst stage embryos.9–12 The dramatic increase in oxygen consumption seen at the blastocyst stage has been attributed to the higher energy needs of the blastocyst. Fig. 5 outlines relative respiration rates for groups of 5, 10 and 20 preimplantation embryos at the 2 cell stage and at the blastocyst stage of development. The differences in respiration between 2 cell and blastocyst stage embryos was not found to be significant for groups of 5 embryos but was significant for groups of 10 and 20 embryos (p = 0.0101 and 0.0003, respectively).
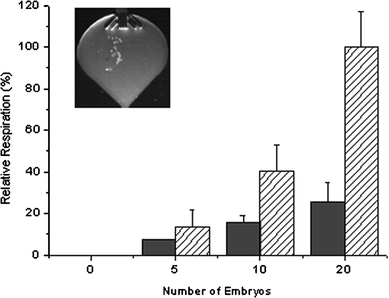 | ||
| Fig. 5 Comparison of oxygen consumption rates between 2 cell (solid bars) and blastocyst stage (hatched bars) preimplantation mouse embryos, with insert showing 20 blastocyst stage embryos in the measuring area of the optimised biochip. | ||
These data indicate that using the new respirometric biochips, oxygen consumption can be reliably detected for as few as ten 2 cell stage embryos and that the methodology can monitor differences in oxygen consumption between cleavage and blastocyst stage embryos. Fig. 5 conveys approximately three-fold increase in respiration rates between 2 cell and blastocyst stage embryos, a factor which is consistent with published data. The results presented here were realised with a relatively simple assay set-up and plate reader detection. This compares favourably with systems previously employed for monitoring oxygen consumption of embryos, such as the pyrene based system and the micro-electrode based system outlined earlier. The pyrene based system employs a more complicated assay set-up, is less sensitive (requiring groups of 10–30 embryos), and requires longer assay times (typically 4–6 hours). The microelectrode-based technique, although capable of monitoring single embryos, is rather complex, does not allow parallel analysis of samples, and suffers with regard to sterility and standardisation of the measurement.
We anticipate that future development of this biochip system will further improve its performance and sensitivity, to allow single embryo monitoring. This reduction in measuring area diameter and thus biochip volume may be feasible, when using a reader with more focused and/or adjustable excitation source. The biochip design also facilitates development of a fully integrated flow through system for sample loading and recovery. Such an addition can eliminate the need for a humidification chamber, improve performance and expand the versatility of the system. It can also allow non-invasive assessment of different culture media compositions and treatment of embryos with various agents, without unnecessary handling of embryos. Furthermore, this biochip can be integrated with other sensing technologies (e.g. pH and other metabolites) to provide a platform for both culture and treatment of embryos, and/or their multi-parametric assessment. Indeed, recent data suggest that embryonic development can be enhanced via microchannel culture.26
Conclusions
A dedicated respirometric biochip has been developed for monitoring oxygen consumption by preimplantation embryos. The biochip functions in conjunction with a phosphorescent oxygen sensitive probe and standard fluorescence plate reader detection providing a simple, convenient and non-invasive means of assessing preimplantation embryo metabolism. The biochip design features have been optimised for loading of embryos in a gentle, reliable and consistent manner through capillary action. Optimisation of appropriate sample loading, embryo capturing, sealing and humidification systems has allowed sensitive and reproducible measurements with the biochip. Characterisation of oxygen consumption by both 2 cell and blastocyst stage preimplantation mouse embryos was achieved by monitoring as few as ten preimplantation embryos over a one-hour time period. The respirometric biochip represents a major improvement for monitoring oxygen consumption by preimplantation embryos compared with the currently available methodologies, in terms of sensitivity, simplicity, speed and sample throughput.Acknowledgements
Financial support of this work by the Irish Health Research Board, grant RP/106/2002 and by the Irish Higher Educational Authority and National Development Plan 2000–2006 is gratefully acknowledged. The authors thank the staff of the UCC animal house for maintaining the animals used in this study, Joe O'Brien from Tyndall microfabrication lab for the assistance with biochip production and Michael Clifford for assistance with statistical analysis of data.References
- P. M. Rijnders and C. A. Jansen, Hum. Reprod., 1998, 13, 2869–2873 CAS.
- G. De Placido, M. Wilding, I. Strina, E. Alviggi, C. Alviggi, A. Mollo, M. T. Varicchio, A. Tolino, C. Schiattarella and B. Dale, Hum. Reprod., 2002, 17, 2402–2409 CrossRef.
- L. Scott, Hum. Reprod. Update, 2003, 9, 237–249 Search PubMed.
- I. Noci, B. Fuzzi, R. Rizzo, L. Melchiorri, L. Criscuoli, S. Dabizzi, R. Biagiotti, S. Pellegrini, A. Menicucci and O. R. Baricordi, Hum. Reprod., 2005, 20, 138–146 CAS.
- W. E. Roudebush, J. D. Wininger, A. E. Jones, G. Wright, A. A. Toledo, H. I. Kort, J. B. Massey and D. B. Shapiro, Hum. Reprod., 2002, 17, 1306–1310 CrossRef CAS.
- D. K. Gardner, M. Lane, J. Stevens and W. B. Schoolcraft, Fertil. Steril., 2001, 76, 1175–1180 CrossRef CAS.
- R. G. Sturmey and H. J. Leese, Reproduction, 2003, 126, 197–204 Search PubMed.
- D. R. Brison, F. D. Houghton, D. Falconer, S. A. Roberts, J. Hawkhead, P. G. Humpherson, B. A. Lieberman and H. J. Leese, Hum. Reprod., 2004, 19, 2319–2324 CrossRef CAS.
- R. M. Mills, Jr and R. L. Brinster, Exp. Cell Res., 1967, 47, 337–344 CrossRef.
- J. R. Trimarchi, L. Liu, D. M. Porterfield, P. J. Smith and D. L. Keefe, Biol. Reprod., 2000, 62, 1866–1874 Search PubMed.
- C. Magnusson, T. Hillensjo, L. Hamberger and L. Nilsson, Hum. Reprod., 1986, 1, 183–184 CAS.
- F. D. Houghton, J. G. Thompson, C. J. Kennedy and H. J. Leese, Mol. Reprod. Dev., 1996, 44, 476–485 CrossRef CAS.
- R. Hultborn, Acta Physiol. Scand. Suppl., 1974, 404, 1–47 Search PubMed.
- R. Hultborn, Anal. Biochem., 1972, 47, 442–450 CrossRef CAS.
- D. B. Papkovsky, Methods Enzymol., 2004, 383, 715–735.
- R. C. Manser, H. J. Leese and F. D. Houghton, Biol. Reprod., 2004, 71, 528–533 Search PubMed.
- M. Wodnicka, R. D. Guarino, J. J. Hemperly, M. R. Timmins, D. Stitt and J. B. Pitner, J. Biomol. Screening, 2000, 5, 141–152 Search PubMed.
- G. T. John, I. Klimant, C. Wittmann and E. Heinzle, Biotechnol. Bioeng., 2003, 81, 829–836 CrossRef CAS.
- J. Hynes, R. Hill and D. B. Papkovsky, Toxicol. in Vitro, 2006, 20, 785–792 CrossRef CAS.
- F. C. O'Mahony, C. O'Donovan, J. Hynes, T. Moore, J. Davenport and D. B. Papkovsky, Environ. Sci. Technol., 2005, 39, 5010–5014 CrossRef CAS.
- D. B. Papkovsky, J. Hynes and Y. Will, Expert Opin. Drug Metab. Toxicol., 2006, 2, 313–323 Search PubMed.
- J. O'Brein, P. J. Hughes, M. Brunet, B. O'Neill, J. Alderman, B. Lane, A. O'Riordan and C. O'Driscoll, J. Micromech. Microeng., 2001, 11, 353–358 CrossRef CAS.
- J. Hynes, L. D. Marroquin, V. I. Orurtsov, K. N. Christiansen, G. J. Stevens and D. B. Papkovsky, Toxicol. Sci., 2006, 92, 186–200 CrossRef CAS.
- J. Alderman, J. Hynes, S. M. Floyd, J. Kruger, R. O'Connor and D. B. Papkovsky, Biosens. Bioelectron., 2004, 19, 1529–1535 CrossRef CAS.
- R. Wilson and A. P. F. Turner, Biosens. Bioelectron., 1992, 7, 165–185 CrossRef CAS.
- S. Raty, E. M. Walters, J. Davis, H. Zeringue, D. J. Beebe, S. L. Rodriguez-Zas and M. B. Wheeler, Lab Chip, 2004, 4, 186–190 RSC.
| This journal is © The Royal Society of Chemistry 2006 |