A bio-barcode assay for on-chip attomolar-sensitivity protein detection†
Edgar D.
Goluch
a,
Jwa-Min
Nam‡
b,
Dimitra G.
Georganopoulou
b,
Thomas N.
Chiesl
c,
Kashan A.
Shaikh
a,
Kee S.
Ryu
a,
Annelise E.
Barron
c,
Chad A.
Mirkin
b and
Chang
Liu
*a
aMicro and Nanotechnology Laboratory, Bioengineering Department, University of Illinois at Urbana-Champaign, 208 N. Wright Street, Urbana, IL 61801, USA. E-mail: changliu@uiuc.edu; Fax: 1-217-244-6375; Tel: 1-217-333-4051
bDepartment of Chemistry and Institute of Nanotechnology, Northwestern University, 2145 Sheridan Road, Evanston, IL 60208, USA
cDepartment of Chemical Engineering, Northwestern University, 2145 Sheridan Road, Evanston, IL 60208, USA
First published on 15th August 2006
Abstract
Functionalized nanoparticles hold great promise in realizing highly sensitive and selective biodetection. We report a single disposable chip which is capable of carrying out a multi-step process that employs nanoparticles—a bio-barcode assay (BCA) for single protein marker detection. To illustrate the capability of the system, we tested for the presence of prostate specific antigen (PSA) in buffer solution and goat serum. Detection was accomplished at PSA concentrations as low as 500 aM. This corresponds to only 300 copies of protein analytes using 1 µL total sample volume. We established that the on-chip BCA for PSA detection offers four orders of magnitude higher sensitivity compared to commercially available ELISA-based PSA tests.
1. Introduction
In this paper, we demonstrate a single disposable chip that realizes the recently developed bio-barcode assay (BCA)1,2 for screening protein biomarkers. The BCA employs two sets of particles: (1) dual-functionalized gold nanoparticles decorated with polyclonal antibodies and unique “barcode” DNA sequences, and (2) magnetic microparticles coated with monoclonal antibodies. In the presence of the target molecule, the gold and magnetic particles form a sandwich through antigen–antibody interactions. The sandwich is then isolated from the sample using a magnet, followed by dehybridization of the barcode DNA from the nanoparticle probes. The released barcode DNA indirectly determines the presence of the target protein.This assay offers a number of advantages including (1) ultra-high sensitivity, (2) high selectivity, (3) adaptability to multiple targets, (4) and potentially, reduced sample preparation complexity. Since each gold nanoparticle carries hundreds of DNA strands, there is an inherent signal amplification. The bio-barcode assay is the only detection method known to provide sensitivity at attomolar protein concentrations (hundreds of target molecules in the sample volume) without requiring complex amplification methods such as the polymerase chain reaction (PCR). The PCR process, for example, requires controlled temperature cycling that leads to increased system complexity. The BCA achieves high selectivity through a combination of magnetic separation and lock-and-key binding between targets and capture proteins.
Over the past several years, a number of approaches have been used in the development of portable diagnostic devices with varying degrees of success.3–9 The BCA detection protocol is especially amenable for microfluidic implementation. The high sensitivity of the BCA method, stemming from signal amplification via barcode DNA, allows low concentration levels to be detected while using small sample volumes. The high selectivity against background provides an efficient means of biofiltration and reduces sample pretreatment requirements.
As our initial target, we have chosen to detect free prostate-specific antigen (PSA) because of its clinical importance in the detection of onset and recurrence of prostate and breast cancers.10–15 Other protein targets (e.g., protein markers for testicular cancer and Alzheimer's disease16) are being investigated in the bench-top format and will be implemented in chip format in the future.
2. Overview of chip-based bio-barcode assay
The general BCA protocol can be divided into two stages—target protein separation (stage 1) and barcode DNA detection (stage 2). Major steps are illustrated in Fig. 1. In stage 1, magnetic microparticles (MMP) are introduced into a microfluidic channel reactor. The sample fluid is then flowed into the channel along with functionalized gold nanoparticle probes (NP). Hybridized MMP-PSA-NP sandwiches form when target proteins are present in the sample fluid. The MMPs and MMP-PSA-NP conjugates are then immobilized to the channel wall with a magnet while the supernatant is washed away with several column volumes of buffer. Subsequently, barcode DNA strands are released from the NP probes by applying de-ionized water that dissociates the barcode DNA from the NP.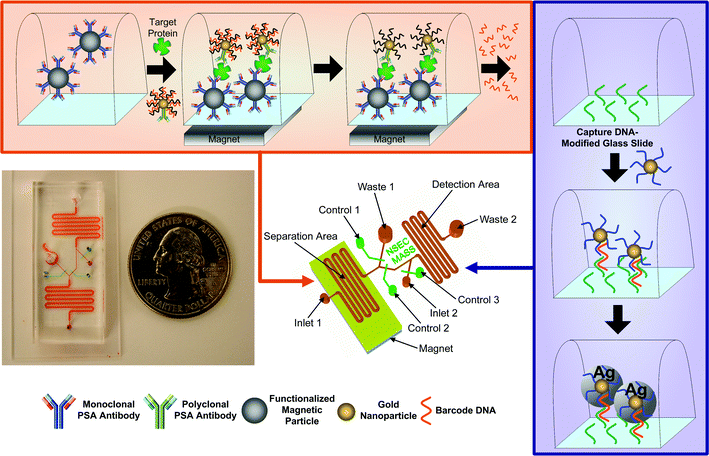 | ||
| Fig. 1 Implementation of the bio-barcode assay within a microfluidic device. First, magnetic particles functionalized with monoclonal PSA antibodies are introduced into the separation area of the chip. The particles are then immobilized by placing a permanent magnet under the chip, followed by introduction of the sample and gold nanoparticles that are decorated with both polyclonal antibodies and barcode DNA. The barcode DNA is then released from the gold nanoparticles and is transported to the detection area of the chip. The detection area of the chip is patterned with capture DNA. Salt and a second set of gold nanoparticles functionalized with complementary barcode DNA sequences are introduced into the detection area to allow hybridization. Finally, the signal from the gold nanoparticles is amplified using silver stain. | ||
For stage 2, the released barcode DNA strands are transferred to a detection channel. The bottom surface of the detection channel is functionalized with capture strands that are half-complementary to the barcode DNA. A second set of NP probes, functionalized with the remaining complimentary sequence, is then introduced. It should be noted that the NPs used here are not the same as the NPs employed in the previous stage. The barcode DNA molecules allow the functionalized NP probes to be hybridized to the surface. Chip-immobilized NPs thus signify the presence of the barcode DNA. The amount of chip-immobilized NPs can be detected with a number of methods. One method involves detecting light scattering off the surface-bound NPs. Exposing the captured gold NPs to a silver staining solution further enhances the detectable optical signal.17 Gold serves as a catalyst for silver staining, hence enlarging the size of the gold nanoparticles. The enhanced particles are visible to the naked eye and can be detected using commercially available scanners.
3. Chip design
Microfluidic chips are fabricated by reversibly bonding molded polydimethylsiloxane (PDMS) channels to a glass slide. This system was chosen because the two materials are well characterized, the PDMS is capable of valving, and channels are easily prototyped.18–20 The chips are disposable, although the top polymer part can be cleaned and reused several times with only the DNA coated glass slide being replaced. Multilayer soft lithography is employed on the chips to provide micromechanical valves for directional control of fluids.21 Serpentine channels, 400 µm wide, 15 µm tall, and 9.0 cm long, are used for the separation and detection sections. Various sections of the completed chip are separated by a set of individually addressable pressure control lines. Pressure sources were actuated by a National Instruments DAQ card and a graphic interface developed with Labview 6.0.Our microchannel reactors for the barcode detection stage are designed for single pass, continuous flow operation. Barcode DNA molecules in the solution must first diffuse to the bottom channel wall and then hybridize with surface-bound DNA molecules. It is important to ensure that (1) all released barcode DNA molecules reach the reaction surface; and (2) there is enough time for the DNA hybridization event to complete. Pertinent design justifications are discussed below.
The diffusion time for DNA molecules in the solution to arrive at the wall is expressed as
 | (1) |
The mean residence time, or the average amount of time a molecule will spend in the serpentine channels, is
 | (2) |
The transfer limitations of the device can be evaluated by comparing the reaction flux and mass transfer coefficients.23 The reaction flux coefficient is related to the rate constant for DNA hybridization (ka) and the area density of surface-bound DNA (gfr). The DNA hybridization kinetics is assumed to follow a second order process with an average rate constant of 1.5 × 10⁶ (M s)−1.24 The average density of the surface-bound DNA was determined to be 20 pmol cm−2. Using these values, the reaction flux coefficient is calculated to be 3 × 10⁻⁴ m s−1 according to
| Lr = kagfr. | (3) |
The mass transport coefficient, on the other hand, is approximately 2.7 × 10⁻⁷ m s−1 according to
 | (4) |
The Damköhler number, or the ratio of hybridization to diffusion rate, is
 | (5) |
In our case, a large Damköhler number (Da >> 1) prevails, indicating that the barcode DNA hybridizes to surface-bound DNA almost instantaneously compared to the diffusion rate. With the given set of conditions, we conclude that ample time exists for hybridization to occur by the end of the detection zone. However, it should be noted that we did not experimentally verify the capture efficiency of barcode DNA molecules in this work.
4. Chip and sample preparation
4.1 Probe preparation
Assay probes were synthesized following previously published protocols.1 A commercially available PSA antibody pair (Biodesign International, Saco, ME) used for indirect ELISA assays was employed in this assay.MMP were prepared by linking monoclonal antibodies of PSA to commercially available 1-µm-diameter amino-functionalized magnetic particles (Polysciences, Inc., Warrington, PA) using the supplied gluteraldehyde–amine coupling protocol. The MMP were suspended in 40 mL of 0.1 M phosphate buffer solution (PBS) (pH 7.4) prior to use.
DNA strands were synthesized and purified in-house according to published procedures using an automated synthesizer (Expedite, Milligene, Burlington, MA) and HPLC (1100 HPLC series, Hewlett-Packard, Palo Alto, CA).25 Reagents for synthesis and thiol modifiers were purchased from Glen Research (Sterling, VA). Thiol modification and synthesis of 13 nm gold NP were carried out following standard published procedures.25
Functionalized gold nanoparticles were made by adding polyclonal antibodies of PSA (7 µg) to an aqueous solution of 13 nm gold NP (1 mL in 12 nM solution) at pH 9.0 and incubated for 20 min. The antibody modified NPs were then reacted with alkylthiol-capped barcode DNA capture strands (0.4 OD; 5′-CAACTTCATCCACGTTCAACGCTAGTGAACACAGTTGTGT-A10-(CH2)3-SH-3′) for 16 h, followed by salt-stabilization in 0.1 M NaCl. The solution was then treated with 0.3 mL of a 10% BSA solution for 30 min to passivate and stabilize the NP. The solution was centrifuged twice for 1 h at 4 °C (20 000 g) and the supernatant was removed. The NP were re-dispersed in 0.1 M NaCl/0.01 M PBS (pH 7.4). Barcode DNA strands (1 OD; 5′-ACACAACTGTGTTCACTAGCGTTGAACGTGGATGAAGTTG-3′) were then allowed to hybridize with the DNA strands coordinated to the NP and purified using a similar centrifugation technique.
Barcode detection NP were synthesized using 13 nm gold nanoparticles functionalized with 3′ alkylthiol-capped oligonucleotides (5′-GCTAGTGAACACAGTTGTGT-A10-(CH2)3-SH-3′) via literature procedures.26 The NP oligonucleotide recognition sequence (20-mer) is complementary to half of the target barcode DNA sequence (40-mer).
4.2 Complementary DNA slide preparation
Glass slides (Fisher Scientific, Pittsburgh, PA) were functionalized with a silane film and a bifunctional amine-thiol linker. DNA capture strands (5′ SH-(CH2)6-A10-CAACTTCATCCACGTTCAAC 3′) were then immobilized in the detection area of the chip using covalent attachment via published procedures.274.3 Chip fabrication
Microfluidic chips are fabricated by molding two PDMS pieces and bonding them in layered, registered fashion.21,28 One PDMS piece contains fluid channels while a second hosts pneumatic control lines. Two separate molding masters are created first using photolithography. We spin coat positive photoresist (AZ4620, Clariant, Somerville, NJ) at 3000 rpm for 60 s on 75-mm-dia Pyrex wafers, followed by a soft bake at 110 °C for 60 s. The photoresist is then photolithographically patterned and developed to yield 15-µm-tall raised features. After development, the photoresist is baked for an additional 20 min in order to round the edges of the developed features. The patterned wafers are then treated with chlorotrimethylsilane (Dow Corning, Midland, MI) vapor for 45 s to facilitate release of PDMS from the masters after the molding process.Mixtures of PDMS prepolymer and curing agent (Sylgard 184, Dow Corning, Midland, MI) are prepared in 20 : 1 v/v and 5 : 1 v/v ratios. The 20 : 1 PDMS mixture is spun on the fluid channel master at 2500 rpm for 60 s while the 5 : 1 PDMS mixture is poured on the control valve master. Both pieces are then baked at 65 °C for 15 min. The PDMS layer that hosts control lines is peeled from the master. Access holes are made for pressure control using a manual drill piece and align the control valve layer to the fluid channel layer using a custom alignment tool. These two layers are bonded together by baking the assembly for 2 h in a convection oven with a slow temperature ramp from 65 to 90 °C. The chip is then removed from the fluid channel master and drill fluid inlet/outlet holes. After the chip is fabricated, it is reversibly bonded with a DNA coated glass slide while maintaining that the coated area aligns with the detection area of the chip.
4.4 Channel functionalization
It has been observed in literature that protein adsorption occurs on both glass and PDMS surfaces.29–32 We have found that this phenomenon creates significant non-specific binding between biomolecules and channel walls (glass or PDMS). The non-specific binding to untreated surfaces contributes to undesirable background signal.This problem is addressed by coating the separation area of the chip with polyDuramide (N-polyhydroxyethylacrylamide), which adsorbs to both glass and PDMS through hydrogen bonding.33,34 The chemical structure of this polymer is identified in Fig. 2A.
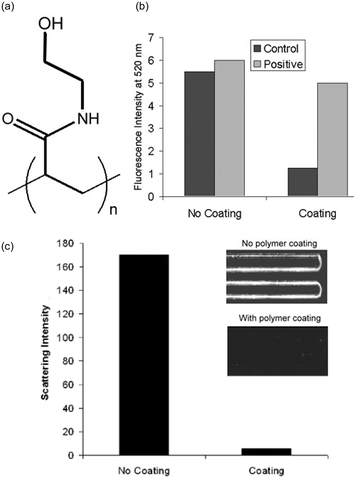 | ||
| Fig. 2 (A) Chemical structure of coating polymer, polyDuramide. (B) Fluorescence intensity of stained barcode DNA released from uncoated and coated chips running the BCA with a negative control containing no PSA and a positive control 3 nM PSA initial concentration. (C) A line-scan within the channel staining area is plotted. Background noise from the blank has been effectively reduced by a factor of 30. (Inset) Blank-sample on-chip silver staining results for an uncoated (top) and coated chip (bottom). | ||
Duramide monomer (Biowhittaker Molecular Applications, Walkersville, MD) was polymerized (1%w/w) by free radical solution polymerization at 50 °C using V-50 (Wake Chemical, Richmond, CA) as the initiator. Polymer product was purified by dialysis membranes against 18 MΩ deionized water and recovered by freeze drying. The functionalization is accomplished by flowing 1 M HCl through the separation area followed by a solution of 0.5 wt% polyDuramide. After application of the polymer, the surfaces of the channels are modified to be hydrophilic by this dynamically adsorbed coating.
We validated the ability of our polyDuramide coating to reduce non-specific binding and background signal for both stages of the BCA chip. Microfluidic chips with and without polyDuramide coating were used to carry out the first stage of the barcode assay with 0 (no PSA) and 3 nM concentrations of PSA. The amount of barcode DNA bound to channel walls was quantified using a fluorescence technique. We combined released barcode DNA with SYBR Green I (an intercalating fluorescent stain that emits at 520 nm in the presence of any DNA molecules) (Molecular Probes, Eugene, OR), and measured the intensity using an F-3010 Fluorometer (Hitachi, Ltd., Tokyo, Japan). Results show that the polyDuramide coating increases the signal to noise ratio by at least 8 times (Fig. 2B).
A second validation experiment was conducted to test the effectiveness of the polymer in reducing background signal in the second stage of the array. A 30-fold reduction of non-specific binding intensity was also found (Fig. 2C).
5. On-chip BCA protocol
We describe in this section the detailed on-chip protocol employed for detection of PSA molecules.5.1 Separation protocol
Sample solutions containing varying concentrations of PSA were prepared by dilution in 0.1 M PBS buffer. An aqueous dispersion of MMP probes functionalized with monoclonal antibodies to PSA (10 µL of 1 mg mL−1 magnetic probe solution) is mixed with an aqueous solution of PSA (10 µL) and stirred at 37 °C for 30 min. One microliter of the solution was loaded onto the chip. The solution is flowed through the chip until the entire separation area is filled. A magnet is then placed under the chip to immobilize the MMP probes on the bottom of the chip. Consequently, the remaining solution is flowed through the separation area into the waste. The NPs (1 µL of 500 pM solution) are introduced and allowed to react with the PSA immobilized on the MMP. The separation area is then washed with 0.1 M PBS buffer to remove any unbound NPs. After the wash step, de-ionized water (1 µL) is run through the chip to dehybridize the barcode DNA strands from the nanoparticle probes. Valves separating the two sections are opened to allow the barcode DNA to be delivered to the detection area of the chip.5.2 Detection protocol
After the barcode DNA is moved to the detection area of the chip, gold NPs (13 nm particles, 1 nM in 0.3 M NaCl) functionalized with DNA complementary to the non surface-bound half of the barcode DNA are flowed through the detection area. Before flowing the barcode DNA through the detection area, one may transfer the fluid to the detection area inlet and add (1 µL of 0.5 M NaCl in PBS) to increase hybridization efficiency. The barcode DNA molecules hybridize to the capture strands on the chip wall. The gold NPs then hybridize to the barcode DNA molecules. All hybridization steps are performed at room temperature. Unbound gold nanoparticles are removed from the detection area by flowing 0.3 M PBS buffer for 10 min. Before the staining and amplification step, sodium nitrate mixed with SDS (1 µL) is flowed through the detection area to remove chloride ions, which would precipitate silver nonspecifically and adversely affect the next step. We prepared the silver staining solution by mixing 100 µL each of silver stain solutions A and B (Ted Pella, Redding, CA). The silver staining solution is allowed to react within the channel for 5 min. The glass slide is separated from the PDMS chip, washed thoroughly with de-ionized water, and dried with nitrogen.The slide is read using a Verigene ID scanning system (Nanosphere Inc., Northbrook, IL), which measures the scattered light from the silver-enhanced gold NPs. Alternatively, we can quantify the surface concentration of nanoparticles using direct SEM visualization. SEM micrographs (250× magnification, 2.5 kV beam, 6.5 mm working distance) were taken of the detection area using an SEM with automatic stitching control (Philips XL30 ESEM-FEG, FEI Company, Hillsboro, OR). A single large-format and yet ultra-high resolution SEM micrograph was produced using a custom tiling software. The effective field-of-view covers the entire serpentine reaction channel.
The optical readout is cheaper and faster than the SEM method. However, the SEM method was used here to cross-examine the optical readouts and ensure that all scattered optical signals are derived from intended nanoparticles hybridization.
6. Results and discussion
Representative images of the silver stained portion of the chip after running the bio-barcode assay are shown in Fig. 3. The results from four experiments are shown with varying concentrations of PSA: no PSA—negative control (Fig. 3A), 500 attomolar (aM) PSA (Fig. 3B), 5 femtomolar (fM) PSA (Fig. 3C), and 50 fM PSA (Fig. 3D). The figures show that the intensity of scattered light increases with increasing concentrations of target PSA.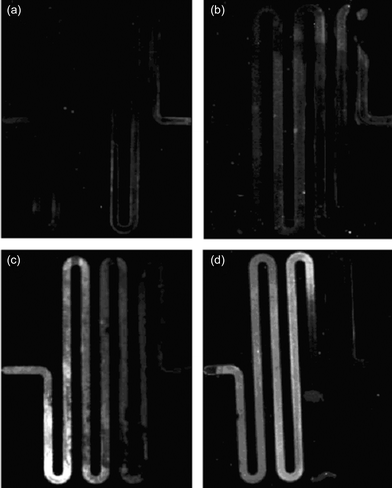 | ||
| Fig. 3 A representative set of results from on-chip testing using 1 microliter PSA sample volume with (a) no PSA (b) 500 aM (c) 5 fM, and (d) 50 fM. | ||
Results obtained using the SEM method for three control experiments—with negative control, 500 aM, and 50 fM PSA samples, are shown in Fig. 4. The inset zoomed images at 250× magnification positively confirm the binding of silver-enhanced NPs inside the channel.
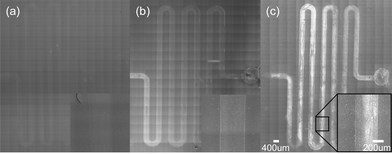 | ||
| Fig. 4 Large format tiled SEM micrographs (each with 266 frames) of the detection chambers of microfluidic devices after the bio-barcode assay was run on the chip with samples containing (a) no PSA, (b) 500 aM PSA, and (c) 50 fM PSA. The inset in C shows one frame acquired under 250× magnification. | ||
We have plotted the light-scattering intensity signal as a function of the number of molecules sampled (300 molecules for 500 aM, 3000 molecules for 5 fM, and 30 000 molecules for 50 fM) collected through 16 independent runs (Fig. 5). We established that the on-chip BCA for PSA detection offers a higher sensitivity of detection compared to ELISA-based methods, the best commercially availability technology.
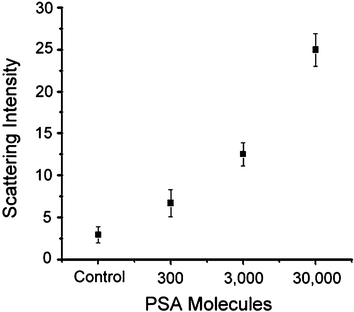 | ||
| Fig. 5 Average scattering intensity measurements for varying amounts of PSA obtained by analysis of silver stained detection area. PSA concentration detected is plotted as the total number of molecules in the 1 µL sample analyzed. | ||
The specificity and selectivity of the protocol was further validated by testing a goat serum solution spiked with varying concentrations of PSA (Fig. 6). Scattering intensities were found to parallel those reported for buffer samples. These proof-of-concept experiments establish that the on-chip BCA assay has capabilities of detecting biomarkers at ultra-low concentrations within a complex biological sample.
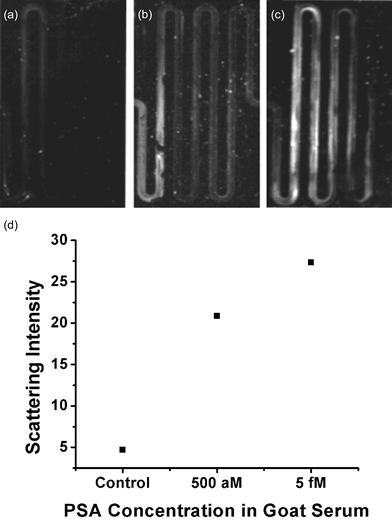 | ||
| Fig. 6 Light scattering images of goat serum samples spiked with (a) no PSA, (b) 500 aM PSA, and (c) 5 fM PSA. (d) Plot of average scattering intensities for images (a), (b), and (c). | ||
7. Conclusions
In this paper, we have developed and demonstrated an ultra-sensitive, nanoparticle based on-chip biodetection assay. The chip sequentially processes microliter sample volumes to detect scarce protein biomarkers in buffer solutions and complex biological fluids. The demonstrated lower detection limit is 500 aM for PSA. Repeatability and selectivity of the on-chip assay have been characterized.Acknowledgements
The authors would like to thank Andrew Shaw, Yelena Grinkova, and Prof. Steve Sligar for assistance with initial experiments and helpful discussions. Special thanks goes to Chas Conway at the Beckman Institute Imaging Technology Group for providing assistance in obtaining tiled SEM images. This work was supported by the Nanoscale Science and Engineering Initiative of the National Science Foundation under NSF Award Number EEC-0118025 and the AFOSR and DARPA via a DURINT award (Grant # F46920-01-1-0401), and the NIH (Grants 5 R01 HG-0197002S1 and AI-03-017). Any opinions, findings, and conclusions or recommendations expressed in this material are those of the authors and do not necessarily reflect those of the National Science Foundation.References
- J.-M. Nam, C. S. Thaxton and C. A. Mirkin, Science, 2003, 301, 1884–1886 CrossRef CAS.
- J.-M. Nam, S. I. Stoeva and C. A. Mirkin, J. Am. Chem. Soc., 2004, 126, 5932–5933 CrossRef CAS.
- T. M. Squires and S. R. Quake, Rev. Mod. Phys., 2005, 77, 977–1026 CrossRef CAS.
- S. K. Sia, V. Linder, B. A. Parviz, A. Siegel and G. M. Whitesides, Angew. Chem., Int. Ed., 2004, 43, 498–502 CrossRef CAS.
- V. Srinivasan, V. K. Pamula and R. B. Fair, Anal. Chim. Acta, 2004, 507, 145–150 CrossRef CAS.
- E. Verpoorte, Electrophoresis, 2002, 23, 677–712 CrossRef CAS.
- Y. Fintschenko, W.-Y. Choi, E. B. Cummings, J. M. J. Frechet, J. A. Fruetel, E. F. Hilder, D. A. Mair, T. J. Shepodd and F. Svec, SPIE Proc. Ser., 2003, 4982, 196–207 Search PubMed.
- M. J. Madou, L. J. Lee, S. Daunert, I. Lai and C.-H. Shih, Biomed. Microdev., BioMEMS World 2000 Conference, 24–27 Sept. 2000, 2001, 3, 245–254 Search PubMed.
- K. F. Jensen, Chem. Eng. Sci., 2001, 56, 293–303 CrossRef CAS.
- W. Catalona, D. Smith, T. Ratliff, K. Dodds, D. Coplen, J. Yuan, J. Petros and G. Andriole, N. Engl. J. Med., 1991, 324, 1156–1161 CAS.
- J. E. Oesterling, J. Urol., 1991, 145, 907–923 Search PubMed.
- M. H. Black, M. Giai, R. Ponzone, P. Sismondi, H. Yu and E. P. Diamandis, Clin. Cancer Res., 2000, 6, 467–473 CAS.
- G. Wu, R. H. Datar, K. M. Hansen, T. Thundat, R. J. Cote and A. Majumdar, Nat. Biotechnol., 2001, 19, 856–860 CrossRef CAS.
- D. S. Grubisha, R. J. Lipert, H.-Y. Park, J. Driskell and M. D. Porter, Anal. Chem., 2003, 75, 5936–5943 CrossRef CAS.
- C. Fernandez-Sanchez, A. M. Gallardo-Soto, K. Rawson, O. Nilsson and C. J. McNeil, Electrochem. Commun., 2004, 6, 138–143 CrossRef CAS.
- D. G. Georganopoulou, L. Chang, J.-M. Nam, C. S. Thaxton, E. J. Mufson, W. L. Klein and C. A. Mirkin, PNAS, 2005, 102, 2273–2276 Search PubMed.
- T. A. Taton, C. A. Mirkin and R. L. Letsinger, Science, 2000, 289, 1757–1760 CrossRef CAS.
- T. Thorsen, S. J. Maerkl and S. R. Quake, Science, 2002, 298, 580–584 CrossRef CAS.
- J. W. Hong, V. Studer, G. Hang, W. F. Anderson and S. R. Quake, Nat. Biotechnol., 2004, 22, 435–439 CrossRef CAS.
- A. Y. Fu, H.-P. Chou, C. Spence, F. H. Arnold and S. R. Quake, Anal. Chem., 2002, 74, 2451–2457 CrossRef CAS.
- M. A. Unger, H.-P. Chou, T. Thorsen, A. Scherer and S. R. Quake, Science, 2000, 288, 113–116 CrossRef CAS.
- K. Pappaert, J. Vanderhoeven, P. Van Hummelen, B. Dutta, D. Clicq, G. V. Baron and G. Desmet, J. Chromatogr., A, 2003, 1014, 1–9 CrossRef CAS.
- R. W. Glaser, Anal. Biochem., 1993, 213, 152–161 CrossRef.
- A. Hassibi, T. H. Lee, R. Navid, R. W. Dutton and S. Zahedi, Conference Proceedings, 26th Annual International Conference of the IEEE Engineering in Medicine and Biology Society, 1–5 Sept. 2004, San Francisco, CA, USA, IEEE, Piscataway, NJ, USA, 2004.
- R. Jin, G. Wu, Z. Li, C. A. Mirkin and G. C. Schatz, J. Am. Chem. Soc., 2003, 125, 1643–1654 CrossRef CAS.
- J. J. Storhoff, R. Elghanian, R. C. Mucic, C. A. Mirkin and R. L. Letsinger, J. Am. Chem. Soc., 1998, 120, 1959–1964 CrossRef CAS.
- L. Chrisey, G. Lee and C. O'Ferrall, Nucl. Acids Res., 1996, 24, 3031–3039 CrossRef CAS.
- D. C. Duffy, J. C. McDonald, O. J. A. Schueller and G. M. Whitesides, Anal. Chem., 1998, 70, 4974–4984 CrossRef CAS.
- H. Makamba, J. H. Kim, K. Lim, N. Park and J. H. Hahn, Electrophoresis, 2003, 24, 3607–3619 CrossRef CAS.
- M. Shoffner, J. Cheng, G. Hvichia, L. Kricka and P. Wilding, Nucl. Acids Res., 1996, 24, 375–379 CrossRef CAS.
- E. R. C. Braden, C. Giordano and James P. Landers, Electrophoresis, 2001, 22, 334–340 CrossRef CAS.
- D. Xiao, H. Zhang and M. Wirth, Langmuir, 2002, 18, 9971–9976 CrossRef CAS.
- M. N. Albarghouthi, T. M. Stein and A. E. Barron, Electrophoresis, 2003, 24, 1166–1175 CrossRef CAS.
- T. N. Chiesl, W. Shi and A. E. Barron, Anal. Chem., 2005, 77, 772–779 CrossRef.
Footnotes |
| † The HTML version of this article has been enhanced with colour images. |
| ‡ Current address: Department of Chemistry, Seoul National University, Seoul, 151-747, South Korea. |
| This journal is © The Royal Society of Chemistry 2006 |
