Characterization of the local temperature in space and time around a developing Drosophila embryo in a microfluidic device
Elena M.
Lucchetta
,
Matthew S.
Munson
and
Rustem F.
Ismagilov
*
5735 S. Ellis, University of Chicago, Department of Chemistry, Chicago, IL USA. E-mail: r-ismagilov@uchicago.edu; Fax: 773 702-0805; Tel: 773 -5816
First published on 12th January 2006
Abstract
This paper characterizes a microfluidic platform that differentially controls the temperature of each half of a living Drosophila melanogaster fruitfly embryo in space and time (E. M. Lucchetta, J. H. Lee, L. A. Fu, N. H. Patel and R. F. Ismagilov, Nature, 2005, 434, 1134–1138). This platform relies on laminar flow of two streams of liquid with different temperature, and on rapid prototyping in polydimethylsiloxane (PDMS). Here, we characterized fluid flow and heat transport in this platform both experimentally and by numerical simulation, and estimated the temperature distribution around and within the embryo by numerical simulation, to identify the conditions for creating a sharper temperature difference (temperature step) over the embryo. Embryos were removed from the device and immunostained histochemically for detection of Paired protein. Biochemical processes are sensitive to small differences in environmental temperature. The microfluidic platform characterized here could prove useful in understanding dynamics of biochemical networks as they respond to changes in temperature.
Introduction
In this paper, we characterize a microfluidic system, based on laminar flow, that we developed1 to create environments of different local temperature around a live Drosophila melanogaster embryo. Multi-stream laminar flow2–5 is particularly useful for differentially controlling the local environment around a cell on the microscale.6–10 Two laminar streams of flow in a microfluidic T-sensor were used as a diffusion-based immunosensor.4 Patterning of features <5 µm in microchannels2 and exposure of part of a cell to small molecules in microchannels3 has been achieved using multiple streams of laminar flow.Using a simple ‘Y’ junction device, the temperature of different regions of a live Drosophila embryo can be controlled in space and in time by flowing two laminar streams of different temperature over the embryo.1 Previously, we have shown that the ‘Y’ junction device can be used to understand the dynamics of the biochemical network in a live Drosophila embryo. Here, we characterize the temperature distribution around the embryo in the device, and characterize the effect of positioning of the embryo in the channel on fluid flow and the temperature distribution around the embryo. Using numerical simulations, we predict the temperature distribution within the embryo. We also confirm previous results that the embryo feels the effect of the temperature, previously observed by staining for the protein Even-skipped. Here, we use histochemical immunostaining11 to detect the protein Paired after the embryo is removed from the channel and fixed to preserve internal structure.11 Paired is a pair-rule protein expressed after Even-skipped in a similar striped pattern along the antero-posterior axis of the embryo. We show that Paired stripes, like Even-skipped stripes, are formed out of order (stripes form in the warm half of the embryo first) but in the correct position.
Experimental
Experimental setup
Rapid prototyping in polydimethylsiloxane (PDMS)12 (Sylgard® 184, Dow Corning Corp., Midland, MI), was used to fabricate two multilevel molds of different depths (Fig. 1) from machine-milled brass masters. The PDMS molds were designed with a two-inlet ‘Y’ junction. One PDMS mold was fabricated with a depth of 500 µm, width of 850 µm, and alignment posts, and one PDMS mold was fabricated with a depth of 250 µm, width of 850 µm, and alignment holes.12 Both channels were 2 cm in length. Prior to assembly, the molds were sealed to 1 mm thick, 1 × 3 inch glass slides using a plasma cleaner (Harrick Scientific, Pleasantville, NY). The Drosophila embryo (∼500 µm × 200 µm × 200 µm) was placed on a thin (65 µm in thickness) strip of Scotch® double-coated tape (3 M, #667) across the 250 µm deep channel at the converging point of the two inlets. The mold containing the 500 µm deep channel was inverted over the embryo. The molds were aligned by snapping the alignment posts into the alignment holes (Fig. 1b), without damaging the embryo. The two assembled pieces were then clamped prior to start of flow. The entire assembly of the device prior to flow required less than one minute (Fig. 1c), which is critical since many important embryonic processes occur directly after fertilization. | ||
| Fig. 1 Fabrication and assembly of the microfluidic device. (a) Multi-level polydimethylsiloxane (PDMS) molds were fabricated from multi-level machine-milled brass masters. The top channel was 850 µm × 500 µm (width × height) and the bottom channel was 850 µm × 250 µm (width × height). (b) The embryo was placed on double-sided tape over the bottom channel. Alignment posts of one PDMS mold were snapped into alignment holes of the second PDMS mold. (c) After assembly, one warm laminar stream and one cool laminar stream were flowed around the embryo, maintaining each half of the embryo at a different temperature. | ||
Controlling and visualising fluid flow
Flow was supplied using a syringe pump (KdScientific). Two converging laminar streams of aqueous 1× phospate-buffered saline (PBS) buffer (137 mM NaCl, 2.68 mM KCl, 10.14 mM Na2HPO4, and 1.76 mM KH2PO4, adjusted to pH 7.2) (Fisher Scientific, Fairlawn, New Jersey) were flowed through the device at a flow velocity of 5 cm s−1, which was calculated from the total flow rate of 2 mL min−1. Laminar flow was observed by two methods: (a) flow was visualized by labeling one laminar stream with ink, (b) flow was visualized using a suspension of FluoSpheres sulfate microspheres, 1 µm (Molecular Probes, Carlsbad, CA).To create a temperature step across the main channel, each stream was maintained at a controlled temperature using EchoTherm™ digital electronic chilling/heating plates (model IC22, Torry Pines Scientific, Inc.). The fluid was flowed through Intramedic™ Clay Adams™ Brand polyethylene tubing (Becton Dickinson and Company) with an inner diameter of 1.14 mm and an outer diameter of 1.57 mm. The polyethylene inlet tubing was passed through an 80 cm long piece of copper tubing, coiled over the heating/chilling plates and insulated. To minimize heat loss, the length of the tubing connecting the chilling/heating plate and the device was kept to a minimum (typically ∼2 cm). Temperature of the fluid entering the main channel was calibrated at each inlet of the PDMS channel using a Digi-Sense® Thermistor Thermometer (Cole-Parmer Instrument Company). Temperature equilibration through the copper tubing was efficient, and heat loss through the connecting segment was minimized, as evidenced by the similarities of the set temperature of the plate and measured temperature inside the channels. When the set temperature of the plate was 28 °C, the temperature at inlet was 27 °C, and when the set temperature of the plate was 18 °C, the temperature at the inlet was 20 °C. Room temperature was ∼23 °C.
The temperature difference between the two streams of laminar flow was visualized using a suspension of thermochromic liquid crystals (Image Therm Engineering). The response time of the liquid crystals is ∼10 ms—at a flow velocity of 5 cm s−1, each point along the channel is represenative of 500 µm upstream of that point.
The temperature of the two different streams of flow could be rapidly switched on the monitor of the digital electronic chilling/heating plates during experiments in which the temperature of the two laminar streams was reversed. The response time after digitally changing temperatures was ∼5 minutes for the temperature at the inlets to go from 20 °C to 27 °C or from 27 °C to 20 °C. Room temperature was ∼23 °C.
Simulating fluid flow and heat transport
The steady state fluid flow and heat transport within the microfluidic channel were simulated using a commercial finite element package FEMLAB™ 3.1 (Comsol AB, Stockholm, Sweden). A section of the channel in the vicinity of the embryo (2 mm of the 2 cm length of the channel) was modeled (Fig. 2). A three-dimensional geometry representing the embryo in the channel was drawn. Half of an ellipsoid with a length of 500 µm and a width and height of 200 µm was draw to represent the embryo. The effects of embryo placement and rotation on the temperature distribution within the embryo were determined. | ||
| Fig. 2 Geometry of the channel and finite element mesh used in numerical simulations. All segments of the channel are 850 µm wide in the y-direction and 750 µm deep in the z-direction. The channel outline and the position of the double-sided tape and embryo are shown in the inset. | ||
To simulate fluid flow over the embyro, the incompressible steady-state Navier–Stokes equations were used [eqn (1)]
 | (1) |
To simulate heat transport, the convection-conduction equation was used [eqn (2)]
| k∇2T + ρCpv∇T = 0 | (2) |
The channel walls were assumed to be thermal insulators. The temperatures at the inlets were fixed at 300 K and 293 K. The temperature at the surface of the embryo and surface of the tape was assumed to be continuous with the temperature of the fluid. We assumed that the heat flux at the channel outlet was dominated by the convective flux. Simulation convergence was determined using successive mesh refinement. Heat capacities [J kg−1 K−1] of 4180, 130, and 4180 were used for buffer, tape, and embryo, respectively. A thermal conductivity [W m−1 K−1] of 0.6, 0.2, and 0.6 was used for buffer, tape, and embryo, respectively. Densities [kg m−3] of 1000, 1160, and 1000 were used for buffer, tape, and embryo, respectively. Finally, viscosities [kg m−1 s−1] of 0.001 and 0.001 were used for buffer and embryo, respectively.
All models presented here assumed the system was operating in a steady state. This assumption was based on the relatively rapid time scale for heat transfer across the embryo in comparison to the time scale for heat transfer into the PDMS. To verify rapid heat transfer through the embryo, the thermal diffusivity through the eggshell surrounding the embryo and through the cytoplasm was calculated and compared. The thermal diffusivity, DT [m2s−1] was calculated using DT = k/ρCp, where k is thermal conductivity [W m−1K−1], ρ is density [kg m−3], and Cp is specific heat [J kg−1K−1]. The time scale t [s] of heat transport through the eggshell and cytoplasm was approximated by t = x2/2DT, where x [m] is the distance over which heat transport is taking place. The eggshell, which is composed of waxy layers, was approximated by paraffin wax, for which k = 2.5 × 10⁻³ kJ m−1 s−1 K−1, ρ = 930 kg m−3, and Cp = 2.1 kJ kg−1 K−1, giving DT = 1.3 × 105 µm2 s−1 , t = 0.9 × 10⁻⁵ s. The cytoplasm of the embryo was approximated by water, for which k = 6.0 × 10⁻³ kJ m−1 s−1 K−1, ρ = 1000 kg m−3, and Cp = 4.2 kJ kg−1 K−1, giving DT = 1.4 × 105 µm2 s−1, t = 0.9 s.
Collecting embryos and detecting protein expression in the embryo after being exposed to a temperature step
Wild-type (Oregon R.) Drosophila embryos were collected from adults on molasses plates with yeast medium,13 at 23 °C for 2–5 minutes. The embryos were placed on double-sided tape (Scotch® #667) and assembled in the microfluidic device.Embryos removed from the microfluidic device after being exposed to the temperature step, were hand dechorionated on double-stick tape, fixed in 3% formaldehyde in PEM buffer (0.1 M 1,4-piperazine diethane sulfonic acid (PIPES), 2.0 mM [ethylenebis(oxyethylenenitrilo)]tetraacetic acid (EGTA), 1.0 mM MgSO4, adjusted to pH 6.95) (Fisher Scientific, Fairlawn, New Jersey) and histochemically immunostained according to standard procedures.11 Protein expression was detected through oxidation of diaminobenzidine (DAB) by conversion of H2O2 by horseradish peroxidase. A mouse monoclonal antibody (DP311) that recognizes several Pax3/7 gene products including Paired and goat anti-mouse HRP IgG (H + L) secondary antibody were used to detect Paired protein.14
Results and discussion
Experimental verification of laminar flow and temperature step across the main channel
In simple geometries, laminar flow is expected at values of the dimensionless Reynold's number (Re)15 that are less than 2000. A stable laminar interface between the two streams of flow was observed when ink or fluorescent microspheres were used to mark flow at a flow velocity of 5 cm s−1 (Re = 13 in outlet channel). While the overall flow is clearly laminar under the conditions used in experiments, at values of Re ∼ 40 it is possible for localized eddies to exist. Eddies could affect the temperature profile around the embryo. No eddies or fluid crossover was observed experimentally, as demonstrated by the streamlines of fluorescent microspheres (Fig. 3a).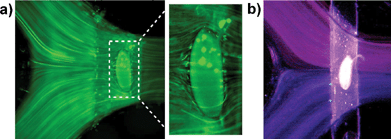 | ||
| Fig. 3 Experimental observation of flow and temperature profile around a live embryo in a microfluidic device. (a) Flow profile observed with a suspension of FluoSpheres. No eddies were observed around the embryo. (b) Temperature profile observed with a suspension of thermochromic liquid crystals. A tight thermal boundary was observed between the two laminar streams of flow around the embryo, confirming the presence of a temperature step (T-step) across the main channel. | ||
A step-like temperature profile was observed in the main channel by flowing a suspension of thermochromic liquid crystals. A tight thermal boundary was experimentally observed at the interface of the two laminar streams of flow (Fig. 3b). The temperature profile across the main channel and the embryo is therefore referred to as a temperature step (T-step).
Verification of laminar flow and temperature step across the main channel by numerical simulation
FEMLAB was used to numerically simulate fluid flow and heat transport within the channel. The flow profile obtained by numerical simulation further confirms the presence of laminar flow. Placement of the embryo in the center of the cross section of the main channel did not lead to the formation of eddies within the channel (Fig. 4a). Streamlines of fluid flow over and around the embryo were continuous, whereas eddies would have appeared as closed streamlines. The velocity and temperature fields at the midplane of the channel are shown in Fig. 4b and c, respectively. | ||
| Fig. 4 Velocity and temperature profiles determined by numerical simulation. (a) Stream lines color-coded with fluid temperature mapped the paths of the fluid as it flows around the embryo. Eddies would appear as closed loops, and were not observed. (b) Velocity field at the vertical mid-plane of the channel. The fluid was observed to accelerate as it flowed around the embryo. (c) Temperature profile at the vertical mid-plane of the channel. Conduction through the embryo broadened the transition between the high and low temperatures. (d) Temperature distribution within the embryo. The temperature profile was taken at a cross-section through the middle of the embryo. | ||
The numerical simulations also considered heat conduction within the embryo. The steady-state temperature distribution for the cross section along the antero-posterior axis of the embryo is shown in Fig. 4d. The temperature profile within the embryo is also step-like.
Simulating the effects of embryo position on the temperature distribution across the main channel
We determined the error in placement of the embryo by assembying 10 embryos in the microfluidic device and measuring the offset of the embryo in the y direction, and the rotation of the embryo away from the y plane (Fig. 5a). The largest measured offset of the embryo in the y direction was 36 µm. The largest rotation of the embryo away from the y plane was 3°. After assembling embryos in the microfluidic device, an offset of the embryo greater than 20 µm and a rotation of the embryo greater than 3° were easily detected. Embryos that were offset more than 20 µm or rotated more than 3° were removed from the channel and not used for experiments. Using numerical simulations, we quantified the effects of variation in embryo position on the temperature profile within the embryo. The largest offset (36 µm), largest rotation (3°), largest offset and largest rotation (36 µm, 3°), and smallest offset detectable by visualization (20 µm) in the 10 embryos were considered, as well as shifting the embryo to the edge of the tape towards the converging point of the two laminar streams (Fig. 5c–h). The temperature along the midplane of the embryo was plotted as a function of embryo length for each simulation (Fig. 5b). | ||
| Fig. 5 Effect of embryo position on temperature within the embryo. (a) The layout of the computational domain is shown from above for the normal embryo position. (b) The temperature profiles along the hemisphere of the embryo are plotted as a function of embryo length. (c)–(h) The temperature on the fluid/embryo interface is shown projected onto the x–y plane for each of the simulated embryo positions. (i) Flow velocity profile around an embryo shifted 36 µm in the y direction. | ||
Normal position of the embryo centered across the main channel with the length of the embryo perpendicular to flow resulted in a step-like temperature profile (Fig. 5b, c). The effect of rotating the embryo 3° away from the perpendicular was negligible, shifting the temperature profile by ∼2% embryo length (Fig. 5b, d). Shifting the embryo to the edge of the tape upstream, towards the converging point of the two laminar streams, did not shift the temperature profile along the embryo length, but slightly sharpened the thermal boundary (Fig. 5b, e), presumably due to the shorter contact time between the two streams upon reaching the embryo. The effect of embryo offset on the temperature distribution within the embryo was more pronounced. The smallest offset detectible by visualization, 20 µm, caused the temperature profile to be shifted ∼8% embryo length (Fig. 5b, f), while the maximum shift of 36 µm caused the temperature profile to be shifted ∼16% embryo length (Fig. 5b, g). This shifting of the boundary between the two different temperature laminar streams can be explained by a change in the flow velocity between the tip of the embryo and the channel wall. The regions between the tips of the embryo and the walls are constricted. Shifting the embryo opens one constriction while closing the other, leading to the corresponding increase and decrease of the flow velocity, and the shift of the boundary between the two streams. Therefore, small changes in distance have a significant impact on flow rate.
Embryos exposed to fluid flow in the microfluidic device develop normally
The shear rate at the embryo was calculated to be ∼700 s−1 (refer to the supplementary information of ref. 1). We used numerical simulations to verify the shear rate at the embryo. The shear rate was obtained from the numerical simulations by plotting dU/dy, where dU [m s−1] is the change in average velocity, and dy [m] is the change in position across the channel. The shear rate obtained by numerical simulations was ∼1100 s−1 at the ends of the embryo, and ∼750 s−1 at the top of the embryo. The viability of Drosophila embryos exposed to flow of buffer at higher flow velocities and smaller channel dimensions than in our microfluidic system has been previously shown to be comperable to controls.16 Embryos exposed to fluid flow at constant temperature in our microfluidic device also developed normally (refer to the supplementary information of ref. 1). Embryos exposed to flow for 4 hours after collection and then removed from flow and kept on molasses plates hatched and developed into normal adult flies.Embryos exposed to the temperature step feel the effect of the two different temperatures
Using fluorescent immunostaining, we have previously shown that Even-skipped expression is affected by the T-step. Here, we used histochemical immunostaining11 to validate the characterized microfluidic system by observing expression of Paired protein17,18 in wild-type Drosophila embryos exposed to a T-step of 20 °C/27 °C. Paired protein is expressed in a spatially precise striped pattern in Drosophila embryos. We expected that embryos exposed to an unnatural environment of a T-step could have disrupted protein expression due to the difference in temperature and thus rate of development in the two halves of the embryo. Since Paired expression is controlled by upstream pair-rule gene expression, stripes would be expected to form out of order with stripes forming in the warm half first, since this is what was observed with Even-skipped expression.1Under normal conditions, Paired is expressed in a complex spatial and temporal pattern of seven stripes along the antero-posterior axis of the embryo.17,18 Normally, Paired stripe 1 is expressed first with Paired stripe 2 forming slightly afterwards. Paired stripe 7 is then formed, followed by Paired stripes 3-6.17,18 During early gastrulation, the 7 broader regions of Paired stripes form a 14 striped pattern with gooseberry, a segment-polarity gene.
Development of embryos exposed to a temperature step of 20 °C/27 °C was affected by the two different temperatures. Paired stripes formed out of order, with stripes forming in the warm half of the embryo first (Fig. 6a, c). This result was particularly striking in embryos in which the anterior half was warm and the posterior half was cool (Fig. 6c) in that stripes 3–5 formed before stripes 6–7 were expressed. This is highly unusual, since stripe 7 always forms before stripes 3–5 under normal conditions. While stripes were expressed in the wrong order (Fig. 6a, c), the later 14 striped pattern of Paired and Gooseberry expression was in the correct position (Fig. 6b, d). The developmental network that controls later pair-rule and segment-polarity gene expression remained robust even under the unnatural condition of the T-step.
 | ||
| Fig. 6 Paired protein expression in embryos exposed to a T-step of 20 °C/27 °C. (a)–(b) Embryos exposed to a T-step with the anterior half at 20 °C and the posterior half at 27 °C. (c)–(d) Embryos exposed to a T-step with the anterior half at 27 °C and the posterior half at 20 °C. Paired stripes resolved in the warm half of the embryo first, shown by white arrows in a and c, but the later 14 striped pattern of Paired and Gooseberry expression was in the correct position. Anterior is to the left, posterior is to the right in each image. Fluid flow was from the top. | ||
Conclusions
Experimental characterization of the microfluidic platform showed that there were no eddies in fluid flow and that the thermal boundary between the two laminar streams was tight, creating a step-like temperature profile across the channel. These results were confirmed by numerical simulation. The numerical simulations were used to predict the temperature profile within the embryo. Simulations confirmed that there is also a step-like temperature profile within the embyro, and that the maximum observable variations in embryo positioning do not result in significant changes to the temperature distribution within the embryo. The most significant change in the temperature profile within the embryo resulted from offset in embryo position across the main channel. However, this potential problem can be overcome by marking one stream of flow with dye, facilitating the visualization of the interface between the two laminar streams. By marking flow, the relative flow rates of the two laminar streams can be adjusted to shift the interface of the two streams over the midpoint of the embryo, regardless of the embryo's displacement in the channel cross-section. Automated systems for positioning of embryos are being developed.19 The microfluidic system characterized herein could prove useful for controlling the local temperature of other biological systems. While the device geometry described is sufficient for our purposes, new geometries may need to be designed for more precise temperature control of other systems. The protocol developed here is general and can be used to characterize future microfluidic platforms.Acknowledgements
We thank Nipam H. Patel (Department of Integrative Biology, Molecular and Cell Biology, and Howard Hughes Medical Institute, University of California–Berkeley, Berkeley, CA 94720-3140, USA) for helpful discussions and for providing DP311 antibody. This work was supported by the Searle Scholars Program, the NSF MRSEC Program under DMR-0213745, and the MRSEC microfluidic facility funded by the NSF.References
- E. M. Lucchetta, J. H. Lee, L. A. Fu, N. H. Patel and R. F. Ismagilov, Nature, 2005, 434, 1134–1138 CrossRef CAS (this article is available at http://ismagilovlab.uchicago.edu/publications.html).
- P. J. A. Kenis, R. F. Ismagilov and G. M. Whitesides, Science, 1999, 285, 83–85 CrossRef CAS.
- S. Takayama, E. Ostuni, P. LeDuc, K. Naruse, D. E. Ingber and G. M. Whitesides, Nature, 2001, 411, 1016–1016 CrossRef CAS.
- A. Hatch, A. E. Kamholz, K. R. Hawkins, M. S. Munson, E. A. Schilling, B. H. Weigl and P. Yager, Nat. Biotechnol., 2001, 19, 461–465 CrossRef CAS.
- S. K. Sia and G. M. Whitesides, Electrophoresis, 2003, 24, 3563–3576 CrossRef CAS.
- S. Takayama, J. C. McDonald, E. Ostuni, M. N. Liang, P. J. A. Kenis, R. F. Ismagilov and G. M. Whitesides, Proc. Natl. Acad. Sci. U. S. A., 1999, 96, 5545–5548 CrossRef CAS.
- S. Takayama, E. Ostuni, P. LeDuc, K. Naruse, D. E. Ingber and G. M. Whitesides, Chem. Biol., 2003, 10, 123–130 CrossRef CAS.
- H. B. Mao, P. S. Cremer and M. D. Manson, Proc. Natl. Acad. Sci. U. S. A., 2003, 100, 5449–5454 CrossRef CAS.
- S. K. W. Dertinger, X. Y. Jiang, Z. Y. Li, V. N. Murthy and G. M. Whitesides, Proc. Natl. Acad. Sci. U. S. A., 2002, 99, 12542–12547 CrossRef CAS.
- T. M. Pearce, J. A. Wilson, S. G. Oakes, S. Y. Chiu and J. C. Williams, Lab Chip, 2005, 5, 97–101 RSC.
- N. H. Patel, Imaging neuronal subsets and other cell types in whole mount Drosophila embryos and larvae using antibody probes, Academic Press, New York, 1994, Methods in Cell Biology, vol. 44 Search PubMed.
- J. R. Anderson, D. T. Chiu, R. J. Jackman, O. Cherniavskaya, J. C. McDonald, H. K. Wu, S. H. Whitesides and G. M. Whitesides, Anal. Chem., 2000, 72, 3158–3164 CrossRef CAS.
- Drosophila Protocols, Cold Spring Harbor Laboratory Press, New York, 2000 Search PubMed.
- G. K. Davis, J. A. D'Alessio and N. H. Patel, Dev. Biol., 2005, 285, 169–184 CrossRef CAS.
- R. B. Bird, W. E. Stewart and E. N. Lightfoot, Transport Phenomena, John Wiley & Sons Inc., New York, 2nd edn, 2002 Search PubMed.
- E. E. M. Furlong, D. Profitt and M. P. Scott, Nat. Biotechnol., 2001, 19, 153–156 CrossRef CAS.
- F. Kilchherr, S. Baumgartner, D. Bopp, E. Frei and M. Noll, Nature, 1986, 321, 493–499 CrossRef CAS.
- G. Frigerio, M. Burri, D. Bopp, S. Baumgartner and M. Noll, Cell, 1986, 47, 735–746 CrossRef CAS.
- R. W. Bernstein, X. J. Zhang, S. Zappe, M. Fish, M. Scott and O. Solgaard, Sens. Actuators, A, 2004, 114, 191–196 CrossRef.
| This journal is © The Royal Society of Chemistry 2006 |