Combinatorial methods for the optimization of the vapor deposition of polyimide monomers and their polymerization
Christian
Neuber
,
Markus
Bäte
,
Reiner
Giesa
and
Hans-Werner
Schmidt
*
Makromolekulare Chemie I und Bayreuther Institut für Makromolekülforschung (BIMF), Universität Bayreuth, Bayreuth, Germany. E-mail: hans-werner.schmidt@uni-bayreuth.de; Fax: +49921 55 3206; Tel: +49921 55 3200
First published on 21st July 2006
Abstract
A combinatorial study on the synthesis and in situ orientation of thin films of aromatic polyimides on different aligning surfaces was carried out. Monomer and polyimide libraries prepared by using a combinatorial approach consisting of step gradients with different thicknesses, sectors with different compositions, and sectors with or without alignment layers were investigated. As aligning surfaces, friction deposited layers of PTFE, rubbed polyimide films, and highly oriented polyimide layers prepared by a shearing technique were used. In addition to 3,3′,4,4′-biphenyldianhydride (BPDA), only para-linked dianhydrides and diamines with different aspect ratios were utilized. Vapor deposition was performed first with individual monomers, then sequentially or by coevaporation of two or more monomers. By using this combinatorial approach, the monomer and polyimide orientation can be optimized by variation of monomer composition, film thickness, and deposition sequence. The resulting films were characterized regarding their thickness and the achieved degree of orientation by polarized FTIR and UV–vis spectroscopy. The highest degree of orientation indicated by a dichroic ratio of nine to ten was observed for 4,4″-diamino-p-terphenyl on PTFE surfaces. For other monomers, dichroic ratios of around two were determined irrespective of the aligning surface, indicating low orientation. It was found that coevaporation of both monomers yields isotropic polyimide films in good quality, whereas sequential evaporation of monomer pairs yields polyimide films with anisotropic properties.
Introduction
The combinatorial approach is a very fast and efficient method for screening new materials and material combinations, and for optimizing device configurations with the advantage of preparing internal references under identical conditions.1,2 In this paper we describe the utilization of a combinatorial approach for the optimization of the fabrication of polyimide films via sequential vapor deposition (VD) and vapor deposition polymerization (VDP) of monomer pairs. The optimization of this process requires the control of many experimental parameters, such as the nature and composition of monomers, evaporation rate, layer thickness, aligning surface, sequential or codeposition, and imidization conditions, which can be largely facilitated by combinatorial methods.The advantages of using the vapor deposition process are a solvent free process, no contamination by dust and other particles, a smooth surface layer, and a homogeneous, easily adjustable layer thickness.3 With this technique, thin films of aromatic polyimides can be prepared, which basically cannot be obtained via solution processing methods due to the limited solubility of monomers and the resulting polymers. Polyimide thin films chemically identical to Kapton® were first synthesized by VDP independently by the research groups of Iijima4 and Salem;5 both evaporated pyromellitic dianhydride (PMDA) and 4,4′-diaminodiphenyl ether (ODA). VDP was employed to synthesize a variety of other polyimides6–8 using silylated monomers,9 or for fluorinated polyimides.10,11 Comparing polyimide films prepared by VDP to solvent cast films, VDP films showed a smooth surface, improved dielectric properties, higher resistance to hygroscopic stresses, improved stiffness, and a higher density indicating more compactly packed molecules.8 Polyimides are particularly suitable for VDP experiments since they are formed in a polyaddition–condensation sequence and their monomers are frequently purified by sublimation indicating high thermal stability.
Highly ordered organic thin films are of great interest in the electronic, optic, and display industries due to their enhanced properties for various applications.12–14 The orientation of different molecules can be achieved by self-assembly or by external energetic or mechanical forces, such as highly electrical magnetic fields, shear forces, or alignment layers. For example, buffed polyimide films with an optimized surface orientation are state-of-the-art in the LC-display technology.15–17 Here the intermolecular interaction between the polymer chains of the alignment layer and the LC molecules are presumably responsible for the alignment. Therefore the rubbing-induced alignment can be compared to the intrinsic orientation obtained from bulk-drawn polymers.18,19 Further, sheared precursor polymers and the corresponding polyimides also show intrinsic bulk orientation20 and thus they should be alternatively useable as polyimide alignment layers. A completely different aligning surface is produced by the friction deposition of poly(tetrafluoroethylene) (PTFE). Electron-diffraction studies of the friction-transferred PTFE layers showed that the chain axis of the PTFE helixes is oriented parallel to the substrate surface and extended along the sliding direction.21 The obtained single-crystal-like structure of the PTFE layers over a large surface (several cm2) aligns low and high molecular weight liquid crystalline and crystalline materials from melt, solution, and by epitaxial growth from vapor.21–24 VDP was further used to fabricate thin films with intrinsic molecular orientation parallel or perpendicular to the substrate, which can be controlled by the nature of the substrate and the deposition conditions. Generally, molecules orient parallel to the surface at lower substrate temperatures and perpendicular at higher.25
As the VDP process and the orientation of polyimides is complex and affected by many different parameters, the advantage of an efficient screening method is obvious. Single, one-by-one experiments are not able to consider the influence of several complex interacting processing parameters. Therefore we developed a combinatorial experiment in order to address the influence of the various parameters. In this contribution, the evaporation and orientation characteristics of fully aromatic diamino and dianhydride monomers for the formation of polyimides on different aligning surfaces are described. A combinatorial strategy was developed employing substrates consisting of different aligning surfaces on which polyimide monomers can be deposited in a step-thickness gradient. The resulting libraries consist of sectors of deposited monomers on different aligning surfaces and at different layer thicknesses. In addition, these sectors can be compared to a reference area, all prepared in one single experiment under identical conditions.
Experimental
Materials
3,3′,4,4′-Biphenyldianhydride, BPDA, (1), pyromellitic dianhydride, PMDA, (4) (both Chriskev Comp. US), p-phenylenediamine, PDA, (5) (Aldrich), and 4,4″-diamino-p-terphenyl (3) (Lancaster) were purified by sublimation. Perylene-3,4,9,10-tetracarboxylic dianhydride (11) (Lancaster) was dried under vacuum at 250 °C for 6 h. 4,4′-Diamino-1,1′-binaphthyl, naphthidine (2)26 and 2,5-diethylbis(ethoxycarbonyl)terephthaloyl acid (8)27 were synthesized according to literature procedures. N-Methyl-2-pyrrolidinone (NMP, water content <0.005%), pyridine, and chlorotrimethylsilane (TMSCl) were purchased from Aldrich in Sure Seal® bottles and used without further treatment. m-Cresol was refluxed and distilled from CaH2 and stored under dry argon atmosphere. All other solvents and chemicals were commercial products and used as received.Substrates were cleaned successively in chloroform and isopropyl alcohol for 10 min in an ultrasonic bath, kept in methyl ethyl ketone steam for about 3 h, dried in vacuum at 50 °C, and finally treated in an oxygen plasma etcher (Anatech Plasma Series DAIWA DP810 Digital SWR Power Meter, 1.5 × 10⁻² bar at 70 W for 10 min) immediately before use.
For doctor blading of solutions, a custom-made machine (BASF AG) was used. A glass substrate was mounted on a heated metal plate at 70 °C. A motor-driven doctor blade (Erichsen, barrel shape: 5 µm gap) moved a filtered solution (0.2 µm PTFE filter) evenly over the substrate. The final layer thickness can be adjusted by using different blade gap sizes and solution concentrations.
Monomer synthesis
Yield: 4.06 g (71%). FT-IR (KBr); ![[small nu, Greek, tilde]](https://www.rsc.org/images/entities/i_char_e0e1.gif) [cm−1]: 3076, 1866, 1785, 1724, 1522, 1377, 796. 1H-NMR (DMSO-d6); δ [ppm]: 8.17 (b, 4H), 7.64 (b, 4H).
[cm−1]: 3076, 1866, 1785, 1724, 1522, 1377, 796. 1H-NMR (DMSO-d6); δ [ppm]: 8.17 (b, 4H), 7.64 (b, 4H).
Yield: 3.20 g (74%). FT-IR (KBr); [cm−1]: 3461, 3412, 3366, 3329, 2926, 2870, 1771, 1718, 1633, 1506, 824. 1H-NMR (DMSO-d6); δ [ppm]: 8.15 (s, 2H), 8.12 (dd, 8H), 4.25 (q, 4H), 1.15 (t, 6H).
Yield: 0.52 g (35%). FT-IR (KBr); [cm−1]: 3170, 3063, 1687, 1589, 1359, 1274. UV(solid film): 495sh, 500, 560 nm.
Alignment layer preparation
A commercial buffing machine LCBM6 (Optron Systems Inc.) with a translating substrate holder, a vacuum chuck, and a rotating roller (diameter 70 mm) covered with a velvet cloth was used. The roller-to-stage distance was adjusted with two micrometer set-screws. The buffing process was carried out at RT, the revolution of the roller was 600 rpm, the pile impression was 0.8 mm, and the substrate was moved in one continuous motion at 1 mm s−1.Surface polyimide aligning substrates were obtained by doctor blading precursor polymer solutions on a glass substrate. The obtained films were first soft-baked at 100 °C for 1 h and then thermally converted into the polyimide under N2 atmosphere at a hot stage. The samples were kept for 1 h at 100 °C, 200 °C, and 300 °C, ramped at 10 K min−1. The polyimide-covered substrates were buffed at RT; only two-thirds of each substrate were buffed to create a reference sector with no buffing treatment. Bulk oriented polyimide substrates were fabricated via a shearing process using a Tribotrak® machine from DACA Instr., USA, with a modified setup described in detail elsewhere.20 Lyotropic solutions of a poly(amic ethyl ester) were sheared with a sequence of four 1.5 mm diameter glass rods mounted on a holder at 25 mm s−1 at 100 °C and 10 kg. To minimize the evaporation of NMP, the lyotropic solution was covered with an additional glass plate during the shearing process. After shearing, the PAE films were thermally imidized as described above.
For friction deposition of PTFE on quartz glass substrates or silicon wafers, the same Tribotrak machine was employed, consisting of a translating stage and a pivoting PTFE rod holder. The speed of the translating stage can be varied between 0.01 and 30 mm s−1, the sample stage and the PTFE holder can be heated individually between 25 °C and 350 °C. On top of the PTFE holder contact, a force is applied by weights in the range of 2.5 to 10 kg. Only two-thirds of each substrate was covered with PTFE alignment layer to create a one-third reference sector without a layer. To evaluate the effect of temperature on the quality of the PTFE aligning surfaces, the substrate and PTFE holder temperature were set to 150 and 300 °C in combination with weights of 5 and 10 kg.
Combinatorial vapor deposition
Each substrate was mounted in a rotatable substrate holder above a mask which is located next to the motor-driven shutter. About 300 mg of each monomer were placed in the sources using crucibles. The vacuum chamber (Balzers PLS 500) was evacuated to 10−5–10−6 mbar. First, a constant evaporation rate was set manually by increasing the temperature of the sources; then, control was transferred to a computer program to achieve reproducible and constant evaporation rates. The closed loop control input was the frequency signal of quartz crystals placed near the source. Here, evaporation rates were about ten times higher than detected with additional quartz sensors near the substrate. Thus, slight fluctuations of the evaporation rate were corrected by the hardware, resulting in a very homogenous layer formation on the substrate. After a few minutes of equilibration, the shutter was opened and the deposition on the substrate proceeded. A step motor moved the shutter in five steps at 530 seconds per step creating a five-step gradient. During normal operation, the mask is missing and the shutter creates the steps. Optionally, different masks can be inserted which cover part of the substrate; for example, by using three different one-third-open masks, which are open on the upper, middle, and lower third, respectively, three different sections can be created on the substrate. In this way, the numbers of sectors can be additionally increased. At the end of the experiment, the shutter was closed, the source power switched off, and the vacuum chamber ventilated with air. The oxidation of the evaporated diamines in air proceeds very slowly and so the substrate was stored in inert atmosphere between the different characterization methods so that oxidation can be neglected.Characterization
FTIR spectra were recorded in transmission mode (16 scans; resolution: 4 cm−1) using a BioRad Digilab FTS-40 and KBr pellets. Polarized transmission FTIR spectra were recorded on silicon wafers in combination with a KRS 5 wire grid polarizer from BioRad. For measurement with parallel and perpendicular polarized light, the sample was kept in the same position but the polarizer was rotated by 90°.1H-NMR Spectra were recorded using a Bruker AC 250 spectrometer (250 MHz) in deuterated dimethyl sulfoxide (DMSO-d6). UV–vis absorption spectra were acquired on a spectral photometer (Hitachi U-3000). Polarized absorption spectra were measured on quartz substrates, placing one Glan–Taylor parallel-oriented polarizer in the sample optical path and in the reference path, respectively. For measuring parallel and perpendicular absorption spectra, the polarizers were rotated 90°, keeping the sample in the same position, and baselines for each particular aligning surface were recorded. Polarized optical microscopy was performed on a Leitz Laborlux 12-Pol. For layer thickness measurements, a surface profilometer (Dektak 3030 ST) was used. The film was scratched with a scalpel and the resulting gap depth denoted as the layer thickness of the film. Settings at medium speed combined with medium resolution and a stylus force of 1·10−5 N result in an accuracy of ± 5 nm. Thermal imidization of evaporated layers was performed on a nitrogen-flushed hot plate controlled by a Eurotherm 903P. First, the hot plate was heated at 1 K min−1 to 100 °C; at this temperature the substrate was tempered for 6 h. The temperature was increased in steps at 1 K min−1 to 150 °C, kept for 12 h, raised again at 1 K min−1 to 300 °C, kept for 12 h, and finally raised at 1 K min−1 to 350 °C and annealed for 12 h.
Results and discussion
Monomer deposition
 | ||
| Fig. 1 Commercially available polyimide monomers used for vapor deposition. | ||
Several series of combinatorial experiments were performed: evaporation on Type 1 substrates for evaluating the optimal processing conditions for PTFE aligning surfaces, Type 2 substrates were used to elucidate the difference between PTFE and polyimide aligning surfaces, and Type 3 and 4 substrates were used for investigating the formation of polyimides during sequential and simultaneous evaporation of monomer pairs, respectively. To further increase the aspect ratio and molecular weight of monomers, other compounds were developed. Monomer 6 was synthesized by endcapping p-phenylenediamine, PDA, (4) with two PMDA moieties as shown in Fig. 2a.
 | ||
| Fig. 2 a) Synthesis of the anhydride-endcapped monomer 6 by using an optimized process and stoichiometry (see text). b) Synthesis of the amino-endcapped monomer 10. The diamino diester 9 was thermally imidized during the evaporation process, yielding 10. c) Synthesis of diamino-functionalized perylene compound 12. | ||
Under typical conditions of a one-step polycondensation for polyimides (i.e. stoichiometric ratio, m-cresol, and reflux),26,28 and in combination with a large excess (10 : 1) of PMDA, an oligomer mixture was always obtained. However, by using a 5 : 1 mixture of NMP and pyridine as solvent and an excess of PMDA, monomer 6 was yielded almost quantitatively at a moderate reaction temperature of 70 °C. To completely avoid oligomer formation, 4-nitroaniline (7) and bis(ethoxycarbonyl) terephthalic dichloride (8) were used for the synthesis of monomer 1029 (Fig. 2b). The condensation conditions were similar to a typical low temperature synthesis of aromatic polyamides in NMP,30 and an intermediate compound with nitro-protected amino groups was obtained. The autoclave reduction with hydrogen rendered the diamino monomer 9 in good yields. This precursor was directly used for further experiments since thermal imidization will occur during evaporation in the crucible and only the imidized molecule 10 is deposited.
In order to introduce a UV–vis active chromophore for polarized UV measurements even on polyimide surfaces, whose absorption overlaps with the one of the monomers presented so far, a perylene unit was functionalized with diamine groups. For the synthesis (Fig. 2c), the perylene dianhydride 11 and an excess of PDA 5 were refluxed with Zn(Ac)2·2H2O as catalyst in m-cresol. The resulting deep crimson monomer 12 was purified by sublimation.
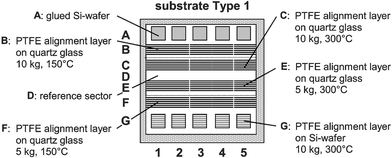 | ||
| Fig. 3 Combinatorial substrate Type 1 (76 × 75 mm) for investigating the orientation behavior of polyimide monomers. The dashed lines indicate the use of three standard 76 × 25 mm glass slides. The substrates are quartz glass with PTFE aligning surfaces (row B, C, E, and F) and 9 × 9 mm Si-wafers (row A and G) for UV–vis and FTIR spectroscopy, respectively. The PTFE aligning surfaces have been prepared under different conditions regarding the temperature and pressure. Row D serves as a reference row without any alignment layer. | ||
Monomers 1 to 3 were evaporated as a five-step thickness gradient as sketched in Fig. 4. These gradients were generated by moving the shutter and no mask in five steps; thus columns 1 to 5 specify different layer thickness of the deposited monomers and column 5 bears the thickest layer.
 | ||
| Fig. 4 Sketch of monomer deposition as a five-step thickness gradient on a Type 1 substrate (76 × 75 mm). A step is generated by moving the shutter below the substrate to the left in steps, so that on column 5 the thickest layer is deposited. The rows A to G identify different substrates such as quartz glass or Si-wafers, columns 1 to 5 steps with different monomer layer thickness. Hence, a combinatorial library with 35 sectors is obtained. | ||
First, a correlation of evaporation rate and layer thickness was established. The layer thickness was determined with the Dektak profile scanner as described in the Experimental part. Naphthidine (2) was evaporated at three different evaporation rates onto different sectors of the same substrate using three different sequentially positioned one-third-open masks, meaning they are open on the upper, middle, and lower third, respectively.
For each rate, a five-step thickness gradient was fabricated by moving the shutter in five steps to the left. Fig. 5 and Table 1 show that the layer thickness increases linearly over the five steps independently of the evaporation rate which was calculated from the slope of the linear fit at 0.07, 0.14, and 0.21 nm s−1. Furthermore, the average step thickness of monomer 2 evaporated at different rates is listed: at a set evaporation rate of 0.21 nm s−1, the produced step thickness increases from 110 nm (step 1) to 530 nm (step 5), whereas at a rate of 0.07 nm s−1, a thickness of 45 nm to 180 nm was determined. At equal evaporation conditions, BPDA (1) and 4,4″-diamino-p-terphenyl (3) show a very similar linear increase in layer thickness. Since it is known that the orientation behavior of evaporated molecules is influenced by the evaporation rate,31 all monomers were evaporated at very low evaporation rates between 0.03 to 0.06 nm s−1. In all cases, a linear relationship of the step thickness and evaporation rate could be established permitting a prediction of layer thickness as a function of time. However, this parameter must be determined for each monomer in separate experiments.
 | ||
| Fig. 5 Layer thickness dependence of naphthidine (2) at three evaporation rates on substrate Type 1. The layer thickness increases linearly over the five-step thickness gradient independently of the evaporation rate. Each step was deposited for 530 seconds. | ||
| Monomer | Substrate type | Measureda evap. rate/nm s−1 | Average step thicknessb/nm | ||||
|---|---|---|---|---|---|---|---|
| Step 1 (530 s) | Step 2 (1060 s) | Step 3 (1590 s) | Step 4 (2120 s) | Step5 (2650 s) | |||
| a Slope of the best fit regression line as shown in Fig. 5. b Experimentally determined by mechanical profile measurements. | |||||||
| 1 | 1 | 0.20 | 110 | 230 | 345 | 430 | 530 |
| 2 | 1 | 0.07 | 45 | 70 | 120 | 150 | 180 |
| 2 | 1 | 0.14 | 80 | 150 | 240 | 300 | 360 |
| 2 | 1 | 0.21 | 110 | 240 | 340 | 420 | 530 |
| 3 | 1 | 0.06 | 40 | 70 | 110 | 150 | 170 |
| 6 | 2 | 0.06 | 30 | 63 | 90 | 120 | 153 |
| 10 | 2 | 0.03 | 15 | 30 | 50 | 60 | 80 |
| 12 | 2 | 0.05 | 30 | 50 | 65 | 95 | 120 |
Further, it was found that the substrate shows homogeneous thickness for each step independently of substrate type (glass, Si-wafer) or aligning surfaces. Hence, the thickness of deposited layers is solely governed by the evaporation rate and not by the substrate surfaces or alignment material, meaning the results can be adopted for other substrates.
 | ||
| Fig. 6 Combinatorial substrate Type 2 (76 × 75 mm) for investigating the deposition behavior of polyimide monomers on different aligning surfaces. The quartz glass substrate is coated with sheared (row I) and rubbed (row L) polyimide alignment layers and with a friction-deposited PTFE layer prepared at 300 °C/10 kg (row J). Row H, with uncoated glass, and row M, covered with an unoriented polyimide film, serve as references, whereas row K contains Si-wafers with PTFE alignment layers (also 300 °C/10 kg) for FTIR spectroscopic investigations. | ||
Orientation behavior of the deposited monomers
| Monomer | Substrate type | Sector | Wavelength/nm | DRUV | Sector | Wave numbera/cm−1 | DRIR |
|---|---|---|---|---|---|---|---|
| a Symmetric stretching mode. b Sheared polyimide aligning surface. c Rubbed polyimide aligning surface. | |||||||
| 1 | 1 | B1 | 300 | 1 | G1 | 1616 | 1 |
| 2 | 1 | C1 | 350 | 1 | G1 | 1513 | 1 |
| 3 | 1 | C1 | 400 | 10 | G5 | 1491 | 9 |
| 6 | 2 | J5 | 300 | 2 | K5 | 1520 | 2 |
| 10 | 2 | J5 | 330 | 2 | K5 | 1510 | 2 |
| 12 | 2 | J2 | 500 | 2 | K2 | 1590 | 2 |
| I2 | 2b | ||||||
| L2 | 3.2c | ||||||
BPDA (1) and naphthidine (2) possess an absorption maximum at 300 and 350 nm, respectively, but polarized UV–vis spectroscopy was not able to detect any orientation in the deposited layers indicated by a DRUV of 1 in Table 2. Polarized FTIR spectra of 1 and 2 on Type 1 substrates show no indication of orientation. The orientation of monomer 3 on PTFE aligning surfaces was characterized by polarized UV–vis spectroscopy between 240 and 550 nm on rows B, C, E, and F. The spectra show a broad maximum at 340 nm and an orientation with a distinct dependence of the measured DRUV on layer thickness. The DRUV increases up to ten at a layer thickness of about 100 nm (step 2–3) and decreases at thicker layers independently of the surfaces underneath. Polarized FTIR spectroscopy was also employed to characterize the orientation of the deposited monomer 3. A characteristic mode is the symmetric vibration of the 1,4-substituted benzene unit at 1491 cm−1.32 For the determination of the degree of orientation, this symmetric stretching mode, which lies parallel to the direction of the molecule, was used, and a DRIR of 9 for sector G5 was calculated at 1491 cm−1. Here, only the thickest layer (sector G5) was investigated since the polarized FTIR measurements require a layer thickness of above 100 nm for sufficient absorbance. Summarizing, the investigated preparation conditions of PTFE aligning surfaces seem to play only a minor role for the orientation behavior of the investigated monomers 1 to 3. For further investigations, PTFE aligning surfaces prepared at 300 °C and with 10 kg were used.
Polarized UV–vis measurements of monomer 6 on Type 2 substrates in the range of 260 to 550 nm reveal an increase in absorption only below 350 nm and no distinct maximum. The degree of orientation for sector J5 (see Fig. 6, PTFE aligning surface, quartz glass) was determined at 300 nm to DRUV = 2 (Table 2). This indicates only a slight orientation of this rod-like monomer. FTIR spectra of 6 were acquired for sector K5 (PTFE aligning surface, Si-wafer) and the degree of orientation was determined using the symmetric stretching mode of the 1,4-substituted phenylene unit at 1520 cm−1, which oscillates parallel to the direction of the molecule, and a DRIR of 2 was calculated.
Polarized UV–vis measurements of monomer 10 were recorded between 550 and 260 nm and showed an absorption maximum at 330 nm with a shoulder at 300 nm. A DRUV of 2 at 330 nm was calculated for sector J5 (PTFE aligning surface, quartz glass). The FTIR spectra of 10 show a characteristic splitting of the asymmetric and symmetric carbonyl-stretching modes at 1760 cm−1/1770 cm−1 (shoulder) and at 1730 cm−1/1700 cm−1, respectively. The degree of orientation was determined using the symmetric stretching mode of the benzene unit at 1510 cm−1, which oscillates parallel to the direction of the molecule, and a DRIR of 2 was calculated also for sector K5 (PTFE aligning layer, Si-wafer, Table 2). Thus, monomers 6 and 10 show a very similar orientation behavior on PTFE aligning surfaces but the achieved degree of orientation is low.
UV–vis spectra of monomer 12, which contains the perylene chromophore, exhibit a shoulder at 495 nm and two maxima at 500 and 566 nm. This distinct bathochromic shift of around 300 nm, compared to the absorption of the other investigated monomers, permits the investigation with polarized UV–vis spectroscopy even on polyimide aligning surfaces. The absorption at 566 nm is typical of the formation of J-type aggregates, where it is observed that coplanar aggregates of the dye have parallel transition dipole moments.33 Polarized UV–vis spectra were recorded between 700 and 300 nm for row I (sheared polyimide surface, quartz glass) and L (rubbed polyimide surface, quartz glass). For row I the degree of orientation was determined to a DRUV of 2, thus in the same range found for the PTFE aligning surface (row J), while the rubbed polyimide aligning surface (row L) induces a somewhat higher DRUV = 3.2 (see Table 2).
In summary, on PTFE aligning surfaces, a low DR of two was determined for monomers 6, 10, and 12, indicating a poor orientation. Based on these results, we conclude that rod-like unsubstituted full aromatic monomers have less mobility on aligning surfaces due to their stiffness and higher molecular weight. In addition, it seems likely that the atomic grooves between aligned PTFE chains at about 4 Å,34 which account for the ordered growth of evaporated molecules, do not permit sufficient reorientation of the monomers.
Selected images of monomer 10 at different sectors of a Type 2 substrate are shown in Fig. 7. Images I1–I5 show the birefringence on top of the shear-oriented polyimide surface next to the uncovered quartz glass. The slight increase in birefringence is proportional to the layer thickness starting from sector I1 to I5, while on quartz glass (row H, top upper half of I1 to I5), no birefringence occurs and thus only isotropic deposited layers are observed. Another behavior was observed on rubbed (row L, image L1–L5) and untreated (row M) polyimide surfaces. Here, 10 crystallizes in small, homogenously-dispersed crystals, accompanied by an increase in birefringence proportional to the layer thickness. Lower birefringence, observed by the polarizer parallel to the rubbing direction, and higher birefringence at 45° both indicate that monomer 10 orients parallel to the rubbing direction of the polyimide surface. Images J1 to J5 depict the same monomer 10 evaporated on a PTFE aligning surface also showing birefringence intensity proportional to layer thickness.
 | ||
| Fig. 7 Polarized light microscopy images of different sectors on a Type 2 substrate library by the vapor deposition of monomer 10 at an evaporation rate of 0.03 nm s−1. The highest intensity of birefringence is observed on the polyimide aligning surfaces in sector I5 and L5. Hence, for this particular monomer, polyimide layers are more potent aligning surfaces than PTFE layers, but with indications of crystallization. | ||
The color of the deposited steps for perylene monomer 12 is visible with the naked eye and changes proportional to the layer thickness from green, blue, gray, light red to red (not shown). The maximal birefringence for this monomer deposited on PTFE aligning surfaces was observed in sectors J2 and J3; in this case, a thicker layer did not generate more intensity. On rubbed and unrubbed polyimide layers, increasing birefringence proportional to layer thickness indicates orientation on these surfaces which is, however, accompanied by a slight crystallization of the monomer with increasing layer thickness.
Polymerization of vapor deposited monomer pairs
Monomers can be vapor deposited sequentially, meaning one after another, or simultaneously realized in a coevaporation of both monomers at the same time. In sequential experiments, the evaporation monomer sequence was also reversed to investigate the influence on film thickness and orientation of the obtained polyimide films. For polymerization, exclusively PTFE friction deposited layers as an aligning surface were investigated, since dianhydride monomers 1 and 6 showed only minor orientation on these surfaces. In all cases the thermal imidization (see Fig. 8) was accomplished by a thermal treatment under nitrogen at stepwise increased temperatures up to 350 °C in combination with slow heating rates of 1 K min−1 and long dwell times of 12 h. These optimized conditions enhance orientation and polymerization, minimize evaporation, and were found in preliminary experiments. | ||
| Fig. 8 Thermal imidization of the aromatic dianhydrides 1 and 6 (R) and the aromatic diamines 2, 3 and 10 (R′) forming the corresponding polyimide conducted at 100 °C for 6 h, 150 °C/12 h, 300 °C/12 h, and finally at 350 °C/12 h heated at 1 K min−1 under a nitrogen atmosphere. | ||
 | ||
| Fig. 9 Combinatorial Type 3 substrate (76 × 75 mm) for investigating the formation and orientation of aromatic polyimides via sequentially evaporated monomers. The substrate consists of PTFE aligning surfaces prepared at 300 °C/10 kg on quartz glass (row O, P and R) and Si-wafers (row N, Q and S), respectively. | ||
For the sequential evaporation of monomers, the combinatorial setup in the vacuum chamber was equipped with a shutter and a two-thirds-open mask. The first monomer was evaporated at 0.05 nm s−1 in a five-step thickness gradient on two-thirds of the substrate by moving the shutter and the mask to the right in five steps, as shown in Fig. 10. Accordingly, step five has the thickest layer of the first monomer. Then the substrate was rotated 180° and the shutter and mask returned to their start position. By repeating the procedure, the second monomer was evaporated at the same rate also in a five-step gradient in the opposite direction with respect to the gradient of the first monomer. Since two-thirds of the substrate were covered during each move, rows N and O were covered with the first monomer, rows R and S with the second monomer, and only rows P and Q were covered with both monomers. The combinatorial library consists of 30 sectors, 10 sectors for each monomer (five different thicknesses and two different rows) and 10 for sequential step gradients in opposite directions (rows P and Q) plus additional reference areas. After removing the Si-wafers, areas of uncovered quartz glass are accessible for further reference if needed.
 | ||
| Fig. 10 Preparation of a combinatorial library on a Type 3 substrate (76 × 75 mm) by sequential evaporation of two monomers. A shutter and a two-thirds-open mask move in five steps to the left creating a five-step thickness gradient. By using this partly open mask and rotating the substrate 180°, the upper and lower third of the substrate are covered by monomer I or II. Only rows P and Q are covered by both monomers with a thickness step gradient in opposite direction. Rows P and Q are also shown in a side view. | ||
To investigate the effect of the monomer evaporation sequence, the dianhydride was deposited directly on top of the PTFE aligning surface and then covered by the diamine. In a second experiment the diamine was deposited first followed by the dianhydride. The layer and polymer film thickness were mechanically measured for each sector. Fig. 11 shows the thickness for all steps obtained after first depositing dianhydride 6. The left bars show individual thicknesses for monomer 6 and 10 measured in row O and R, respectively. The middle bars denote the total thickness of row P, which can be directly compared to the added thickness determined for each monomer. The right bars show the polyimide film thickness after imidization (row P).
 | ||
| Fig. 11 Layer thickness characterization of two sequentially deposited monomers on substrate Type 3. Left bar: layer thickness of the reference sectors (row O and R) of each individual monomer; 6 was deposited first. The bar in the center represents the measured thickness of row P, containing monomer 10 on top of 6 after sequential evaporation in the form of opposite step gradients. The right bar reflects the layer thickness of the same step after thermal imidization. | ||
Comparing the left bars, the step gradients and the change in the composition of 6 and 10 are evident. Moving from step 1 to 5, the thickness ratio of monomer 6 increases, with a ratio close to 1 at steps 2 and 3. The added thickness values of row O and R (left bar) are in good agreement with the measured thicknesses of row P formed by the sequential evaporation of both monomers in an opposite step gradient (middle bar). The overall thickness of the steps is not constant but increases slightly with increasing amount of the dianhydride 6 showing values in the range between 130 and 155 nm. After thermal imidization, row P (right bars) showed a volume shrinkage mainly caused by evaporation of excess monomer during imidization. Consequently, for step 1 and 5 with the largest differences in composition, the thinnest polyimide layers (<50 nm) were found. Conversely, for step 3, the thickest polyimide layer was obtained. This demonstrates that the imidization takes place through a larger part of the film and diffusion of both monomers penetrating each other is required.
By changing the deposition sequence, meaning evaporating diamine 10 first and then dianhydride 6 at the same evaporation rate of 0.05 nm s−1, very similar results were obtained, with step 3 possessing the thickest polyimide layer. Sequential evaporation of other monomer pairs (see Table 3) produced comparable results and always showed a substantial decrease of layer thickness after imidization. The location of the sector with the thickest polyimide film depends on the sequence of monomer deposition as well as monomer structure. Theoretically, the thickest polyimide film is to be expected at strict stoichiometrical conditions. However, identical layer thicknesses do not assure these conditions since the monomer layer density, and thus the mass or amount of moles of deposited material, is different for each individual monomer and inherently not known.
| Monomer sequence | Selected monomer sectors and thickness/nm | Best sectora for polyimide preparation and thickness (nm) before and after imidizationb | |||
|---|---|---|---|---|---|
| a Sector with the thickest resulting polyimide layer. b For imidization conditions see Experimental part. c Thickness: ca. 10 nm. | |||||
| 1st–2nd | Monomer I | Monomer II | Sector | Before | After |
| 1–2 | O1: 20 | R1: 100 | P1 | 130 | 100 |
| 2–1 | O1: 20 | R1: 90 | P1 | 110 | 60 |
| 1–3 | O3: 90 | R3: 65 | P3 | 155 | 90 |
| 3–1 | O5: 70 | R5: 50 | P5 | 125 | 40 |
| 6–10 | O3: 85 | R3: 50 | P3 | 145 | 80 |
| 10–12 c –6 | — | — | P2 | 250 | 250 |
Further experiments were conducted to incorporate the perylene diamine as a UV–vis active chromophore. However, this diamine could not be used alone since its UV–vis absorption is much too strong. Thus it was deposited as a thin interfacial layer of 10 nm in a sandwich structure between the diamine 10 (first) and the dianhydride 6 (third). As shown in Table 3, no shrinkage in sector P2 during thermal imidization could be measured for this layer sequence. Before and after imidization, the thickness was 250 nm in both cases. Therefore, it was surprisingly found that by adding a thin perylene layer in between the diamine and the dianhydride, the shrinkage is dramatically reduced during imidization compared to layers built by two monomers only.
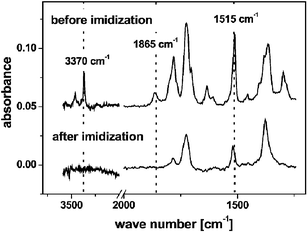 | ||
| Fig. 12 FTIR spectra of sector Q3 before (top) and after (bottom) thermal imidization of the sequential evaporated monomer 10 (first) and 6 (second). The layer thickness of 140 nm as deposited is reduced to 105 nm after thermal imidization. This results in a significantly lower FTIR absorbance of the imidized layer. | ||
The absence of the N–H stretching modes at 3370 and 3460 cm−1 combined with a missing anhydride carbonyl absorption at 1865 cm−1 indicates a high conversion to the polyimide. However, the obvious decrease in intensity of the symmetric vibration of the 1,4-substituted benzene unit at 1515 cm−1 implies monomer desorption off the substrate during imidization. This is supported by thickness measurements revealing a thinner polyimide film after imidization (105 nm) compared to 140 nm of deposited monomers. Shrinkage caused by the imidization, i.e. loss of water, can be neglected since the number of benzene units, and thus their contribution to intensity, remains constant.
Polarized UV–vis spectroscopy was also employed to quantify orientation. For evaporating BPDA (1), which crystallizes on PTFE aligning surfaces, and the bulky monomer 2, anisotropy was detected neither for the monomers nor for the polyimide films, independently of the evaporation sequence. By evaporating 1 first and then the linear diamine 3, a DRUV of 2 was determined before and after imidization. But by reversing the evaporating sequence, the DRUV decreased from 5 to 2 before and after imidization, respectively. Thus, the orientation of rigid-rod aromatic polyimides prepared by vapor deposition onto PTFE aligning surfaces is characterized by a DRUV of around 2 and it could be shown that during the thermal cyclization the degree of orientation is not enhanced.
In sector P5 of the sequentially evaporated monomers 10, 12, and 6, UV–vis measurements at 330 nm revealed a DRUV of 2 independently of the evaporation sequence. After thermal imidization, this weak anisotropy is maintained, indicated by the same DRUV value. Consequently, the evaporation sequence for the rod-like monomers 6, 10, and 12 does not influence the orientation behavior before and after imidization.
Polarized light microscopy (no micrographs shown) was also used to characterize the orientation behavior of the polyimide films. The sequentially evaporated monomers 1 and 2 revealed, independently of evaporation sequence, a crystalline morphology on the entire substrate, which is clearly reduced after imidization due to desorption of monomers. Birefringence was observed at an angle of 45° (PTFE director to polarizer) for the sequential evaporation of diamine 3 first, then BPDA (1), which is slightly decreased after imidization.2 For the reversed evaporation sequence, only crystalline sectors were observed before and after imidization. By evaporating diamine 10 first and then dianhydride 6, the intensity of the birefringence on sectors Q1 to Q5 is slightly increased proportional to the step layer thickness. Another behavior is observed for the reversed evaporation sequence, where a maximum birefringence was noted for step 3 and a decrease in intensity was observed for higher step layer thickness. For both evaporation sequences, the films on top of neat glass surfaces were isotropic and non-oriented. After imidization, birefringence is clearly lower for all sectors due to evaporation of monomers during imidization. For polyimide films prepared by sequential evaporation of diamine 10 and dianhydride 6, a maximum of birefringence was always observed on sector Q3, meaning the monomer ratio seems to be optimal for this sector, where the thickest polyimide layer was also found. For the sequential evaporation of diamine 10 (first), perylene diamine 12 (second), and dianhydride 6 (third), an isotropic layer on the neat glass surfaces and a weak birefringence on the sectors with aligning surfaces were observed, which was slightly stronger after imidization.
 | ||
| Fig. 13 Design of combinatorial library Type 4 (76 × 75 mm) for the coevaporation of two monomers simultaneously. Besides a reference area (row T), a PTFE aligning surface on quartz glass (row U) and on Si-wafers (row V) is present. A shutter without a mask moving in five steps to the left creates a thickness step gradient. | ||
Characterization of the sectors was performed by mechanical thickness measurements, polarized light microscopy, as well as polarized FTIR and UV–vis spectroscopy. Layer thickness and the degree of orientation can be evaluated as a function of the chemical nature of the monomers during coevaporation. For coevaporated monomers 1 and 2, a layer thickness of 40 nm (T1), 80 nm (T2), 110 nm (T3), 140 nm (T4), and 180 nm (T5) was measured before imidization. The corresponding polyimide films revealed a slightly decreased layer thickness of 35 nm (T1), 70 nm (T2), 110 nm (T3), 145 nm (T4), and 175 nm (T5). Similar results were obtained by coevaporating monomer 1 with 3 and 6 with 10. In these cases, the observed small shrinkage during imidization is mainly caused by the loss of water during cyclization and, to a much lower extent as observed by the sequential experiments, by monomer desorption.
Different stages during the polycondensation and thermal imidization of coevaporated dianhydride 6 and diamine 10 were monitored by FTIR spectroscopy at different temperatures. The formation of the poly(amic acid) and the progressing imidization as a function of time and temperature have been documented.2
UV–vis spectroscopy of the coevaporated monomers BPDA (1) with naphthadine 2, 1 in combination with terphenyl (3), and dianhydride 6 with diamine 10, and their corresponding polyimides was also conducted. The investigations of the orientation behavior show that 1 plus 2 oriented only slightly and 1 plus 3 oriented with a DRUV of 2 before and after thermal imidization. A different behavior was observed for the coevaporation of monomers 6 and 10; here, only isotropic films on top of and next to PTFE aligning surfaces were observed.
To finally compare the DRUVs of all investigated monomers, monomer pairs, and resulting polymer layers on PTFE alignment layers a summary is given in a bar chart in Fig. 14. The plot shows that the degree of orientation remains low regardless of the monomer or monomer pairs deposited, except for monomer 3 and the sequential evaporation 3–1. Thus a high degree of orientation of both monomers, the dianhydride and the diamine, is absolutely necessary for the preparation of highly ordered polyimide films.
 | ||
| Fig. 14 Comparison of DRUVs of all investigated monomers, monomer pairs, and resulting polymers. The dichroic ratios are calculated at the corresponding absorption maxima at the optimized layer thickness. | ||
As a result, the coevaporation of two monomers is the preferable way to synthesize polyimide thin films as the desorption of monomer during thermal imidization is negligible. This is presumably due to the formation of CT complexes. Polyimide films prepared by sequential evaporation show much larger desorption and hence undesired shrinkage. It should be noted that the obtained thin polyimide films cannot be prepared by a standard solution polycondensation method due to the insolubility of the poly(amic acid)s and polyimides.
Conclusion
The combinatorial approach is an efficient way to investigate the complex interplay between the evaporation and orientation behavior of vapor deposited monomers before, during, and after thermal imidization. Aromatic rod-like monomers for polyimides were evaporated in a physical vapor deposition process on different aligning surfaces. As a substrate, a combination of three different types of aligning surfaces was used: friction-deposited layers of PTFE prepared under different conditions, surface oriented rubbed polyimide films, and bulk oriented polyimide layers. Also, different substrate materials, such as quartz glass and Si-wafers for UV–vis and FTIR spectroscopy, respectively, were employed. This combinatorial approach permits the study of the influence of several parameters, such as nature and composition of monomers, evaporation rate, layer thickness, aligning surface, and sequential or simultaneous deposition sequence in an evaporation experiment on combinatorial substrates. A shutter/mask setup rendering a five-step thickness gradient controls the thickness of each sector of the library. Aromatic dianhydrides and para-substituted diamines were used as monomers. The step thickness gradients of the libraries in the range of 20 to 530 nm were determined by mechanical measurements. Dianhydride BPDA showed high crystallinity independent of the aligning surface without any indication of orientation. Naphthidine also showed very poor orientation. On PTFE aligning surfaces, 4,4″-diamino-p-terphenyl showed a dichroic ratio of nine and ten, determined by polarized spectroscopy. However, the deposition of the monomers with even higher aspect ratios resulted in a rather low degree of orientation with a dichroic ratio around two, regardless of the aligning surface used. Based on these results, we conclude that rod-like aromatic monomers exhibit low mobility on aligning surfaces due to their stiffness and high molecular weight.Additionally, the formation of polyimides by sequentially and coevaporated monomers was investigated on combinatorial substrates. Polyimides were formed on each sector and during imidization, a layer shrinkage mainly caused by desorption of excess monomer was observed. In contrast, the shrinkage of coevaporated monomers after imidization was found to be negligible. The orientation behavior of coevaporated monomers on top of the PTFE aligning surfaces strongly depends on the molecular structure of the monomers. The reason might be the formation of monomer charge transfer complexes and reorientation during the thermally activated polycondensation step. A rather low dichroic ratio of about two was determined by polarized spectroscopy which was maintained after imidization.
Acknowledgements
This work was supported by the German Science Foundation (SFB 481), project A6.References
- M. Thelakkat, C. Schmitz, C. Neuber and H.-W. Schmidt, Macromol. Rapid Commun., 2004, 25, 204 CrossRef CAS.
- M. Baete, C. Neuber, R. Giesa and H.-W. Schmidt, Macromol. Rapid Commun., 2004, 25, 371 CrossRef.
- T. Miyamae, K. Tsukagoshi, O. Matsuoka, S. Yamamoto and H. Nozoye, Langmuir, 2001, 17, 8125 CrossRef CAS.
- M. Iijima, Y. Takahashi, K. Inagawa and A. Ito, Shinku, 1985, 28, 437 Search PubMed.
- J. R. Salem, F. O. Sequeda, J. Duran, W. Y. Lee and R. M. Yang, J. Vac. Sci. Technol., A, 1986, 4, 369 CrossRef CAS.
- C. C. Roberts, S. A. Letts, M. D. Saculla, E. J. Hsieh and R. C. Cook, Fusion Technol., 1999, 35, 138 Search PubMed.
- F.-Y. Tsai, E. L. Alfonso, D. R. Harding and S. H. Chen, J. Phys. D: Appl. Phys., 2001, 34, 3011 CrossRef CAS.
- J.-H. Jou, C.-L. Cheng, E. C.-L. Jou and A. C.-M. Yang, J. Polym. Sci., Part B: Polym. Phys., 1996, 34, 2239 CrossRef CAS.
- M. Iijima, Y. Takahashi, Y. Oishi, M. Kakimoto and Y. Imai, J. Polym. Sci., Part A: Polym. Chem., 1991, 29, 1723.
- Y. Y. Maruo, Y. Andoh and S. Sasaki, J. Vac. Sci. Technol., A, 1993, 11, 2590 CrossRef CAS.
- F.-Y. Tsai, D. R. Harding, S. H. Chen and T. N. Blanton, Polymer, 2003, 44, 995 CrossRef CAS.
- M. Grell and D. D. C. Bradley, Adv. Mater., 1999, 11, 895 CrossRef CAS.
- K. S. Whitehead, M. Grell, D. D. C. Bradley, M. Jandke and P. Strohriegl, Appl. Phys. Lett., 2000, 76, 2946 CrossRef CAS.
- F. C. Grozema, T. J. Savenije, M. J. W. Vermeulen, L. D. A. Siebbeles, J. M. Warman, A. Meisel, D. Neher, H.-G. Nothofer and U. Scherf, Adv. Mater., 2001, 13, 1627 CrossRef CAS.
- N. A. J. M. van Aerle and A. J. W. Tol, Macromolecules, 1994, 27, 6520 CrossRef CAS.
- Y. B. Kim and B. S. Ban, Liq. Cryst., 1999, 26, 1579 CrossRef CAS.
- A. Mosley, B. M. Nicholas and P. A. Gass, Displays, 1987, 8, 17 CrossRef CAS.
- J. M. Geary, J. W. Goodby, A. R. Kmetz and J. S. Patel, J. Appl. Phys., 1987, 62, 4100 CrossRef CAS.
- Y. B. Kim and B. S. Ban, Liq. Cryst., 1999, 26, 1579 CrossRef CAS.
- C. Neuber, R. Giesa and H.-W. Schmidt, Adv. Funct. Mater., 2003, 13, 387 CrossRef CAS.
- J. C. Wittmann, S. Meyer, P. Damman, M. Dosiere and H. W. Schmidt, Polymer, 1998, 39, 3545 CrossRef CAS.
- J. C. Wittmann and P. Smith, Nature, 1991, 352, 414 CrossRef CAS.
- R. E. Gill, G. Hadziioannou, P. Lang, F. Garnier and J. C. Wittmann, Adv. Mater., 1997, 9, 331 CrossRef CAS.
- P. Damman, M. Dosiere, M. Brunel and J. C. Wittmann, J. Am. Chem. Soc., 1997, 119, 4633 CrossRef CAS.
- A. Kubono, H. Higuchi, S. Umemoto and N. Okui, Thin Solid Films, 1993, 232, 256 CrossRef CAS.
- R. Giesa, U. Keller, P. Eiselt and H. W. Schmidt, J. Polym. Sci., Part A: Polym. Chem., 1993, 31, 141 CrossRef CAS.
- W. Volksen, Adv. Polym. Sci., 1994, 117, 111 CAS.
- S. Yoshida and A. S. Hay, Macromolecules, 1997, 30, 5979 CrossRef CAS.
- A. J. McKerrow, M. A. Fox, J. Leu and P. S. Ho, J. Polym. Sci., Part A: Polym. Chem., 1997, 35, 319 CrossRef CAS.
- K. H. Becker and H.-W. Schmidt, Macromolecules, 1992, 25, 6784 CrossRef CAS.
- A. Kubono and N. Okui, Prog. Polym. Sci., 1994, 19, 389 CrossRef CAS.
- M. Hesse, H. Meier and B. Zeeh, Spectroscopic Methods in Organic Chemistry, Georg Thieme Verlag, Stuttgart, New York, 1997 Search PubMed.
- L. B. A. Johansson and H. Langhals, Spectrochim. Acta, Part A, 1991, 47A, 857 CrossRef.
- T. Tanaka and M. Ishitobi, J. Phys. Chem. B, 2002, 106, 564 CrossRef CAS.
| This journal is © The Royal Society of Chemistry 2006 |