Forensic analysis of float glass using laser ablation inductively coupled plasma mass spectrometry (LA-ICP-MS): validation of a method†‡
Shirly
Berends-Montero
*a,
Wim
Wiarda
b,
Peter
de Joode
b and
Gerard
van der Peijl
*b
aHogeschool van Amsterdam, Weesperzijde 190, 1097DZ, Amsterdam, The Netherlands. E-mail: sberends.montero@gmail.com; Tel: +31 64 601 5927
bNetherlands Forensic Institute, PO Box 24044, 2490AA, The Hague, The Netherlands. E-mail: g.van.der.peijl@nfi.minjus.nl; Fax: +31 70 888 6556; Tel: +31 70 888 6245
First published on 27th September 2006
Abstract
The purpose of this study was to develop and validate a method for the forensic analysis of float-glass using laser ablation inductively coupled plasma mass spectrometry (LA-ICP-MS). The study was conducted in two parts. In the first part a procedure was developed and validated for the elemental analysis of float glass by LA-ICP-MS, for the comparison of fragments from a known source with the recovered fragments from a questioned source. The elemental menu comprises 10 elements: potassium (K), titanium (Ti), manganese (Mn), rubidium (Rb), strontium (Sr), zirconium (Zr), barium (Ba), lanthanum (La), cerium (Ce) and lead (Pb). It was shown that the method could be used for glass fragment sizes down to 1 mm2 with LODs in the order of μg g−1 and precision and accuracy <10% for most of the measured elements. In the second part the heterogeneity of some actual float glass panes was measured using the method developed in the first part. Based on these results matching criteria for overlapping of intervals defined by the concentration values ± twice the standard deviation were set for the forensic comparison of float glass samples.
1. Introduction
Characterization of a glass sample from its elemental composition has been well documented. Both classification and discrimination of glasses of the same type are possible in this way.1 A wide range of methods has been used for these purposes: among them are atomic absorption spectroscopy (AAS),2 spark source mass spectrometry,3 X-ray methods such as SEM-EDS/WDS,4 radiochemical methods such as neutron activation analysis (NAA)5 and ICP techniques such as atomic emission spectroscopy (ICP-AES) and mass spectrometry (ICP-MS).6–10 For forensic purposes, these techniques offer advantages and limitations that need to be considered when the analyst is confronted with the choice of the technique.6,7,11 Most criminal cases involve a comparison of samples. Therefore, techniques that render good discrimination6 (i.e. good precision) are very relevant. Procedures based on ICP techniques are fast, have multi-element capability, high sensitivity (ICP-MS being more sensitive than ICP-AES) and provide a large dynamic range. In addition, when using ICP-MS, isotopic information can be acquired, and if LA-ICP-MS is available, sample destruction is minimal. However, if LA-ICP-MS is chosen for the analysis then, depending on the system used, a possible modification of the refractive index of the glass should be taken into account.12 The method validated in the first part of this study is based on the use of LA-ICP-MS for analysis of float-glass samples.When comparing two samples for forensic purposes, one of the most important aspects is defining the appropriate “matching criteria” for the property being used in such a comparison. The matching criteria define how different the sample properties can be and yet be consistent with the samples originating from the same source (“to match”). These criteria depend on the homogeneity of the materials being compared as well as the precision of the method (or uncertainty) used for such a comparison. Glass is an ideal material for comparisons due to its internal homogeneity. However, although the manufacturers of float glass produce a very homogeneous material, small differences within (along and across) a glass pane can be measured by LA-ICP-MS and complicate interpretation of the results. The second part of this study was designed to determine the variations in elemental concentrations within a single pane of float glass. For a single pane (same source), the magnitude of variations due to the method and the material will be related to the “matching criteria”. By investigating a number of different glass panes from various sources we are able to define more general matching criteria to be used for forensic investigations of float glass in The Netherlands.
2. Experimental
2.1. Samples and standard materials
Several glass samples were used for our experiments, standard glass references as well as samples from ‘real life’ glass panes. All samples were washed in methanol, (reagent grade, Merck, Darmstadt, Germany) for 10 min, followed by HNO3 3% (diluted from reagent grade 65%, Merck, Darmstadt, Germany) for 30 min, rinsed with deionized water (>18 MΩ cm) and air dried before use.For the first part of the study the glasses used were glass references SRM NIST 610, 612, 614, 1830, 1831 (National Institute of Standards and Technology, Gaithersburg, MD, USA) and FGS 2 (Schott Glas, Germany, obtained through the network “Natural Isotopes and Trace Elements in Criminalistics and Environmental Forensics” NITE-CRIME).13 A wafer of SRM NIST 612 and a wafer of FGS 2 were used daily for checking the instrument performance. A second wafer of SRM NIST 612 and the other NIST standards were crushed with a pestle and a mortar protected with low density polyethylene bags (MiNiGRiP®, Putten, The Netherlands). Fragments of about 10–20 mm2 were embedded in cylindrical stubs of about 13 mm × 23 mm (height × diameter) using a two-component epoxy resin, Araldite® D (Vantico, Basel, Switzerland). The stubs were polished using resin bonded diamond disks and scaled diamond suspensions (Struers, Denmark) and a lapping/polishing machine Compact CL40 (Logitech, Denmark). One stub was prepared with six fragments of SRM NIST 612 (see Fig. 1). Two fragments, one from each of the glasses SRM NIST 612 and 1830, were included in another 47 stubs, and in 23 of those stubs was also included a fragment of glass from SRM NIST 1831. One last stub was prepared with single fragments of each of the glasses SRM NIST 610, 612 and 614.
 | ||
| Fig. 1 Locations of glass samples in the epoxy stub. | ||
The glass panes used for the second part of this study were obtained from three sources: a large glass pane from a Dutch distributor, two double windows obtained through a local supplier and a glass pane from a door of a convenience store. These float-glass samples were crushed first using a hammer following the schemes given below. The resulting large fragments were further crushed with a pestle and a mortar protected with polyethylene bags as before. Fragments of about 1–5 mm2 were fixed in a small tray with a numbered grid (see Fig. 2) by using double-sided transparent self-adhesive foil (Aslan® DK3, Overath, Germany).
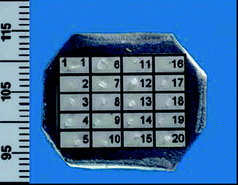 | ||
| Fig. 2 Tray with a numbered grid used for fixing small glass samples. The ruler minimum divisions are in mm. | ||
2.2. Instrumentation, typical parameters and method
The system used for most of this study was an ICP-MS ELAN® DRCplus (PerkinElmer, Wellesley, MA, USA) operating in standard mode and a laser ablation unit UP 213 nm aperture imaged Nd:YAG laser (New Wave™ Research, Freemont, CA, USA). For some measurements in Section 3.6 an ICP-MS Element 2 (ThermoElectron GmbH, Bremen, Germany) operating in medium resolution (4000 for 10% peak valley definition) was used in combination with a laser ablation unit such as the one described above. Instrumental parameters values are only fixed for the laser ablation systems since the ICP-MS systems need to be optimized on a day-to-day basis according to the protocol designed for its use.15 However, a representative set of values including those for the laser is shown in Table 1.| Parameter | Unit | LA-ICP-Q-MS | LA-ICP-SF-MS |
|---|---|---|---|
| a These parameters can vary depending on the optimization. | |||
| Ablation cell volume | cm3 | 30 | 30 |
| Crater diameter | μm | 60 | 60 |
| Repetition rate | Hz | 10 | 10 |
| Laser energy output | % | 90 | 90 |
| Energy density (energy) | J cm−2 (mJ) | 12 (0.4) | 95 (1.87) |
| Carrier gas | L min−1 He | 0.75a | Ar |
| Nebulizer gas flow | L min−1 Ar | 0.90a | 0. 973a |
| Auxiliary gas flow | L min−1 Ar | 0.90a | 0.85a |
| Plasma gas flow | L min−1 Ar | 15a | 15.8a |
| Rf power | W | 1200a | 1294a |
| Replicates | 1 | 1 | |
| Dwell time | ms | 10 | 10 |
| Settling time | ns | 200 | Variable |
| Scan mode | Peak hopping | ||
| Acquisition mode (output) | Transient signal | ||
The tuning was performed using SRM NIST 612 and FGS 2, according to our laboratory protocols for the use of the ICP-MS and LA-ICP-MS.14,15 The latter protocol sets the minimum sensitivity in counts per second per ppm (cps ppm) to 500 and 600 for the average signal of 139La and 29Si, respectively. In addition, the conditions listed in Table 1 reflected a doubly-charged ratio Ba2+/Ba+ and an oxide ratio CeO+/Ce+ less than 3% (measured on FGS 2).
The method originally comprised all of the following elements and isotopes (based on a glass round robin experiment of the NITE-CRIME Network13): 7Li, 11B, 23Na, 24Mg, 25Mg, 27Al, 28Si, 39K, 42Ca, 49Ti, 55Mn, 57Fe, 59Co, 65Cu, 66Zn, 71Ga, 75As, 85Rb, 88Sr, 90Zr, 93Nb, 118Sn, 123Sb, 133Cs, 137Ba, 139La, 140Ce, 147Sm, 151Eu, 159Tb, 165Ho, 169Tm, 175Lu, 178Hf, 181Ta, 182W, 197Au, 206+207+208Pb, 209Bi, 232Th, 238U. Later on in the method development this number was reduced.
The mass spectra for all samples were acquired as transient signals with 15 s of a gas blank followed by 25 s of ablation of the sample in a single spot mode (‘crater-drilling’). A pre-ablation step (ablating with the largest beam diameter for 5 s with no data acquisition) was included in the protocol for the analysis of small fragments. The analysis sequences included two spots of SRM NIST 612 at the beginning and two at the end as calibrators and drift correctors. It also included three other spots of SRM NIST 612 and three of SRM NIST 1830 as quality control checks. No more than 35 consecutive spots were measured in each sequence: if more samples were to be analyzed then another sequence was created. An example of an analysis sequence is in shown in Table 2.
| Spot | Sample | File name |
|---|---|---|
| 1 | SRM NIST 612 standard | 612#1 |
| 2 | SRM NIST 612 standard | 612#2 |
| 3 | SRM NIST 612 sample | 612#3 |
| 4 | SRM NIST 1830 sample | 1830#1 |
| 5 | Glass 1 | G1#1 |
| 6 | Glass 2 | G2#1 |
| 7 | Glass 3 | G3#1 |
| 8 | SRM NIST 612 sample | 612#4 |
| 9 | Glass 3 | G3#2 |
| 10 | Glass 2 | G2#2 |
| 11 | Glass 1 | G1#2 |
| 12 | SRM NIST 1830 sample | 1830#2 |
| 13 | Glass 2 | G2#3 |
| 14 | Glass 1 | G1#3 |
| 15 | Glass 3 | G3#3 |
| 16 | SRM NIST 612 sample | 612#5 |
| 17 | SRM NIST 1830 sample | 1830#3 |
| 18 | SRM NIST 612 standard | 612#6 |
| 19 | SRM NIST 612 standard | 612#7 |
2.3. Data processing
The GLITTER (McQuarie, Australia) software package was used to process the transient signals. SRM NIST 612 was used for the external calibration and drift correction and 29Si as internal standard. All the results obtained are elemental concentrations in μg g−1 in the glass samples. A personal computer equipped with SYSTAT (SPSS Corp., v10) and Excel 2003 (Microsoft Corp., v11.6113.5703) was used for all statistical analyses of the data. The descriptive statistics for the data (e.g., arithmetic mean 〈×〉, the standard deviation s and relative standard deviation rsd) and the graphs were produced using Excel, while the multiple pair comparisons (comparison of multiple means) and analysis of variance (ANOVA/MANOVA)16 calculations were performed using, from SYSTAT, the General Linear Model (GLM) with fixed mean squared error (MSE) and Tukey’s post hoc test.17–19For each set of samples described in Section 2.1, the comparison of means per location was performed by analyzing each element individually, since a difference in one element may be reported as a possible difference in the samples. Based on preliminary experiences,19 two sets of MSE values as used in the GLM model were chosen:
(a) the averaged squared standard deviation of the results per location 〈1s2〉 (default from the model);
(b) the average of the squares of double the standard deviation for these values 〈4s2〉.
The output of Tukey’s test included a matrix with the probabilities associated with the acceptance or rejection of the null hypothesis. When this probability was less than 0.05, the null hypothesis was rejected and the pair in question was considered distinguishable. Tukey’s approach for multi-comparisons minimized the rejection of a true hypothesis or Type I errors that would be generated if the multiple t-tests performed were not protected.17 The objective of this procedure was to obtain matching criteria related to the dispersion of the data, including the uncertainty of the measurement and the heterogeneity of the sample.
3. Results and discussion
3.1. Location in the ablation chamber
In order to determine how the location of the sample in the ablation chamber affected the concentration measured in the sample, the stub with six fragments of SRM NIST 612 was used (see Fig. 1). Each of the fragments was analyzed in triplicate using the method and menu described as the original menu in Section 2.2. Using MANOVA for the analysis of the data, it was determined that the within-the-sample variance (three replicates per location) was not significantly different (p > 0.05) from the between-the-sample variance (six different locations). The experiment was repeated twice with the fragments in different locations in the chamber by rotating the stub. The results once more showed no significant effect of the location in the ablation chamber on the concentrations measured.3.2. Ruggedness test
A ruggedness test on a wafer of SRM NIST 612 (according to the certificate a glass reference material with trace elements at a nominal 50 μg g−1 level and homogeneous to 5% precision and accuracy from target levels) was made following the standard guide ASTM E1169-8920 in order to evaluate the significance of the effect produced on the concentrations when the experimental parameters are varied slightly. A Plackett–Burman design of 8 experiments was used to evaluate such effects for a 95% confidence level. Four parameters were studied at two levels: frequency of the laser (8 and 12 Hz), energy output (90 and 100%), diameter of the beam (50 and 70 μm) and the nebulizer flow (0.96 and 1.00 L min−1). The changes in the levels of the factors were chosen to be relatively small, so that the ruggedness test has fewer interactions or unimportant ones compared with the main effects. The design was conducted in duplicate (morning and afternoon) and repeated on a different day to include potential day-to-day variation (four full designs in total).The ruggedness of the method was tested for all the elements and isotopes selected for the original menu given in Section 2.2. Each of the experiments comprised 6 different spots ablated at the conditions set for that particular experiment. The first, second and the sixth spot were used as standards and the third, fourth and fifth spots were used as samples. All the calculations used for this ruggedness test are the ones as described by the standard guide.20 For most of the elements the effects on the concentration when varying the parameters between the two levels are not significant (p > 0.05). This result was observed except for the element Zn, which was significantly affected by the variation of the frequency in three of the combinations studied (comparison of morning/afternoon on two different days and comparison of two dates in morning data). In general, the effects were very small and similar to the variation obtained from the three spots in the same experiment (within the sample variation). If the confidence level is set to 99% (p > 0.01), then the influence on the elemental concentrations of the variation of the parameters studied in this ruggedness test is insignificant.
3.3. Elemental menu
The elements on our final menu were first selected on the basis of accuracy (|relative bias| < 10%) and precision (|relative standard deviation| < 10%) using SRM NIST 612. Then the menu was refined based on the power of the element for the discrimination of float glasses, as reported previously in solution analysis.10 Two considerations were taken into account: the first is that in float glasses most of the elements in the original menu are in concentrations lower than the limit of detection; and the second is that our analysis is performed after a matching is obtained by comparisons of the refractive indices. The selected isotopes were 39K, 49Ti, 55Mn, 85Rb, 88Sr, 90Zr, 137Ba, 139La, 140Ce and 206+207+208Pb (or sumPb). The authors are aware of the natural correlation between La and Ce, however Ce may be added intentionally by the manufacturer as a decolorizing agent. In addition, 118Sn was included to check independently that in the case of float glass samples the ablated side is not the float side.3.4. Limits of detection
The actual detection limits of the method depend on the operational conditions of the instrument. However, the values presented in Table 3 were used as reference values since they were obtained as the average of several sets of conditions used in different days. The values were calculated by Glitter as three times the standard deviation of the noise (gas blank) measured while the laser was firing but not ablating the sample (shutter closed). The limits of quantification were calculated as ten times the standard deviation of the noise.| Element | Limit of detection LOD/μg g−1 | Limit of quantification LOQ/μg g−1 |
|---|---|---|
| K | 15 | 50 |
| Ti | 17 | 57 |
| Mn | 3 | 10 |
| Rb | 1 | 3 |
| Sr | 0.2 | 0.7 |
| Zr | 0.4 | 1.3 |
| Ba | 2 | 7 |
| La | 0.2 | 0.7 |
| Ce | 0.2 | 0.7 |
| Pb | 1.5 | 5 |
3.5. Linearity
There are only a small number of glass standards that are certified for the elements of interest at trace levels. This section only considered the SRMs 614, 612 and 610 from NIST. Whenever the concentrations were not certified, the values used were obtained from concentrations reported in the literature.19,21 As an example, in Table 4 data are shown for Sr using the Si concentration as an internal standard (∼34 × 104 μg g−1 Si for all samples discussed in this article9,19). For all elements with more than two reported concentrations, linear regression correlation coefficients, r2, were larger than 0.999 for up to the concentrations in SRM NIST 610 (∼500 μg g−1).| Glass, SRM NIST | Sr/Si | Sr/Si standard deviation, s | Sr/Si uncertaintya | [Sr]/μg g−1b | [Sr] uncertaintyb/μg g−1 |
|---|---|---|---|---|---|
| a Calculated as the 95% confidence value ts/n½ or in this case 2.5 s. b Certified by NIST. | |||||
| 614 | 0.022 | 0.000![[hair space]](https://www.rsc.org/images/entities/char_200a.gif) 08 08 |
0.0002 | 45.8 | 0.1 |
| 612 | 0.041 | 0.00066 |
0.0016 | 78.4 | 0.2 |
| 610 | 0.281 | 0.00044 |
0.0011 | 497.4 | 0.5 |
3.6. Selectivity
Because of the nature of the technique, the selectivity should require the preparation of solid glass standards with only the elements of interest. There was no such validated standard at the time of this study. However, in order to check for performance under spectral and polyatomic interferences, a high-resolution instrument was used to measure SRM NIST 612 for all elements except Rb (Rb became part of the menu at a later time). The results can be compared in Table 5 with those measured with a quadrupole ICP-MS. These biases are less than the 10% limit defined when designing the method and therefore they were accepted.| Element | LA-ICP-Q-MS/μg g−1 | LA-ICP-SF-MS/μg g−1 | Difference (%) |
|---|---|---|---|
| K | 70.9 | 69.9 | 1.5 |
| Ti | 50.2 | 47.7 | 5.3 |
| Mn | 40.4 | 37.9 | 6.6 |
| Sr | 80.8 | 76.4 | 5.7 |
| Zr | 37.8 | 37.1 | 1.8 |
| Ba | 41.1 | 37.6 | 9.3 |
| La | 38.6 | 36.3 | 6.3 |
| Ce | 41.4 | 38.2 | 8.4 |
| Pb | 42.5 | 38.6 | 10 |
3.7. Single laboratory precision and bias study
The terms of repeatability, reproducibility and bias used below are those defined by the standard practice ASTM E 177-90a22 and the standard ASTM E 456-96.23 Since there were no between laboratory measurements, the repeatability and reproducibility of the test method could not be calculated. However, using the 47 stubs, with the results presented below, estimates of within-laboratory precision can be made (uncertainty of the measurement and heterogeneity of the material) according to the standard practice ASTM E 177-90a.Each stub was measured using a separate sequence. The measurements of the SRM NIST 612 were composed of 5 different spots, ablated under the conditions set by the protocol.14 The first, second and the fifth spots were used as calibration standards for the sequence and the third and fourth spots were used as samples. For the SRM NIST 1830 samples (and 1831 if present in the stub) three spots were ablated in each stub. The within-laboratory precision, as defined in Section 23.1.2 of the standard practice ASTM E 177-90a, can then be determined using the values obtained for each of the reference glasses measured in different sequences (several per day), on different days and by different operators. The averages of the concentrations obtained are listed in Table 6. The variation in the measured concentrations of Ti is shown in Fig. 3.
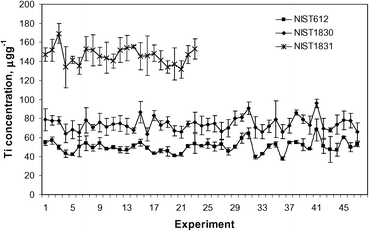 | ||
| Fig. 3 Variation in the concentration of Ti over time for SRM NIST 612, 1830 and 1831. | ||
| SRM NIST 1830 (n = 47) | SRM NIST 1831 (n = 23) | SRM NIST 612 (n = 47) | |||||||
|---|---|---|---|---|---|---|---|---|---|
| Element | Average | Rsd (%) | Biasa (%) | Average | Rsd (%) | Biasa (%) | Average | Rsd (%) | Biasa (%) |
| a Bias calculation based on reported values.9 b Above limit of detection but below limit of quantification. c Below limit of detection. d 36 replicates were below limit of detection and 11 below limit of quantification. | |||||||||
| K | 301.2 | 7.8 | 0.4 | 3005 | 10 | 11 | 70.9 | 7.6 | 7.0 |
| Ti | 74.2 | 9.5 | 12 | 146.1 | 6.0 | 33 | 50.2b | 12 | 4.3 |
| Mn | 10.1 | 6.3 | 13.6 | 6.3 | −9.4 | 40.4 | 4.6 | 5.1 | |
| Rb | <1c | 6.4 | 5.7 | 0.3 | 33.9 | 6.1 | 7.3 | ||
| Sr | 52.0 | 5.1 | 96.2 | 6.0 | 7.9 | 80.8 | 4.1 | 3.1 | |
| Zr | 83.4 | 5.4 | 43.6 | 9.4 | 0.02 | 37.8 | 4.5 | 4.9 | |
| Ba | 12.1 | 8.5 | 33.4 | 7.0 | 5.9 | 41.1 | 5.9 | 9.0 | |
| La | 1.6 | 8.1 | 2.6 | 6.3 | 10 | 38.6 | 5.7 | 7.9 | |
| Ce | 2.7 | 9.5 | 4.9 | 7.2 | 8.0 | 41.4 | 5.5 | 8.0 | |
| Pb | <1.5d | 2.2 | 1.9b | 11 | −4.3 | 42.5 | 7.5 | 9.1 | |
From Table 6 it can be seen that the variation in the concentrations measured (rsd,%) is mostly<10%. Exceptions are some measurement results that are above the detection limits but below the quantitation limits, such as Pb with all 23 replicates for SRM NIST 1831 and Ti with 43 replicates for SRM NIST 612. The values presented in Table 6 are accepted under our target (limits) variations of the method. With the measurements reported here, only the within-laboratory variation is considered.
Only a few values are available in the literature for the trace elemental concentrations in glasses SRM NIST 1830 and 1831.13,19 The biases measured for the specific elemental concentrations in the different glasses are also listed in Table 6. The large bias in the concentrations of Ti for SRM NIST 1830 and 1831 may be partly due to the use of SRM NIST 612 as a calibrator since its value is close to the limit of quantification (57 μg g−1) and partly to a possible incorrect reference value used by Glitter for SRM NIST 612, as discussed elsewhere.13 The last three columns contain the data for SRM NIST 612 measured as samples. It is shown here to illustrate the repeatability of the procedure and software once the calibration is made. When the concentrations of FGS02 are available (certified), this glass reference material can be used as a calibrator and to evaluate the bias on the SRM NIST 612 measurements.
 | ||
| Fig. 4 Comparison of results using samples of SRM NIST 612 of different sizes (3 replicates each except reported values). | ||
The reported values were also added in the plot for accuracy evaluation. In addition to the comparison of intervals defined by 1s (plots), the results were compared using ANOVA as mentioned in Section 2.3. Both methods for comparison of data support that there are no significant differences of the means for the different sizes for all the elements included in the method. However, precision of the results was best for the embedded samples for most elements (1.4–5.5% rsd) compared with the small fragment (6.8–14% rsd). In order to evaluate the effect of sample size and preparation on our target glass class, the study included also SRM NIST 1830 (float glass). The results shown in Fig. 5 include samples of 1830 embedded in epoxy stubs (47) and polished, as well as 2 sets of smaller fragments (∼1 mm2). The data for K, Ti, Sr and Zr were divided by a factor (25, 10, 10 and 10, respectively) to include all the isotopes in one single plot with a convenient concentration scale. As for the SRM NIST 612 glass, the results from small fragments of float glass SRM NIST 1830 following the method described in Section 2.1 lead to results that do not differ significantly from the results obtained for fragments embedded in epoxy stubs. However, the spread of the data was not compared directly since for the 47 stubs (higher number of replicates) the results presented were obtained on different days and by different operators, while the smaller fragments were analyzed in triplicate within one day by the same operator.
 | ||
| Fig. 5 Comparison of results using samples of SRM NIST 1830 (float glass) of different sizes (3 replicates for the fragments and 47 replicates for the stubs). | ||
We find that embedding of the glass samples and polishing is the method of choice for sample preparation since it provides higher precision of the LA-ICP-MS results. However, if the fragments are too small for this method, the sample preparation method described in Section 2.1 appears to be a good alternative method with results that do not significantly differ from the results obtained using the larger samples.
 | ||
| Fig. 6 Concentrations of titanium (Ti) and rubidium (Rb) in μg g−1 in a single pane with the error bars set equal to (a) 1s and (b) 2s. | ||
Upon inspection of the data, there was no clear correlation between the position of the analysis on the pane and the elemental concentrations (e.g., there was not a consistent increase of an elemental concentration along the length of the pane, going from H1 to H5). Based on these results, we estimated that the variation measured over the glass pane will be contained in an interval defined by two standard deviations (2s) around the mean and that the “matching criterion” for this experiment and this specific sample should be set as ±2s.
 | ||
| Fig. 7 Concentrations of titanium (Ti) and rubidium (Rb) in μg g−1 in 4 panes from 2 double windows. (Error bars equal to 1 standard deviation.) | ||
 | ||
| Fig. 8 Concentrations of titanium (Ti) and rubidium (Rb) in μg g−1 at 18 locations of a store window. (Error bars equal to 1 standard deviation.) | ||
3.8. Uncertainty statement
Summarizing the results obtained in the previous sections, individual concentrations will be reported considering a coefficient of variation in percent concentration of ± t/n½ times the standard deviations. That is, for triplicates and a 95% confidence level, the concentration will be given as the mean of the replicates ±2.5 s. If the objective is to compare samples analyzed within a small time frame (same day), then it was demonstrated that variations in the results due to the precision of the method and the heterogeneity of the sample could be expressed as twice the standard deviation. The reader should notice that this criterion is larger than an actual t-test. For our purposes, discrimination will be defined as the absence of an overlap of intervals defined for each sample as the mean of replicates ±2s.3.9. Matching criteria
When defining appropriate matching criterion for the comparison of two glass samples for forensic purposes, there is always the balance between defining criteria that are too small, increasing the chance of a false exclusion (Type I), or too large and therefore increasing the chance of a false inclusion (Type II error). Both errors may have serious consequences associated with them. The measurable variation of elemental concentrations within glass panes means that for an optimal forensic investigation more information is required on what happened during the breaking of the window, e.g., was a single or double window broken, what was the size of the window and the size of the hole? More detailed information should also be collected on the elemental variation around the broken portion of the pane and, if this is not possible, then by collecting and measuring a wider interval of glass fragments from the broken pane (e.g., retrieved from the window frame). If a large sample representative of the entire pane is available, then a rigorous statistical comparison method such as the t-test (or successive t-tests) should be used.24 In the absence of the information about the elemental concentration variation within the entire pane, as is often the case in real casework samples, it appears reasonable to use initially (until tested in determining between sample variations) a variation of ±2s around the mean as a matching criterion in order to include the heterogeneity measured within a single pane.4. Conclusions and recommendations
A method based on the LA-ICP-MS technique was developed and validated for the forensic investigation of float glass samples. The validation was done through the quality characterization of the method, such as ruggedness, limits of detection, selectivity, linearity, precision and bias. Then the method was used to analyze three different sets of common float glass. With a technique with high lateral and depth resolution, such as LA-ICP-MS,25 small differences in the elemental composition within—along and across—a glass pane can be measured. It was found that the variation within a single pane of float glass was measurable for some elements by the method validated here if a comparison method such as a t-test (95% confidence level) was used. That is, the results obtained by this method could erroneously be interpreted as different sources of glass if the measured variation within a single pane of float glass is not taken into account.With the 2s criterion no Type I errors were observed when studying the three sample sets described in Sections 2.1.1, 2.1.2 and 2.1.3. This matching criterion applies for every element for all pairs of samples compared. Special care was taken to ensure that the standard deviations were always under control (≤10%, usually ≤5%). Further studies will be appropriate for the estimation of correlations of element pairs and the evaluation of errors of Type I and II when these criteria are used. However, this is an iterative process only possible by the accumulation of data through the analysis of samples known to originate from different sources and interpreting the results with the current accepted matching criteria (supervised comparison). The authors are aware of alternative methods for analysis of data.26 Additional data analysis with adequate (e.g., number of replicates appropriate for the degrees of freedom needed) supervised and unsupervised multivariate methods and likelihood ratios are not only recommended but are currently being evaluated for the selection of the optimal method of comparison of the elemental profiles obtained using this method of analysis. For the moment, the experience accumulated in casework allows for the confident use of the matching criteria proposed here as derived from the results of the three different sets.
Finally, we propose to define guidelines on how to report the results of the comparisons. These guidelines are proposed based on the results so far observed when using the method validated here for the analysis of casework samples. Currently, in our institute, we define possible hypotheses of occurrence that are pairwise-compared. These hypotheses consider the protocol followed at the NFI for the analysis of glass evidence where the refractive indices are measured. When an association of the glass samples has been established by refractive index, the elemental composition of the samples is measured. The hypotheses are as follows.
1. The samples originate from the same pane (window).
2. The samples originate from different panes but the same manufacturer and any correspondences in observed results are based on chance.
3. The samples originate from different panes and different manufacturers but they are the same type of glass: any correspondences in observed results are based on chance.
4. The samples originate from different panes and different manufacturers of different classes of glass (comparison with the rest of the world glass population): any correspondences in observed results are based on chance.
Our current experience using the method validated here indicate to us that it is common to observe concentrations of Pb below the detection limit and variations in Zr larger than the 2s interval for samples from the same source. Therefore, if the elemental profiles of the glass samples examined are distinguishable (the concentration intervals do not overlap for at least two elements), then one can state that there is evidence favouring hypothesis two, three and four over one. However, when the elemental profiles are indistinguishable (the concentration intervals overlap for at least 9 of the 10 elements), we have a “match”. Then, based on literature values19 and the experience gained so far within the NFI, the authors feel confident to report that the weight of the evidence favouring hypothesis one over hypothesis two is weak, but it is strong (very strong if 10 elements overlap) favouring hypothesis one over three and very strong (extremely strong if 10 elements overlap) favouring hypothesis one over four. The scale used here attempts to give a verbal equivalency to the strength of evidence in the way it has done before for likelihood ratios.27 These terms, although arbitrary, are effective if the order of the complete scale is given. In this case, the weight scale used above is in increasing order: weak, strong, very strong and extremely strong. The NFI has been formally accredited for this forensic method by the Dutch Accreditation Council since May 2005.
Acknowledgements
We thank Dr M. J. Sjerps for her valuable insights into the statistical aspects of this research. Fruitful discussions on the value of glass trace evidence were made with ir. M. L. Hordijk, ing. L. H. J. Koomen, Dr J. A. de Koeijer and Dr A. J. J. van Es.References
- (a) D. A. Hickman, Forensic Sci. Int., 1981, 17, 265–81 CrossRef CAS; (b) S. Ryland, J. Forensic Sci., 1986, 31, 1314–29 CAS; (c) D. A. Hickman, Forensic Sci. Int., 1987, 33, 23–46 CrossRef; (d) R. D. Koons, C. Fiedler and R. C. Rawalt, J. Forensic Sci., 1988, 33, 49–67 CAS; (e) D. A. Hickman, Anal. Chem., 1984, 56, 844–52A CrossRef.
- (a) J. C. Hughes, T. Catterick and G. Southeard, Forensic Sci. Int., 1976, 8, 217–27 CrossRef CAS; (b) T. Catterick and C. D. Wall, Talanta, 1978, 25, 573–7 CrossRef CAS; (c) D. A. Hickman, G. Harbottle and E. V. Sayre, Forensic Sci. Int., 1983, 23, 189–212 CrossRef CAS.
- M. Haney, J. Forensic Sci., 1977, 22, 534–44 Search PubMed.
- (a) B. Reeve, J. Mathiesen and W. Fong, J. Forensic Sci., 1976, 21, 291–306 Search PubMed; (b) J. Andrasko and A. Maehly, J. Forensic Sci., 1978, 22, 250–62 Search PubMed.
- (a) R. F. Coleman and G. C. Goode, J. Radioanal. Chem., 1973, 15, 367–88 Search PubMed; (b) S. J. Pitts and B. Kratochvil, J. Forensic Sci., 1991, 36, 122–37.
- J. Buscaglia, Anal. Chim. Acta, 1994, 288, 17–24 CrossRef CAS.
- J. R. Almirall, in Mute Witness. When Trace Evidence Makes the Case, ed. M. Houck, Academic Press, San Diego, 2001, pp. 139–155 Search PubMed.
- (a) A. Zurhaar and L. Mullings, J. Anal. At. Spectrom., 1990, 5, 611–7 RSC; (b) T. Parouchais, I. M. Warner, L. T. Palmer and H. Kobus, J. Forensic Sci., 1996, 41, 351–60 CAS; (c) Y. Suzuki, R. Sugita, S. Suzuki and T. Kishi, Proceedings of the American Academy of Forensic Sciences Meeting, New York, 1997 Search PubMed; (d) Y. Suzuki, R. Sugita, S. Suzuki and Y. Marumo, Anal. Sci., 2000, 16, 1195–8 CAS; (e) D. C. Duckworth, C. K. Bayne, S. J. Morton and J. R. Almirall, J. Anal. At. Spectrom., 2000, 15, 821–8 RSC; (f) A. J. G. Mank and P. R. D. Mason, J. Anal. At. Spectrom., 1999, 14, 1143–53 RSC.
- N. J. G. Pearce, W. T. Perkins, J. A. Westgate, M. P. Gorton, S. E. Jackson, C. R. Neal and S. P. Chenery, Geostand. Newsl., 1997, 21, 115–146 CrossRef CAS.
- D. C. Duckworth, S. J. Morton, C. K. Bayne, R. D. Koons, S. Montero and J. R. Almirall, J. Anal. At. Spectrom., 2002, 17, 662–8 RSC.
- J. M. Curran, T. N. Hicks and J. S. Buckleton, Forensic Interpretation of Glass Evidence, CRC Press, Boca Raton, 2000 Search PubMed.
- (a) S. A. Slattery, D. N. Nikogosyan and G. Brambilla, J. Opt. Soc. Am. B, 2005, 22, 354–61 Search PubMed; (b) S. Theppakuttai and S. Chen, J. Appl. Phys., 2004, 95, 5049–52 CrossRef CAS; (c) Y. Shimotsuma, P. G. Kazansky, J. Qiu and K. Hirao, Phys. Rev. Lett., 2003, 91, 247–405; (d) E. Bricchi, B. Klappauf and P. G. Kazansky, Opt. Lett., 2004, 29, 119–21 CrossRef.
- C. Latkoczy, M. Dücking, S. Becker, D. Günther, J. Hoogewerff, J. Almirall, J. Buscaglia, A. Dobney, R. Koons, S. Montero, G. J. Q. van der Peijl, W. Stoecklein, T. Trejos, J. Watling and V. Zdanowicz, J. Forensic Sci., 2005, 50, 1327–41 CAS.
- NFI SOP document 222104. “Kwantitatieve bepaling van elementen in glasfragmenten met behulp van LA-ICP-MS (werkvoorschrift)”. Quantitative determination of elements in glass fragments using LA-ICP-MS.
- NFI SOP document 222103. “Bediening van de ICP-MS ELAN 6100 DRCPLUS. (handleiding)”. Operation of the ICP-MS ELAN 6100 DRCPLUS.
- (a) J. C. Miller and J. N. Miller, Statistics for Analytical Chemistry, 3rd edn., Prentice Hall, West Sussex, 1993, p. 233 Search PubMed; (b) W. Mendenhall, Introduction to Probability and Statistics, 3rd edn., Duxbury, Belmont, 1971, p. 466 Search PubMed.
- T. W. Anderson and S. L. Sclove, Introductory Statistical Analysis, Houghton-Mifflin, Boston, 1974, p. 499 Search PubMed.
- D. G. Kleinbaum and L. L. Kupper, Applied Regression Analysis and Other Multivariable Methods, Duxbury, California, 1978, p. 556 Search PubMed.
- S. Montero, PhD Dissertation, Florida International University, Miami, 2002.
- American Society for Testing and Materials, in American Society for Testing and Materials. Annual Book of ASTM Standards, ASTM, West Conshohocken, 2001, vol. 14.04, pp. 397–402 Search PubMed.
- P. J. Sylvester and S. M. Eggins, Geostand. Newsl., 1997, 21, 215–229 CrossRef CAS.
- American Society for Testing and Materials, in American Society for Testing and Materials. Annual Book of ASTM Standards, ASTM, West Conshohocken, 2001, vol. 14.04, p. 200–21 Search PubMed.
- American Society for Testing and Materials, in American Society for Testing and Materials. Annual Book of ASTM Standards, ASTM, West Conshohocken, 2001, vol. 14.04, p. 132–9 Search PubMed.
- Committee on Scientific Assessment of Bullet Lead Elemental Composition Comparison, National Research Council, Forensic Analysis: Weighing Bullet Lead Evidence, National Academies Press, online version, 2004, pp. 26–70 Search PubMed.
- M. Bi, A. M. Ruiz, I. Gornushkin, B. W. Smith and J. D. Winefordner, Appl. Surf. Sci., 2000, 158, 197–204 CrossRef CAS.
- (a) C. G. G. Aitken and D. Lucy, Appl. Stat., 2004, 53, 109–22 Search PubMed; (b) C. G. G. Aitken, D. Lucy, G. Zadora and J. M. Curran, Comput. Stat. Data Anal., 2006, 50, 2571–88 Search PubMed; (c) C. G. G. Aitken and F. Taroni, Statistics and the evaluation of evidence for forensic scientists, Wiley, Chichester, 2nd edn., 2004, pp. 359–379 Search PubMed.
- D. Lucy, Introduction to statistics for forensic scientists, Wiley, Chichester, 2005, pp. 133–135 Search PubMed.
Footnotes |
| † Electronic supplementary information (ESI) available: sampling schemes for single glass pane, double window and store window, measuring schemes for sections 2.1.1 and 2.1.3, Placket-Burman design for 3.2, significance for effects in set A and Ti concentrations for single glass pane. See DOI: 10.1039/b606109e |
| ‡ The HTML version of this article has been enhanced with colour images. |
| This journal is © The Royal Society of Chemistry 2006 |