Preparation and characterization of ZnO nanoparticles coated paper and its antibacterial activity study
Kalyani
Ghule
,
Anil Vithal
Ghule
,
Bo-Jung
Chen
and
Yong-Chien
Ling
*
Department of Chemistry, National Tsing Hua University, Hsinchu, 30013, Taiwan. E-mail: ycling@mx.nthu.edu.tw; Fax: +886-35711082; Tel: +886-35721484
First published on 15th September 2006
Abstract
Coating of ZnO nanoparticles on paper surface has potential technological applications. With this motivation, a simple approach of ultrasound assisted coating of paper with ZnO nanoparticles (∼20 nm) without the aid of binder is reported for the first time in this work. The ultrasound assisted coating approach concurs with “green” chemistry as it is simple and environmentally friendly. Scanning electron microscope is used to characterize the surface morphology showing ZnO nanoparticles bound to cellulose fibers. Further characterization of coated surface is performed by attenuated total reflectance-Fourier transform infrared, X-ray diffraction, and time-of-flight secondary ion mass spectrometry in positive ion detection mode along with its imaging capability. The effect of ultrasound irradiation time on ZnO nanoparticles loading is estimated by thermogravimetric analysis. A plausible coating mechanism is proposed. The ZnO nanoparticles coated paper is found to possess antibacterial activity against Escherichia coli 11634.
Introduction
ZnO is considered as workhorse of technological development exhibiting excellent electrical, optical, and chemical properties with broad range of applications as semiconductors, in optical devices, piezoelectric devices, surface acoustic wave devices, sensors, transparent electrodes, solar cells, antibacterial activity etc.1–15 Extensive work on synthesis of ZnO nanoparticles and nanostructures using physical and wet chemical methods has been reported since last decade, with regards to controlling the morphology and properties based on the applications.1–9 Thin films or nanoscale coating of ZnO nanoparticles on suitable substrates is also important for its potential applications as substrates for functional coatings, printing, UV inks, e-print, optical communications (security-papers), protection, barriers, portable energy, sensors, photocatalytic wallpaper with antibacterial activity etc.8,10–12,14–24 Various methods like chemical, thermal, spin coating, spray pyrolysis, pulsed laser deposition etc. have been developed to coat ZnO nanoparticles in form of thin films on solid supports such as metal, metal oxides, glass or thermally stable substrates.17–19,23–26 However, coatings of ZnO nanoparticles on thermolabile surfaces are scarce27 and coating on paper is yet to be reported. Coatings with biomolecules, oil, pigments (calcium carbonate, clay, talc, silicates, TiO2, etc.), polymers, plastics etc. has been reported with the help of suitable binders and co-binders.28 However, less attention is paid to ZnO nanomaterials as coatings, in spite of its known technological applications. To the best of our knowledge only one report on low temperature growth of ZnO nanorods on cotton fabric exists.27It is well known that purity of ZnO is important for its application,7–9 demanding extreme thermal treatment after its synthesis or coating.29,30 This is with the intension of reducing or eliminating the organic species adsorbed on the surface of ZnO, which are inevitable irrespective of the methods (physical or chemical) used for synthesis of ZnO nanoparticles. Furthermore, employing extreme heat treatment process after coating of ZnO particles on the paper surface is detrimental. For this reason, use of preformed heat-treated ZnO nanoparticles for coating on thermolabile substrates is desirable, although ZnO nanoparticles could be formed/grown on the substrate.27
On the other hand, choice of paper coating technique is an important consideration. Coating techniques (off-machine and machine) like dip, brush, mechanical blade or bench coater, rolling, air brush, curtain, spin coating, spray, extruded, print, cast, strip coaters etc., have been used for coating the paper surfaces since decades.31–33 However, some of these techniques, especially contact mechanical techniques cause web break, surface defects, variable layer (thickness and composition), consume more material by filling fiber interstices, need excess solvent (water), energy etc. and affect surface properties, gloss and brightness.31 Non-impact spray based techniques are generally preferred as these avoid web breaks and streak defects, and have certain advantages in terms of durability and surface quality.34 But, these are costly, require maintenance, consume more solvent medium to maintain viscosity and spray quality. Thus, improved techniques compatible with coating on nanoscale and consuming less material are required. Furthermore, with increased emphasis on “green” chemistry, interest has been developed towards adoption and implementation of sustainable processes by minimizing the use of toxic chemicals, solvents, energy etc.35–37 Thus, development of a nonimpact coating technique on the verge of “green” chemistry and nanoscience, revitalizing the progress through nanostructuring is crucial.
Recently, sonochemical processing has proven to be a useful technique in synthesis of nanomaterials and coating metal or metal oxide nanoparticles on suitable substrate. The chemical effects of ultrasound arise from acoustic cavitation phenomena, that is, the formation, growth, and implosive collapse of bubbles in a liquid medium. These unusual chemical and physical environments are generally utilized in sonochemical processing. Although, sonochemistry has been exploited in industries38 and in fabrication of nanomaterials,39 its application in coating nanoparticles to paper surface is yet to be reported.
In this work, a simple, green, and cost-effective ultrasound assisted coating of ZnO nanoparticles on paper surface without the aid of binders is reported. The paper surface coated with ZnO nanoparticles is characterized using scanning electron microscope (SEM), X-ray diffraction (XRD), and attenuated total reflectance-Fourier transform infrared (ATR-FTIR). Loading of ZnO nanoparticles on the paper surface is estimated from the thermogravimetric analysis (TGA). Furthermore, time-of-flight secondary ion mass spectrometry (TOF-SIMS) is used to characterize the surface composition of the coated surface, binding sites of the nanoparticles, and distribution of the coated ZnO nanoparticles. A plausible coating mechanism is proposed. The ZnO nanoparticles coated paper was further tested for antibacterial activity using Escherichia coli 11634.
Experimental
ZnO nanoparticles (average diameter ∼20 nm) were procured from Echo Chemicals, Taiwan. Prior to their use in experiments, the nanoparticles were heated to 450 °C to remove organic contaminants. Further, the ZnO nanoparticles were characterized using transmission electron microscope (TEM) (Philips, Tecnai 20, 200 kV) with inbuilt energy dispersive X-ray analysis (EDS).In typical experiments for coating ZnO nanoparticles on the paper surface: 2 g of ZnO nanoparticles were dispersed in 200 mL of deionized (DI) water using a fixed power sonicator (L&R Ultrasonics, Quantrex 140, 150 W, 45 kHz) for 10 min. This was followed by drop wise addition of NH4OH till a pH of 8 was achieved to be in accord with the alkalinity of the paper and sonicated for additional 10 min prior to the experiments. Use of NH3 is also acceptable. The paper surface to be coated (white paper, YFY Papers, Taiwan) was attached face down to the substrate, and the position was set such that the paper surface just touched the dispersed solution. The sonication time (5, 10, 15, 20, 25, and 30 min) was varied in each experiment. Thereafter the coated paper was detached and dried at 80 °C prior to characterization.
Surface morphology and elemental composition was characterized using SEM (Hitachi-S4700) with inbuilt EDS. TGA analyzer (Perkin Elmer TGA6) was used to record the thermograms in the temperature range from 30 to 500 °C with a heating rate of 5 °C min−1 in a flow of air at 20 mL min−1. XRD patterns were obtained using Material Analysis and Characterization (MAC) advanced powder X-ray diffracto-meter (using Cu Kα = 1.54056 Å radiation). ATR-FTIR spectra of blank paper and ZnO nanoparticles coated paper were recorded using Perkin Elmer (System 2000 FTIR). Samples (ZnO nanoparticles before and after treating with NH4OH) pressed into KBr pellets were used to record FT-IR spectra (Bomem Hartmann & Braun, MB-series).
Positive TOF-SIMS (ION-TOF; Munich, Germany) measurements were performed for the analysis of blank paper and ZnO nanoparticles coated paper. The paper samples were carefully cut into 1 × 1 cm2 pieces and pressed onto the carbon tape supported on a clean Si wafer. The primary ions source was a pulsed 69Ga+ source (pulsing current 2.5 pA, and a pulse width of 30 ns) operated at 15 keV with post-acceleration of 10 kV. The analysis area of 150 µm × 150 µm, data acquisition time of 200 s, and charge compensation by applying low-energy electrons (∼30 eV) from a pulsed flood gun were used for the measurements. The pressure of the main chamber was kept between 10−8 and 10−9 Torr. The best resolution obtained was m/Δm = 5000. Calibration of the mass spectra was based on the peaks such as H+ (1.007 m/z), CH3+ (15.024 m/z), C2H5+ (29.044 m/z), Na+ (22.989 m/z), and Ca+ (39.959 m/z). The peak areas were normalized to the most intense peak in the spectrum. The generated data was processed using IonSpec software and the ion images were obtained using inbuilt Ionimage software.
Antibacterial activity of the ZnO nanoparticles coated paper and the blank controls (white cotton and blank uncoated paper) were investigated using the Japanese Industrial Standard method (JIS L 1902–1998). The test was performed in Food Industry Research and Development Institute of Taiwan using the 11634 strain of Escherichia coli on sample specimens of 5 × 5 cm2 size. All the samples were pretreated for 30 min using 254 nm UV light prior to their use in the experiments. In one set of experiments, the samples were illuminated with light source of 365 nm (1 mW cm−2) for 1 and 3 h, respectively. And in the other set, the samples were illuminated with light source of 543 nm (1000 lux ≈ 0.1464 mW cm−2i.e. household fluorescent tube light) for 24 h. Control experiments were also performed in which the samples were treated in the same way except for the use of light sources. The viable bacteria were monitored using the standard protocol by counting the number of colony-forming units (CFU).
Results and discussion
SEM, XRD and TGA characterization
SEM image of the blank paper (Fig. 1a) shows dense network of entwined cellulose fibers with wide pores and damaged surface, probably formed during the paper making process. Representative SEM image of ZnO nanoparticles coated paper obtained after 10 min of sonication is shown in Fig. 1b. The ZnO nanoparticles were observed to be coated on the surface of the cellulose fibers and could be confirmed from the magnified images obtained from SEM. EDS analysis also showed the presence of Zn, Ca, Mg, C, and O confirming the deposition of ZnO nanoparticles (data not shown). The inset of Fig. 1b shows TEM image of the ZnO nanoparticles (∼20 nm) used in these experiments. Fig. 2a and b show SEM images of the paper surface coated with ZnO nanoparticles obtained after 20 and 30 min of sonication, respectively. SEM images show increase in ZnO coating with increasing sonication time thereby reducing the interstitial voids between fibers. Inset in Fig. 2a is the magnified SEM image showing ZnO nanoparticles bound to the cellulose fibers. Magnified SEM images (Fig. 3a, b and c) were also recorded from the paper surface coated with ZnO nanoparticles obtained after 10, 20, and 30 min of sonication, respectively, to compare the effect of sonication on the particle size. No notable difference in the particle size is observed except for the close packing of the ZnO nanoparticles after 30 min, presumably due to the subsequent collapse of the nanoparticles pushing them close together.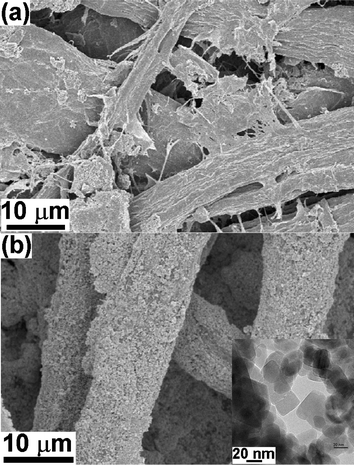 | ||
| Fig. 1 SEM images of (a) blank paper and (b) ZnO nanoparticles coated paper obtained after 10 min of sonication. Inset is the TEM image of the ZnO nanoparticles used in this work. | ||
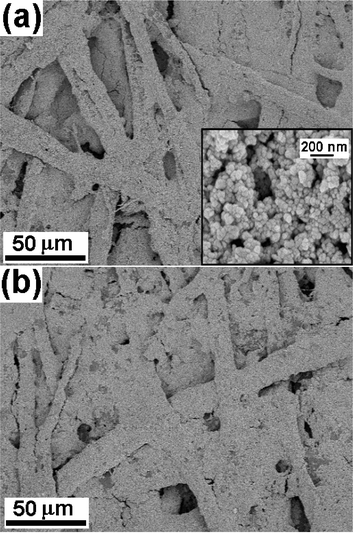 | ||
| Fig. 2 SEM images of ZnO nanoparticles coated paper obtained after (a) 20 min and (b) 30 min of sonication. Inset shows magnified image of the ZnO nanoparticles bound to cellulose fibers. | ||
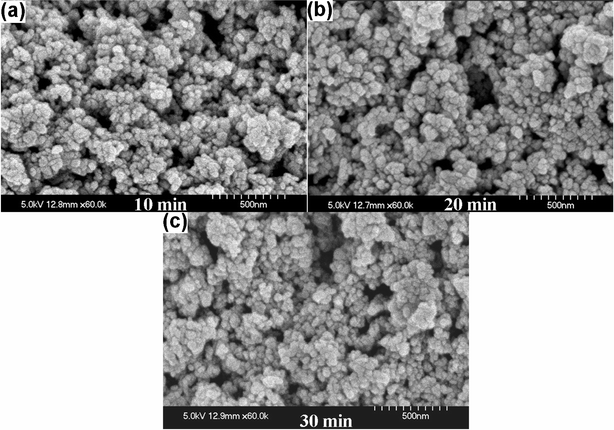 | ||
| Fig. 3 Magnified SEM images of paper surface coated with ZnO nanoparticles obtained after (a) 10, (b) 20, and (c) 30 min of sonication. | ||
To further confirm the coating of ZnO nanoparticles on the paper surface and its crystallinity, XRD spectra were recorded. Representative XRD spectra recorded from blank paper and ZnO nanoparticles coated paper obtained after 20 min of sonication are shown in Fig. 4. The composition of paper in general is very complex. However, the major composition of paper includes cellulose, CaCO3, silicates, thickeners, and binders. For simplicity, we have focused on tracing major components like cellulose and CaCO3 in the XRD spectra. The XRD spectra of blank paper showed characteristic peaks corresponding to cellulose (JCPDS 03-0289) and CaCO3 (JCPDS 85-1108). The peaks without asterisk mark in Fig. 4a (blank paper) correspond to cellulose and those with asterisk (labeled as “CaCO3”) correspond to CaCO3. The XRD pattern recorded from ZnO nanoparticles coated paper (Fig. 4b) showed peaks at 2θ value of 31.7 (100), 34.4 (002), 36.2 (101), 47.5 (102), 56.6 (110), 62.8 (103), 66.4 (200), 67.9 (112) and 69.1 (201) characteristic of ZnO (marked with asterisk and labeled as “ZnO”) and were in good agreement with literature report (JCPDS 89-0510). The remaining peaks in the spectra are attributed to cellulose and CaCO3 as denoted in Fig. 4a.
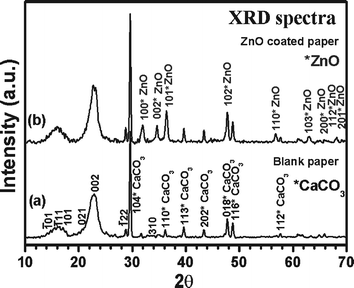 | ||
| Fig. 4 Representative XRD spectra obtained from (a) blank paper and (b) ZnO nanoparticles coated paper obtained after 20 min of sonication. | ||
It was also noted that the coating of ZnO increased with the sonication time and the amount of ZnO loading on the paper surface was estimated using TGA. Representative TGA thermograms (30–500 °C) obtained from blank paper (dash-dot line) and ZnO nanoparticles coated paper obtained after sonication time of 10 (thin line) and 30 min (bold line) are shown in Fig. 5. TGA thermogram obtained from blank paper showed first weight loss below 100 °C due to desorption of moisture and two consecutive weight losses around 325 and 425 °C extending to 450 °C as a result of decomposition of cellulose. No further weight loss was observed at higher temperature. Total weight loss was 90.8% and remaining 9.2% can be attributed to binders and pigments used during the paper making process. The ZnO coated paper sonicated for 10 and 30 min showed total weight losses of 76.5 and 73.1%, respectively. The differences in weight losses (14.3 and 17.7%) compared to blank paper correspond to the amount of ZnO nanoparticles deposited on the paper surface with sonication time of 10 and 30 min, respectively. ZnO loading as a function of sonication time (5, 10, 15, 20, 25, and 30 min) was also estimated from TGA and the corresponding graph is shown as inset in Fig. 5. It indicates that most of ZnO nanoparticles were bound within 5 min of sonication and showed little increase in ZnO loading with increase of sonication time. If ZnO nanoparticles had to fill the voids or form thick layers of coating, the graph would have shown substantial increase of ZnO loading with sonication time. This suggests that with increasing sonication time, the ZnO nanoparticles might tend to bind only to the available –OH functional groups and avoid thick multi-layer formation (see below). From these experiments it can be elucidated that 10–20 min of sonication is sufficient for efficient coating of ZnO nanoparticles and was in agreement with SEM results.
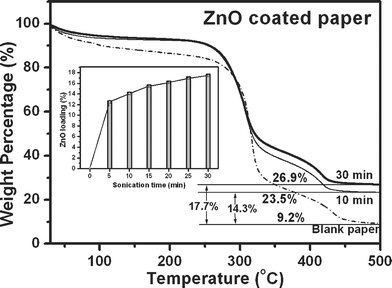 | ||
| Fig. 5 TGA thermograms recorded from blank paper (dash-dot line) compared to that of ZnO nanoparticles coated paper obtained after 10 (thin line) and 30 min (bold line) of sonication. Inset shows histogram of ZnO loading on the paper with increasing sonication time. ZnO loading is the difference in weight loss when compared to the blank paper. | ||
TOF-SIMS characterization
Knowing that the ZnO nanoparticles were coated on the surface of paper, it was important to investigate the nature of binding and also the distribution of the ZnO nanoparticles on the coated paper surface. To investigate this, TOF-SIMS spectra in positive ion detection mode were obtained from blank paper and ZnO nanoparticles coated paper obtained after varying sonication time. Representative TOF-SIMS spectra in positive ion detection mode obtained from blank paper and that obtained from ZnO nanoparticles coated paper after 20 min of sonication are shown in Fig. 6a and b, respectively. The TOF-SIMS spectra of blank paper showed presence of hydrocarbon, oxyhydrocarbon, Ca+, Mg+, Na+etc peaks originating from the paper composition. However, in case of ZnO nanoparticles coated paper (Fig. 6b), additional ions corresponding to 64Zn+ and its isotopes (66Zn+ and 68Zn+) were clearly observed and agreed well with their natural isotopic abundance. Natural isotopic percentage abundance of 64Zn, 66Zn, and 68Zn is 48.63, 27.9, and 18.75%, respectively. Peaks corresponding to the presence of hydrocarbons, oxyhydrocarbon, Ca+, Mg+, Na+etc. were also observed similar to those in blank paper, confirming the coating of ZnO nanoparticles on paper. The intensity of Na+ peak was observed to be higher in ZnO nanoparticles coated paper compared to the blank paper and is presumed to be the impurity during sample preparation. Presence of additional peaks corresponding to 64ZnH+, 66ZnH+, and 68ZnH+ possibly indicate that the ZnO nanoparticles might be bound to the hydroxyl groups of cellulose fibers through hydrogen bonding.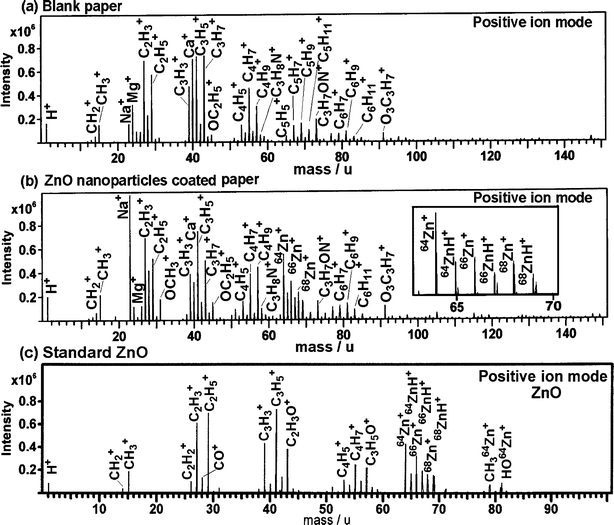 | ||
| Fig. 6 Representative TOF-SIMS spectra in positive detection mode obtained from (a) blank paper, (b) ZnO nanoparticles coated paper obtained after 20 min of sonication and (c) standard ZnO. | ||
To differentiate between the peaks originating from blank paper and those from ZnO nanoparticles, TOF-SIMS spectra in positive ion detection mode was obtained from standard ZnO (Merck) and ZnO nanoparticles used in these experiments. Similar TOF-SIMS spectra were obtained from both and only representative TOF-SIMS spectra obtained from standard ZnO is shown in Fig. 6c. It is important to note that the spectral peak pattern in the TOF-SIMS spectra of blank paper and ZnO nanoparticles coated paper was nearly similar with the exception of Zn+ ions. However, the spectral peak pattern was different from that obtained from standard ZnO. The peaks other than those observed from standard ZnO can be attributed to those arising from cellulose and paper composition. In addition to 64Zn+, 64ZnH+, 66Zn+, 66ZnH+, 68Zn+, and 68ZnH+ ion peaks, the spectra obtained from standard ZnO showed relatively intense peaks corresponding to CH2+, CH3+, C2H2+, C2H3+, CO+, C3H3+, C3H5+ and C2H3O+. These peaks probably originate from the fragmentation of the organic remnants left on the surface of standard ZnO. Additional peaks corresponding to C4H5+, C4H7+, and C3H5O+ were also observed supporting our speculation and also the fact that organic species as remnants on the surface of ZnO are inevitable irrespective of the method used for its synthesis. TOF-SIMS spectra obtained from heat-treated ZnO nanoparticles also showed similar peak patterns, however, with relatively low intensities of hydrocarbon peaks (spectra not shown). Although 64ZnH+, 66ZnH+, and 68ZnH+ peaks were observed in spectra obtained from standard ZnO nanoparticles, the 64ZnH+: 64Zn+ (0.43), 66ZnH+: 66Zn+ (0.57) and 68ZnH+: 68Zn+ (0.71) ion intensity ratios in ZnO nanoparticles coated paper was higher than that observed in spectra obtained from standard ZnO, i.e. 0.28, 0.42, 0.69, respectively. Furthermore, the ambiguity of C5H5+, C5H7+ and C5H9+ ions originating from paper composition and contributing to the observed increase in intensity of 64ZnH+, 66ZnH+, and 68ZnH+ ions could be ruled out, as the peaks corresponding to C5H5+ (65.033 m/z) and 64ZnH+ (64.938 m/z), C5H7+ (67.051 m/z) and 66ZnH+ (66.934 m/z), and C5H9+ (69.067 m/z) and 68ZnH+ (68.932 m/z) could be clearly resolved as shown in inset of Fig. 6b. This supports our speculation of ZnO nanoparticles being bound to the cellulose through hydrogen bonding. This is further supported by the FTIR experiments (see below) and is in accord with the proposed mechanism.
The distribution of the ZnO nanoparticles on the paper surface was investigated by obtaining the ion images of individual Zn+, ZnH+ and its isotopes as shown in Fig. 7. Ion images of 64Zn+, 66Zn+, 68Zn+ and sum of all (64Zn+ + 66Zn+ + 68Zn+) obtained from paper surface coated with ZnO nanoparticles (sonicated for 20 min) are shown in Fig. 7a–d, respectively. The ion images clearly indicate that the ZnO nanoparticles are uniformly distributed and coated on the paper surface. Ion images of 64ZnH+, 66ZnH+, 68ZnH+ and sum of all (64ZnH+ + 66ZnH+ + 68ZnH+) are shown in Fig. 7e–h. The dark contrasts observed in the ion images possibly originate from the voids of the entwined cellulose fiber network, which affects the ion collection efficiency from the specific areas. It might also be due to less concentration of ZnO nanoparticles in voids. Further, it is understood that the coating of ZnO nanoparticles on the paper surface would depend on the density of the entwined cellulose fiber network as the nanoparticles are coated on the fibers.
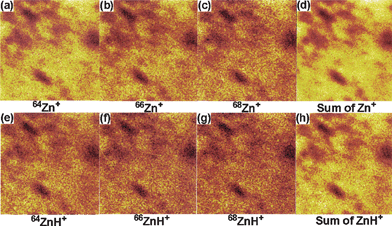 | ||
| Fig. 7 Ion images of (a) 64Zn+, (b) 66Zn+, (c) 68Zn+, (d) sum of all (64Zn+ + 66Zn+ + 68Zn+), (e) 64ZnH+ (f) 66ZnH+ (g) 68ZnH+ and (h) sum of all (64ZnH+ + 66ZnH+ + 68ZnH+) from ZnO nanoparticles coated paper obtained after 20 min of sonication. | ||
Plausible coating mechanism
Typical coating setup and plausible proposed mechanism of coating ZnO nanoparticles on the paper surface is as shown in Fig. 8. The height adjustment in the setup is to adjust the paper substrate at the surface of the dispersed solution. This setup enables coating of ZnO nanoparticles only on one side of the paper thereby reducing the amount of ZnO nanoparticles required. Furthermore, by this way only required amount of ZnO nanoparticles and little solvent medium is consumed and also prevents the ZnO nanoparticles being filled in the interstitial voids unlike mechanical blades, bench coaters or spray techniques. The use of NH4OH was to maintain the basicity of the solution to be compatible with the alkalinity of the paper. Although, pH of 8 was set in all experiments, variation of pH even up to 10 did not show significant effect on the coating efficiency. The NH4OH dissociates into NH4+ and OH− ions and the NH4+ ions tend to get adsorbed on ZnO nanoparticles forming a monolayer. A similar phenomenon of NH4+ adsorption was reported by Sherif and Via40 and Wang and Muhammed.41 It is expected that the nanoparticles dispersed ultrasonically in the medium create high-speed microjets in form of bubbles collapsing on the cellulose fibers and bind uniformly as depicted in the schematic representation of the mechanism. The coating might be due to high impact or via hydrogen bonding.42 Subsequent collapse of the nanoparticles might push the coated nanoparticles towards the fiber and strengthen the coated layer. Although, sonication time was varied from 5 min to 30 min, no significant increase in ZnO loading was observed. Thus, it is expected that the adsorption of NH4+ ions on the ZnO nanoparticles might prevent subsequent loading of ZnO nanoparticles as a result of charge repulsion avoiding multi-layer formation.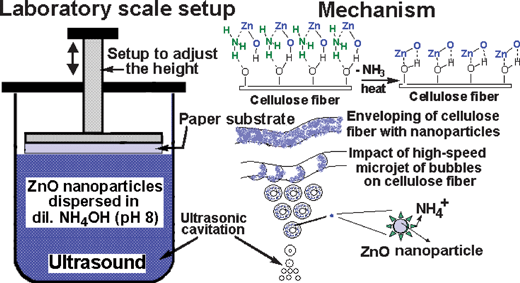 | ||
| Fig. 8 Schematic diagram of the set-up used for coating ZnO nanoparticles on the paper surface and the proposed mechanism. | ||
FTIR characterization
To further support the mechanism, ATR-FTIR spectra were recorded from the blank paper and the ZnO nanoparticles coated paper obtained after 10 and 30 min of sonication as shown in Fig. 9a. The spectra recorded from blank paper (i) shows a weak band at 460 cm−1 characteristic of metal–oxygen (M–O) vibrational band,43 possibly arising from CaCO3, CaO, MgO or silicates usually used during paper making process. A weak broad band at 732 cm−1 might be due to the overlap of the bands at 710 and 750 cm−1, which are characteristic of Iβ and Iα phases of cellulose.44 This possibly indicates their presence as a mixture in the composition of paper. The bands in the range from 900–1300 cm−1 and 1300–1500 cm−1 are associated with C–O and C–H vibrations of cellulose.44 The band at 1640 cm−1 can be attributed to the absorbed water in the cellulose fibers44,45 and is in agreement with TGA data showing initial weight loss (below 100 °C) from blank paper as a result of desorption of water. The band at 1735 cm−1 is characteristic of hemicelluloses and the band at 2909 cm−1 can be attributed to the C–H stretching vibrations of cellulose. A broad band (3100–3700 cm−1) centered around 3367 cm−1characteristic of –OH functional group (free and H-bonded) is also observed.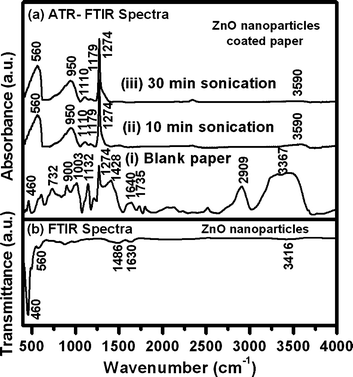 | ||
| Fig. 9 (a) ATR-FTIR spectra obtained from (i) blank paper and ZnO nanoparticles coated paper obtained after (ii) 10 and (iii) 30 min of sonication. (b) Representative FTIR spectra of ZnO nanoparticles after 30 min of sonication in presence of NH4OH. | ||
Similarly, spectra were recorded from ZnO nanoparticles coated paper obtained after (ii) 10 and (iii) 30 min of sonication. Both of the spectra showed a broad band at 560 cm−1 and seemed to have an overlap of bands at 460 cm−1 characteristic of M–O vibrational band.43 The bands at 950, 1110, 1179, 1274 and 3590 cm−1 are attributed to cellulose (paper composition).44 The band at 3590 cm−1 representative of free –OH shows decrease in intensity with increase in sonication time, suggests that the hydroxyl functional groups are occupied with the ZnO nanoparticles. The band seems to disappear after sonication for 30 min, suggesting that almost all the –OH functional groups are occupied. FTIR spectra of standard ZnO nanoparticles and ZnO nanoparticles on sonication in presence of NH4OH were also recorded to support the phenomenon of NH4+ adsorption. A representative FTIR spectrum of ZnO nanoparticles obtained after sonication in presence of NH4OH is shown in Fig. 9b. The spectrum showed bands at 460 and 560 cm−1 corresponding to metal–oxygen (M–O) and metal–nitrogen (M–N) vibrational bands, respectively.43 The bands at 1486 and 1630 cm−1 correspond to N–H bending mode and the band at 3416 cm−1 can be attributed to free NH stretching vibrations.43 On the other hand, the spectrum recorded from untreated ZnO nanoparticles showed a single band at 460 cm−1 attributed to M–O vibrational band.43
Antibacterial activity study
The antibacterial activity of ZnO nanoparticles coated paper was tested using Escherichia coli 11634 in comparison with white cotton and blank paper as controls, the results of which are presented in Table 1. The best antibacterial activity could be obtained on illumination with 543 nm, 1000 lux (∼0.1464 mW cm−2) light i.e. household fluorescent tube light for 24 h. Same result was obtained without illumination but treating for 24 h. This shows that ZnO nanoparticles coated paper shows antibacterial activity even in the absence of light supporting the fact that, antibacterial activity is induced by the hydrogen peroxide (H2O2) generated from ZnO.10,46 H2O2 is a powerful oxidizing agent and more reactive than oxygen molecules. It is well known that H2O2 is harmful to the cells of living organisms and is the major contributor of antibacterial activity.10,46 Thus, the natural tendency of cellulose fibers absorbing moisture and the ZnO nanoparticles generating H2O2 can be taken to the advantage of forming antibacterial wall papers. On the other hand, the white cotton and blank paper (controls) did not show antibacterial activity on illumination with or without 543 nm, 1000 lux light as expected. The samples illuminated with UV light of 365 nm, 1 mW cm−2 for 1 and 3 h, respectively, showed increased antibacterial activity with the increase in exposure time. Although, UV light is observed to contribute to the increased antibacterial activity, exposure time or time of interaction of bacteria with ZnO nanoparticles is also an important parameter. Interestingly, blank paper also showed some antibacterial activity when illuminated with UV light of 365 nm and can be attributed to the contribution from the CaO and MgO present as a part of paper composition and with known potential antibacterial activity.46| Bacteria count (CFU) after seeding and washing immediately | Bacteria count (CFU) on illumination with 365 nm light (1 mW cm−2, 1 h) | Bacteria count (CFU) on illumination with 365 nm light (1 mW cm−2, 3 h) | Bacteria count (CFU) on illumination with 543 nm, 1000 lux ≈ 0.1464 mW cm−2, 24 h | ||||
|---|---|---|---|---|---|---|---|
| In light | No light | In light | No light | In light | No light | ||
| Blank (white cotton) | 1.1 × 10⁵ | 2.6 × 10⁵ | 6.4 × 10⁵ | 2.4 × 10⁶ | 5.0 × 10⁶ | 2.4 × 10⁸ | 2.7 × 10⁸ |
| Blank paper | 1.1 × 10⁴ | 1.3 × 10³ | 2.0 × 10⁴ | 4.8 × 10³ | 1.5 × 10⁵ | 3.7 × 10⁶ | 5.4 × 10⁶ |
| ZnO nanoparticles coated paper | 1.0 × 10⁴ | 1.6 × 10² | 3.2 × 10² | 1.3 × 10² | 1.2 × 10⁴ | <20 | <20 |
It is to be noted that the simplicity, flexibility and adaptability of ultrasound assisted coating approach makes it suitable for this work. It was also observed that the ZnO nanoparticles could be formed on the paper surface on treating with aqueous solution of zinc acetate, either by dip coating or dipping followed by sonication. However, by the dip coating approach, the nanoparticles are coated on either sides of the paper consuming more material. On the other hand, sonication on dipping adds to web defects destroying the paper quality. Additionally, the resultant ZnO nanoparticles coatings are bound to have organic species on the surface and removal of these organic species adsorbed on the surface of ZnO nanoparticles demands high temperature treatment, which is not feasible once coated on thermolabile substrates such as paper. Furthermore, these surface bound organic species are known to affect the optical and catalytic properties. Thus, ZnO nanoparticles used in these experiments were pretreated at 450 °C with the intention of eliminating or reducing the organic contaminants on the surface of the nanoparticles. By using ultrasound, the ZnO nanoparticles could be coated on the cellulose fibers through hydrogen bonding as explained earlier.
Conclusions
In conclusion, coating of ZnO nanoparticles on the cellulose fibers of the paper using an ultrasonic approach is reported for the first time. This coating approach is “green” chemistry because it is simple, inexpensive, consumes less material, avoids waste and minimizes the use of solvent medium, unlike mechanical bench coaters and spray techniques. The paper surface coated with ZnO has been characterized using SEM, EDS, TGA, XRD, ATR-FTIR, and TOF-SIMS. TOF-SIMS could provide information with regards to the surface composition of the coated paper, the binding site of ZnO nanoparticles and also their distribution on the surface. The antibacterial activity of the ZnO nanoparticle coated paper was also tested and the best activity could be obtained on treating for 24 h in the presence and in the absence of light (543 nm, 1000 lux ≈ 0.1464 mW cm−2, i.e. household fluorescent tube light) supporting the role of H2O2 in antibacterial activity. Furthermore, considering the potential implication of this coating technique, nanoparticles and coated layers can be varied using suitable chemistry for desired applications. For example, sonochemically coated nanoparticles of Al2O3 and SiO2 on a paper surface would provide a good economic alternative for TLC plates in separation science. Research towards this goal is currently under work.Acknowledgements
Financial support by National Science Council (NSC94-2218-E-007-052) and National Tsing Hua University is gratefully acknowledged.References
- E. A. Meulenkamp, J. Phys. Chem. B, 1998, 102, 5566 CrossRef CAS.
- Y. N. Xia, P. D. Yang, Y. G. Sun, Y. Y. Wu, B. Mayers, B. Gates, Y. D. Yin, F. Kim and Y. Q. Yan, Adv. Mater., 2003, 15, 353 CrossRef CAS.
- X. S. Fang, C. H. Ye, L. D. Zhang, Y. Li and Z. D. Xiao, Chem. Lett., 2005, 34, 436 CrossRef CAS.
- M. H. Huang, S. Mao, H. Feick, H. Q. Yan, Y. Y. Wu, H. Kind, E. Weber, R. Russo and P. D. Yang, Science, 2001, 292, 1897 CrossRef CAS.
- X. S. Fang and L. D. Zhang, J. Mater. Sci. Technol., 2006, 22, 1 CAS.
- Z. W. Pan, Z. R. Dai and Z. L. Wang, Science, 2001, 291, 1947 CrossRef CAS.
- Z. Y. Fan and J. G. Lu, J. Nanosci. Nanotechnol., 2005, 5, 1561 CrossRef CAS.
- U. Ozgur, Y. I. Alivov, C. Liu, A. Teke, M. A. Reshchikov, S. Dogan, V. Avrutin, S. J. Cho and H. Morkoc, J. Appl. Phys., 2005, 98, 041301 CrossRef.
- G. C. Yi, C. R. Wang and W. I. Park, Semicond. Sci. Technol., 2005, 20, S22 CrossRef CAS.
- O. Yamamoto, Int. J. Inorg. Mater., 2001, 3, 643 CrossRef CAS.
- O. Yamamoto, M. Komatsu, J. Sawa and Z. E. Nakagawa, J. Mater. Sci.: Mater. Med., 2004, 15, 847 CrossRef CAS.
- J. Sawai, S. Shoji, H. Igarashi, A. Hashimoto, T. Kokugan, M. Shimizu and H. Kojima, J. Ferment. Bioeng., 1998, 86, 521 Search PubMed.
- B. Lo, J. Y. Chang, A. V. Ghule, S. H. Tzing and Y. C. Ling, Scr. Mater., 2006, 54, 411 CrossRef CAS.
- S. J. Pearton, D. P. Norton, K. Ip, Y. W. Heo and T. Steiner, J. Vac. Sci. Technol., B, 2004, 22, 932 CrossRef CAS.
- R. Brayner, R. Ferrari-Iliou, N. Brivois, S. Djediat, M. F. Benedetti and F. Fievet, Nano Lett., 2006, 6, 866 CrossRef CAS.
- L. Q. Jing, X. J. Sun, J. Shang, W. M. Cai, Z. L. Xu, Y. G. Du and H. G. Fu, Sol. Energy Mater. Sol. Cells, 2003, 79, 133 CrossRef CAS.
- W. F. Shen, Y. Zhao and C. B. Zhang, Thin Solid Films, 2005, 483, 382 CrossRef CAS.
- S. H. Bae, S. Y. Lee, B. J. Jin and S. Im, Appl. Surf. Sci., 2001, 169, 525 CrossRef.
- T. P. Niesen and M. R. De Guire, J. Electroceram., 2001, 6, 169 CrossRef CAS.
- E. M. Bachari, S. Ben Amor, G. Baud and M. Jacquet, Mater. Sci. Eng., B, 2001, 79, 165 CrossRef.
- R. U. Ibanez, J. R. R. Barrado, F. Martin, F. Brucker and D. Leinen, Surf. Coat. Technol., 2004, 188–89, 675.
- N. Golego, S. A. Studenikin and M. Cocivera, J. Electrochem. Soc., 2000, 147, 1592 CAS.
- S. Chaudhuri, D. Bhattacharyya, A. B. Maity and A. K. Pal, Surf. Coat. Adv. Mater., 1997, 246, 181 Search PubMed.
- D. Bahnemann, Sol. Energy, 2004, 77, 445 CrossRef CAS.
- Y. Lee, H. Kim and Y. Roh, Jap. J. Appl. Phys., 2001, 40, 2423 Search PubMed.
- M. Berber, V. Bulto, R. Kliss and H. Hahn, Scr. Mater., 2005, 53, 547 CrossRef CAS.
- R. H. Wang, J. H. Xin, X. M. Tao and W. A. Daoud, Chem. Phys. Lett., 2004, 398, 250 CrossRef CAS.
- C. Kugge, V. S. J. Craig and J. Daicic, Colloids Surf., A, 2004, 238, 1 CrossRef CAS.
- A. V. Ghule, B. Lo, S. H. Tzing, K. Ghule, H. Chang and Y. C. Ling, Chem. Phys. Lett., 2003, 381, 262 CrossRef.
- A. V. Ghule, K. Ghule, C. Y. Chen, W. Y. Chen, S. H. Tzing, H. Chang and Y. C. Ling, J. Mass Spectrom., 2004, 39, 1202 CrossRef CAS.
- E. Lehtinen, in Pigment coating and surface sizing of paper, ed. J. Glulichsen and H. Paulapuro, TAPPI Press, Helsinki, 2000, 810 pp Search PubMed.
- N. Ignjatovic, Z. Brankovic, M. Dramicanin, J. M. Nedeljkovic and D. P. Uskokovic, Adv. Mater. Processes, 1998, 282, 147 Search PubMed.
- Y. Natsume and H. Sakata, Thin Solid Films, 2000, 372, 30 CrossRef CAS.
- T. Gliese, Wochenbl. Papierfabr., 2004, 132, 540 Search PubMed (abstract).
- A. S. Matlack, Introduction to Green Chemistry, Marcel Dekker, Inc., New York, 2001 Search PubMed.
- P. T. Anastas and J. C. Warner, Green Chemistry: Theory and Practice, Oxford University Press, Inc., New York, 1998 Search PubMed.
- P. T. Anastas and J. B. Zimmerman, Environ. Sci. Technol., 2003, 95A CAS.
- S. Vajnhandl and A. M. Le Marechal, Dyes Pigm., 2005, 65, 89 CrossRef CAS.
- A. Gedanken, Ultrason. Sonochem., 2004, 11, 47 CrossRef CAS.
- F. G. Sherif and F. A. Via, to Akzo America Inc., U.S. Pat., 4764357, 1988.
- L. Wang and M. Muhammed, J. Mater. Chem., 1999, 9, 2871 RSC.
- L. de Smet, G. A. Stork, G. H. F. Hurenkamp, Y. Q. Sun, H. Topal, P. J. E. Vronen, A. B. Sieval, A. Wright, G. M. Visser, H. Zuilhof and E. J. R. Sudholter, J. Am. Chem. Soc., 2003, 125, 13916 CrossRef CAS.
- K. Nakamoto, Infrared and Raman Spectra of Inorganic and Co-ordination Compounds, Wiley, Chichester, 1978 Search PubMed.
- R. G. Liu, H. Yu and Y. Huang, Cellulose, 2005, 12, 25 CrossRef CAS.
- G. Gastaldi, G. Capretti, B. Focher and C. Cosentino, Ind. Crops Prod., 1998, 8, 205 CrossRef CAS.
- J. Sawai, J. Microbiol. Methods, 2003, 54, 177 CrossRef CAS.
| This journal is © The Royal Society of Chemistry 2006 |
