Biosensing with conically shaped nanopores and nanotubes†
Youngseon Choi, Lane A. Baker, Heather Hillebrenner and Charles R. Martin*
Department of Chemistry, Center for Research at the Bio/Nano Interface University of Florida, Gainesville, FL 32611-7200, USA. E-mail: crmartin@chem.ufl.edu; Fax: 352 392 8206; Tel: 352 392 8205
First published on 7th August 2006
Abstract
In this review we consider recent results from our group that are directed towards developing “smart” synthetic nanopores that can mimic the functions of biological nanopores (transmembrane proteins). We first discuss the preparation and characterization of conical nanopores synthesized using the track-etch process. We then consider the design and function of conical nanopores that can rectify the ionic current that flows through these pores under an applied transmembrane potential. Finally, two types of sensors that we have developed with these conical nanopores are described. The first sensor makes use of molecular recognition elements that are bound to the nanopore mouth to selectively block the nanopore tip, thus detecting the presence of the analyte. The second sensor makes use of conical nanopores in a resistive-pulse type experiment, detecting the analyte via transient blockages in ionic current.
1. Introduction
Living cells use protein nanopores and channels, embedded within the cell membrane, to communicate chemically and electrically with the extracellular environment.1 The protein channels open and close in response to stimuli such as a change in the transmembrane potential difference, the presence of a specific small-molecule ligand, or a mechanical stress on the cell.2 Recently, significant interest exists in developing abiotic analogues of such biological nanopores as sensing elements for chemical and biochemical sensors.3–19 We have explored the creation of such synthetic nanopores using the track-etch method. In this review we consider recent work from our group related to these studies.A significant body of work related to resistive-pulse sensors based on biological nanopores, in the form of transmembrane proteins, has developed in recent years.20–33 The α-hemolysin(α-HL) protein nanopore is typically used, and the sensor consists of a single protein nanopore embedded within a lipid bilayer membrane. Resistive-pulse sensors entail mounting the lipid bilayer membrane containing an α-HL nanopore between two electrolyte solutions, applying a transmembrane potential difference, and measuring the resulting ion current flowing through the electrolyte-filled protein nanopore. In simplest terms, when the analyte enters and translocates the α-HL nanopore, it transiently blocks the ion current, resulting in a downward current pulse. The frequency of such translocation-induced current-block events is proportional to the concentration of the analyte, and the identity of the analyte is encoded in the magnitude and duration of the current-block. Numerous analytes including metal ions,21,23 proteins,25,30 nucleic acids,4,27,28,34–37 polymers38 and various small molecules24,39 have been detected with the α-HL nanopore, and these data remain the benchmark by which alternative nanopores are evaluated.
While this is a very promising sensing paradigm, it would be advantageous to eliminate the fragile lipid bilayer membrane, and perhaps to replace the biological nanopore with an abiotic equivalent that can mimic the gating functions of biological nanopores. The motivation for this research is that if such “smart” abiotic nanopores could be developed, they could lead to new approaches for biosensor design that capitalize on the advantages of biological nanopore resistive-pulse sensors but do not suffer from their fragilities. A variety of approaches have been used to prepare abiotic nanopores for sensing applications, including focused ion beam etching of silicon nitride and oxide,3,5,10 soft lithographic techniques,14,40 embedded carbon nanotubes,7,41 femtosecond-pulsed laser-based technique on glass42 and track-etched conical nanopores produced in polymeric membranes.16,18,43–45 We and others44,46–49 have been investigating synthetic polymer membranes that contain a single conically shaped nanopore as mimics of the biological nanopores and channels.
These single conical nanopore membranes are synthesized using the track-etch method,50,51 a nanopore fabrication technology that has been practiced commercially for decades, in synthetic polymer membranes. Two important advances in this technology have extended the application of such track-etch membranes. The first advance, the tracking of thin films with a single particle, which results in a single damage track through the polymer film, has allowed for the preparation of polymer membranes (e.g., polycarbonate, poly(ethylene terephthalate), polyimide, Fig. 1) that contain only a single nanopore.18,43,45,52,53
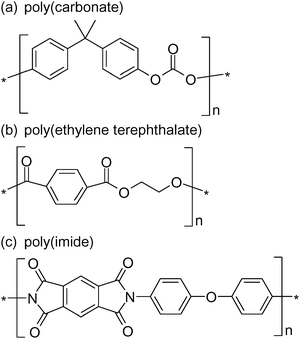 | ||
| Fig. 1 Chemical structures of common polymers used in the track-etch process. | ||
The second advance, an electric-field assisted asymmetric etching process, has allowed pores with a highly conical geometry, as opposed to conventional cylindrical geometries, to be synthesized.18,43,45,52,53 The conical nanopores prepared using this method can have small-diameter openings (hereafter called the tip of the nanopore) from 1–100 nm. These single conical nanopore membranes can be mounted between two halves of a conductivity cell, in effect replacing the biological nanopore in a resistive-pulse sensing experiment. When a transmembrane potential difference is applied across the membrane, ions flow through the electrolyte-filled nanopore, generating a measurable ion current. This creates a sensor in a manner analogous to that described above in the case of biological nanopores. The response of ion currents to an analyte of interest can be measured as a function of potential (current–voltage curves) or as a function of time (current–time transients).
An important feature of the conical nanopore (as opposed to a cylindrical pore) is that the voltage drop caused by this ion current is focused at the nanopore tip. Indeed, calculations done by Lee et al.54 indicate that the field strength in the solution just inside the nanopore tip can be ∼106 V m−1, when the total voltage drop across the nanopore membrane is only 1 V. A consequence of this focusing effect is that the ion current flowing through the conical nanopore is extremely sensitive to analyte species present in or near the nanopore tip. That is, there is a “sensing zone” just inside the nanopore tip, and for the nanopores typically used we estimate that this sensing zone is typically 100–200 nm in length.54 This focusing effect makes conically shaped nanopores better suited for sensing applications than cylindrical nanopores. In this review we will discuss recent results from our group related to membranes containing conical nanopores that can mimic the functions of biological nanopores48,49,55 and serve as chemical and biochemical sensors.16,17 In all cases discussed here, the membrane sample contained a single conically shaped nanopore or nanotube.
2. Materials and methods
2.1. Conical nanopore membranes
Our studies utilize nanopore polymeric materials prepared by the track-etch method.43,51 This method is used commercially to make nanopore filters with monodispersed pores. The track-etch method entails bombarding a polymer membrane with high-energy particles, either from a nuclear reactor or a cyclotron; this yields damage tracks that run through the complete thickness (typically 5 to 10 μm) of the membrane. The damage tracks are then chemically etched to yield monodisperse (typically cylindrical) pores. Nanopore membranes of this type composed of polycarbonate, poly(ethylene terephthalate) (PET), and polyimide (Fig. 1) are available commercially in a wide range of pore sizes, down to ∼10 nm.We typically use custom-made membranes that contain much lower pore densities than are found in commercial membranes, down to a single pore per membrane sample. For biosensor development, we are especially interested in membranes that have low densities of conically shaped pores. Conically shaped pores are prepared using an anisotropic chemical etch method developed by Apel, et al.16,17,43,45,48,49,56,57
Briefly, the heavy-ion irradiated (damage-tracked) polymer membrane is placed between the two halves of a U-tube cell, and an etch solution is added to one half-cell and a stop-etch solution to the other half-cell. Etching along the damage track begins at the face of the membrane in contact with the etch solution. But when this etchant breaks through to the other face of the membrane it is neutralized by the stop-etch solution. As a result, a conically shaped pore is obtained with the large-diameter opening (the “base” opening) in contact with the etch solution and the small-diameter opening (the “tip” opening) in contact with the stop-etch solution.
As an example, for PET 9 M NaOH solution is used as the etch solution and 1 M formic acid as the stop-etch solution. To monitor the etching process, a Pt electrode is placed into each solution, and these electrodes are used to apply a constant transmembrane potential difference during etching and measure the ionic current flowing through the nascent pore. The polarity is such that the anode is in the NaOH etch solution. This polarity electrophoretically drives the etchant, the hydroxide anion, away from the nascent pore tip, which allows for tips with very small diameters (<5 nm) to be prepared.16,17,48,56
For sensor development, it is important to characterize and control the geometry of these conical nanopores accurately and precisely. The base diameters of conical nanopores can be determined by field-emission scanning electron microscopy (FE-SEM). An electrochemical method can be used to obtain an estimate of the diameter of the tip opening, dt. Briefly, this method entails mounting the nanopore membrane between two electrolyte solutions (1 M KCl, pH = 8), and using a Ag/AgCl electrode immersed into each solution to obtain a current–voltage curve for the nanopore. At applied transmembrane potentials between +100 and −100 mV, the current–voltage curve is linear, and the slope provides the ionic resistance (Rp) of the electrolyte-filled nanopore; dt is related to Rpvia:43
 | (1) |
When working with conical nanopores another important consideration is the effective length of the nanopore, which is the part of the nanopore over which the majority of the resistance of the pore is focused, i.e. “sensing zone”. Also, on this part of the nanopore, the voltage drop is the greatest, which results in the strongest electric field. For a cylindrical pore L = Leff (Leff = effective length), because each slice of a cylindrical pore contributes to the pore’s resistance in an equal manner, resulting in a linear voltage drop inside the entire length of the pore. On the other hand, the asymmetric shape of a conical nanopore makes the distribution of resistance (and electric field) over the length L nonlinear.
To determine the effective length of a conical pore, we have analyzed how the resistance is distributed along the pore axis, from the tip of the nanopore towards the large pore opening. In order to do that, we calculated resistance of cones Rx of length 0 < x < L, big diameter 0 < dx < db, and small opening dt. The quantity dx can be expressed as the following function of x:16
 | (2) |
 | (3) |
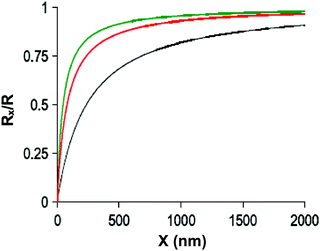 | ||
| Fig. 2 Ratio of the resistance of a conical pore of length x to the total resistance of a cone of length L (Rx/Rtot) for three conical pores. All pores had the same dt equal to 20 nm and db equaled 5 μm (upper), 3 μm (middle) and 1 μm (lower), respectively. | ||
2.2 Controlling the shape of the conical nanopore
As described above, the sensing and transport properties of conical nanopores are strongly dependent on the geometry (cone angle, membrane thickness) of the conical nanopores. We have recently discovered that the cone angle of conical nanopores can be systematically controlled by varying the transmembrane potential difference applied during pore etching.45Fig. 3 shows FE-SEM images of the base openings of conical nanopores that were all etched for 5 h, but using three different values of applied transmembrane potential during etching. We can see that the diameter of the base opening increases with the magnitude of the applied potential difference. Indeed, by applying potentials in the range of 0 to 30 V, the base opening can be systematically varied from 1 to 6 μm (Fig. 4). The shapes of these various nanopores were investigated by plating a gold nanowire within the pore and then plasma etching away the membrane to expose this nanowire.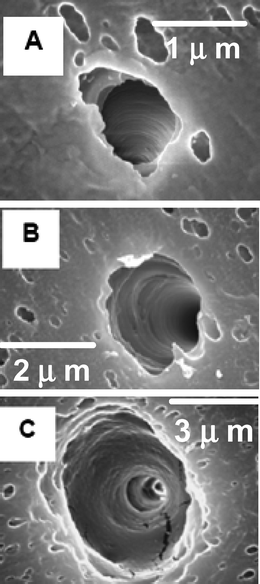 | ||
| Fig. 3 Scanning electron micrographs of the large diameter of a single conical nanopore fabricated under the conditions of (a) 0.0 V, (b) 15.0 V, and (c) 30.0 V applied during the etching process. The membrane was polycarbonate. | ||
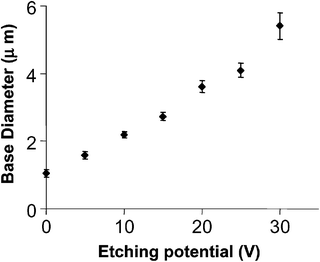 | ||
| Fig. 4 The change in base diameter with applied potential during the etching process. The membrane was polycarbonate. | ||
FE-SEM images of three such nanowires are shown in Fig. 5. As would be anticipated from the pore-base images (Fig. 3), we can see that the cone angle increases with increasing transmembrane potential applied during etching. The pore shapes obtained at 10 and 30 V are well-approximated by a true conical shape. In contrast, etching with no applied potential yields a pore that is nearly cylindrical through most of its length with a conical segment of about 3 μm at one end.
 | ||
| Fig. 5 Scanning electron micrographs of Au conical nanowires of pore geometry at (a) 0.0 V, (b) 15.0 V, and (c) 30.0 V applied during the pore etching process. The membrane was polycarbonate. | ||
Thus, by keeping the etching time constant and increasing the applied potential during the etching process we were able to vary the diameter of the pore exposed to the etching solution. These phenomena may be explained as a consequence of a higher ionic current flow through the nanopore, resulting in resistive heating of the solution filling the nanopore during the etching at higher applied potentials. The rate of etching is known to increase with temperature, and this local resistive heating causes the etch rate at the face of the membrane in contact with the etching solution to increase. As a result, the base diameter is larger when higher transmembrane potentials are employed.
2.3 Template synthesis of conical nanocones
Beginning in the 1980s, our group pioneered a general method for the preparation of nanomaterials called template synthesis.58–73 This method, which entails using the monodisperse pores in a nanopore membrane as templates to prepare nanoparticles, is especial useful for preparing nanowires and nanotubes. The key to practicing this method is obtaining template membranes that have uniform, monodisperse pores. Electroless plating is an uninformative name because it tells one what the method is not—it does not use an electrode—rather than what the method is. To set the record straight, electroless metal plating or deposition entails reduction of a metal ion at a surface by a chemical reducing agent to coat the surface with a thin film of metal.74,75 A catalyst that accelerates the rate of the chemical reduction reaction is typically applied to the surface to be coated.We will briefly review the polymer-membrane plating method here (Fig. 6). The membrane is first exposed to a sensitizer (Sn2+) by simply immersing the membrane into a solution of SnCl2 and trifluoroacetic acid in 50/50 methanol/water. The sensitizer binds to the pore walls and the membrane surfaces via complexation with surface polymer functional groups produced by the reaction between the polymer and the etchant used to create the pores.74
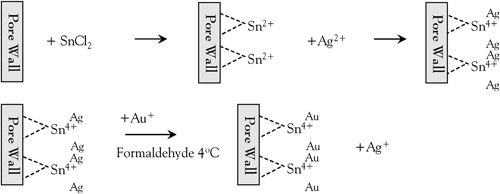 | ||
| Fig. 6 Schematic diagram of Au electroless plating procedure. | ||
After sensitization, the membrane is rinsed thoroughly and immersed into an aqueous solution of ammoniac silver nitrate. A redox reaction occurs in which the surface bound Sn(II) is oxidized to Sn(IV) and Ag+ is reduced to elemental Ag. As a result, the pore walls and the membrane surface become coated with nanoscopic Ag particles. The silver coated membrane is then immersed into a commercially available gold plating bath containing Na3Au(SO3)2, and a chemical reducing agent, formaldehyde. The Au galvanically displaces the Ag particles because the reduction potential of Au is more positive than that of Ag. As a result, the pore walls and membrane faces become coated with Au particles. These particles are excellent catalytic sites for the oxidation of formaldehyde and the concurrent reduction of Au(I) to Au (0).74
| 2 Au(I) + HCHO + 3 OH → HCOO− + 2 H2O + 2 Au(0) | (4) |
3. Ion-channel mimetic conical nanopores
All living cells have protein nanotubes—called ion channels—that span the cell membrane.80 These biological channels control what ions and molecules enter the cell, are involved in nerve-impulse transmission in nerve cells, and regulate signaling between cells.2 Some of these channels are gated—meaning they open and close in response to specific chemical, mechanical or electrical signals. Gating the flow of ions, often against a concentration gradient, is a primary function of biological ion channels. These protein channels can be mimicked, at least conceptually, by synthetic pores that possess an asymmetric charge distribution. We have investigated and refined the ability to control the rectification of such asymmetric conical nanopores using both chemical modifications to the membrane and ligands for the ions in solution.47,48,56,76The bare polymer conical nanopores used in these experiments are interesting because of the asymmetric properties of the pores that develop from the conical shape. The etching process used to create these pores typically leaves dangling polymer endgroups that are charged. As a result of this surface charge, negative in most bare polymers studied, the conical nanopores generated are cation permselective, provided the tip diameter of the pore is small relative to the Debye screening length for the electrolyte solution employed. This means that current is carried through the nanopore predominately by cations. Furthermore, such cation-permselective conical nanopores show non-linear (rectifying) current–voltage curves,43,81,82i.e., for any absolute value of applied transmembrane potential, the current is higher at negative potentials than at the equivalent positive potentials. As discussed in detail previously,48 this is because cations migrating from base to tip experience an electrostatic trap not observed when cations are migrating from tip to base. The properties of these pores can be further controlled through chemical modification.48 For example, in the examples described below, single conical pore membranes have been plated with gold through electroless deposition to permit the chemisorption of functionalized thiols that enable control over the surface chemistry of the nanotube walls.
3.1 Conical nanopores as mimics of biological ion channels48
Poly(ethylene terephthalate) membranes with a single damage track were anisotropically etched using a basic solution on one side and an acidic stopping medium on the other. This results in the formation of a conical pore. By controlling the etching time and concentrations of base and acid, pores with nominal cone tips 20 nm in diameter and cone bases 600 nm in diameter were obtained. Conical pores were then plated with gold, forming conical gold nanotubes. After plating, the tip diameter of the pore was nominally 10 nm, as determined by eqn (1). The membrane was then mounted in a conductivity cell with a solution of 0.1 M KCl on both sides of the half-cell. In the case of a bare gold membrane (Fig. 7), ionic currents are rectified, creating a two state system. At negative potentials, the pore is “on” while at positive potentials the pore is “off”. This phenomenon is observed due to the adsorption of Cl− to the walls of the gold nanotube, creating a high negative charge at the nanotube surface. When the solution is changed from 0.1 M KCl to 0.1 M KF rectification is not observed (Fig. 7). This is due to the fact that F− does not adsorb to gold, as Cl− does.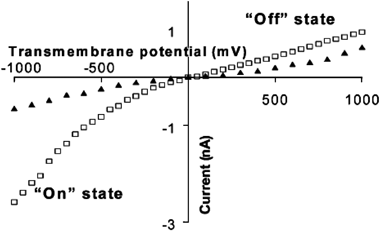 | ||
| Fig. 7 I–V curves in 0.1 M KCl (□) and 0.1 M KF (▲). The membrane material was poly(ethylene terephthalate) with a single conical nanopore into which was deposited a conical Au nanotube. | ||
The effect of charge on the nanotube walls was further investigated by measuring current–voltage curves of nanotubes with chemisorbed 2-mercaptopropionic acid (Fig. 8) or mercaptoethyl ammonium (not shown) to respective nanotube membranes. In the case of 2-mercaptopropionic acid, the carboxylate group can be protonated or deprotonated by varying the solution pH. At pH 6.6, the carboxylic acids are deprotonated resulting in a negatively charged nanotube surface. Current–voltage curves at this pH showed rectification, similar to that observed in the case of Cl− adsorbed to bare gold nanotubes. When the pH was lowered to 3.5, the carboxylic acid groups are protonated, removing the negative charge at the surface. Current–voltage curves at this pH showed no rectification, as observed when KF was used as the electrolyte. By chemisorption of mercaptoethyl ammonium, a positively charged cation, current rectification can be reversed, meaning that at positive potentials higher current is passed, the nanotube is “on” and at negative potentials, low current is passed, the nanotube is “off”. A detailed model of the mechanism of rectification based on the formation of an electrostatic trap that arises due to the inherent asymmetry in charged conical pores was developed to explain the observed current–voltage curves and rectification.48
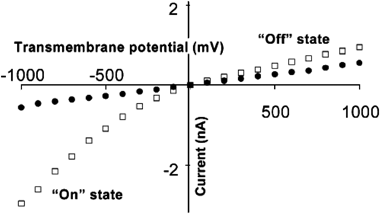 | ||
| Fig. 8 I–V curves in 0.1 M KF for gold nanotubes modified with 2-mercaptopropionic acid; pH = 6.6 (□) and pH) 3.5 (●). The membrane material was poly(ethylene terephthalate) with a single conical nanopore into which was deposited a conical Au nanotube. | ||
3.2 Electromechanically-gated conical nanotube membranes
In an effort to design more sophisticated biomimetic conical nano tubes, we have constructed single conical nano tubes with a built-in electromechanical mechanism that controls rectification of ionic currents based on the movement of charged DNA strands.47 In these experiments, low density tracked poly(carbonate) membranes were anisotropically etched to form conical nanopores. Membranes were masked in a manner that allowed the isolation and characterization of a single conical nano tube. Fig. 9 shows SEM images of the cone base opening of a pore (A), and the small opening of a pore (B). In Fig. 9C, a SEM image of a gold replica of a prepared pore is shown that demonstrates the conical geometry of the conical nanopore. Conical nanopores were plated with gold through electroless deposition, forming membranes possessing a single conical gold nanotube. After plating, conical gold nanotubes with small-diameter radii between 13–100 nm were obtained (Table 1).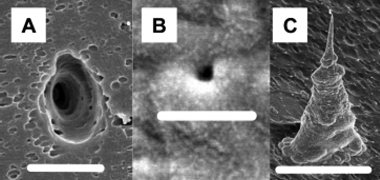 | ||
| Fig. 9 Electron micrographs showing (a) large-diameter (scale bar = 5.0 μm) and (b) small-diameter (scale bar = 333 nm) opening of a conical nanopore, and (c) a liberated conical Au nanotube (scale bar = 5.0 μm). The membrane was polycarbonate. | ||
Thiolated DNA strands of varying base pair length and sequence were then chemisorbed to the surface of the gold nanotube. The DNA nanotubes prepared show an off state (low currents at positive potentials) and an on state (high currents at negative potentials) (Fig. 10A). We propose the rectification observed is due to electrophoretic movement of the DNA chains into (off state, Fig. 10C) and out of (on state, Fig. 10B) the nanotube tip. The movement of the DNA chains into the nanotube tip results in occlusion of the nanotube orifice, resulting in a higher ionic resistance. In Fig. 10, the effect of chain length on rectification can be clearly observed. That is to say, as DNA chain length increases, the extent of rectification increases. It was found that an optimal length of DNA induces rectification based on the small diameter of the nanotube. This work demonstrated the first example of a simple chemical (DNA chain length) or physical (nanotube pore size) method to control the extent of rectification of an artificial ion channel.
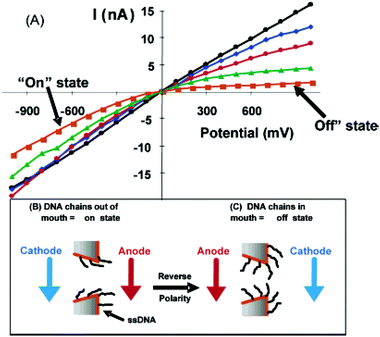 | ||
| Fig. 10 (A) I–V curves for nanotubes with a mouth diameter of 40 nm containing no DNA (linear, circles) and attached 12-mer (diamonds), 15-mer (circles), 30-mer (triangles), and 45-mer (squares) DNAs. (B and C) Schematics showing electrode polarity and DNA chain positions for on (B) and off (C) states. The membrane material was polycarbonate with a single conical nanopore into which was deposited a conical Au nanotube. | ||
3.3 Controlling rectification with a chemical ligand
We have also used ligands that complex the current-carrying ions present in solution to control the rectification of ionic currents.17 Polymers such as polyethylene glycols and molecules such as crown ethers are often used to probe the transport properties of both the biological and abiotic nanopores.83–85 For example, the crown ether commonly called 18-crown-6 (18C6) has been used to study the transport properties of the α-HL biological nanopore.84 These studies have suggested that because the diameter of the 18C6 molecule (1.15 nm) is comparable to the diameter of the lumen of this nanopore (1.4 nm), 18C6 has a dramatic effect on the transport properties of the α-HL nanopore. Recently, we have examined the effects of 18C6 on the transport properties of conical nanopores.17Fig. 11a shows current–voltage curves with the 18C6 added to the solution facing the tip (dtip = 1.5 nm) of the conical nanopore. At positive applied transmembrane potentials, the positively charged K+-18C6 complex is driven electrophoretically away from the membrane surface, and the 18C6 has no effect on the current–voltage curve. Charge is carried through the nanopore by free K+ ions migrating from base to tip (upper inset, Fig. 11a). At negative applied transmembrane potentials both the excess uncomplexed K+ and the positively charged K+-18C6 complex are driven electrophoretically into the tip of the nanopore (lower inset, Fig. 11a). In this case, the measured current at any applied potential decreases with increasing concentration of 18C6.
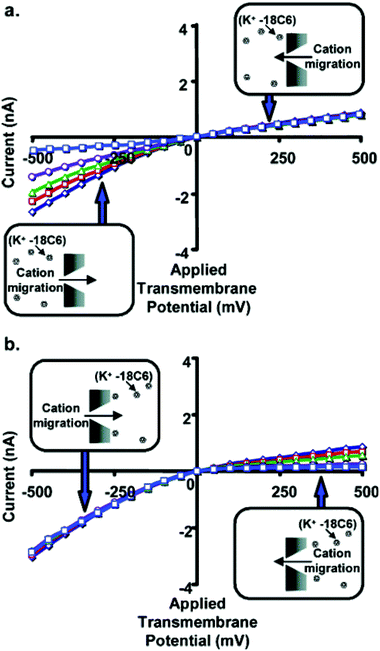 | ||
| Fig. 11 Current–voltage curves for a conical nanopore with tip diameter ∼1.5 nm, and with 18C6 added to the 1 M KCl solution facing the tip (a) or base (b) of the conical nanopore. The concentration of 18C6 was 0 mM (◇), 5 mM (□), 10 mM (Δ), 25 mM (○), or 50 mM (□). Each data point is the average of three replicate measurements on the same membrane. The standard deviation is ∼2% of the measured average current. Error bars are not shown because they are approximately equivalent to the width of the lines in the plot. The membrane material was polyimide. | ||
Fig. 11b shows analogous current–voltage curves for 18C6 added to the solution facing the base of the conical nanopore. At negative applied transmembrane potentials, the positively charged K+-18C6 complex is driven electrophoretically away from the membrane surface, and the 18C6 has no effect on the current–voltage curve. Charge is carried through the nanopore by free K+ ions migrating from tip to base (upper inset, Fig. 11b). At positive applied transmembrane potentials both the excess uncomplexed K+ and the positively charged K+-18C6 complex are driven electrophoretically into the tip of the nanopore (lower inset, Fig. 11b). Again, we find that when the complex is driven into the nanopore, the measured current at any applied potential decreases with increasing concentration of 18C6.
In summary, Fig. 11 shows that when the K+-18C6 complex is driven electrophoretically into the nanopore, the current decreases with increasing 18C6 concentration, and this is true whether the complex is driven into the nanopore from tip to base (Fig. 11a) or from base to tip (Fig. 11b). For these experiments, dtip (1.5 nm) is comparable to the diameter of 18C6 complex (1.15 nm). Fig. 12 shows analogous current–voltage curves for a nanopore with dtip = 3 nm. 18C6 has essentially no effect on the current–voltage curve for this larger tip-diameter nanotube regardless of the polarity of the applied potential, the electrolyte solution to which the 18C16 is added, and the 18C6 concentration. Similar results were obtained for nanopores with dtip = 9 and 15 nm.
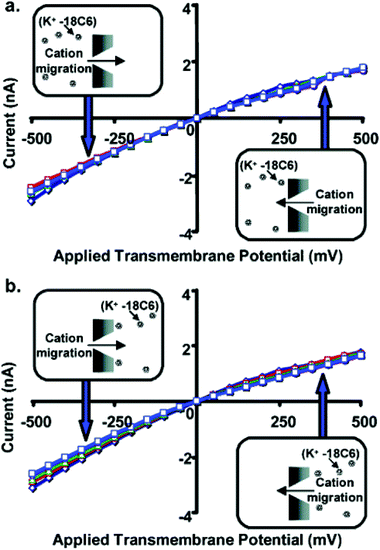 | ||
| Fig. 12 Current–voltage curves for a conical nanopore with tip diameter ∼3.0 nm, and with 18C6 added to the 1 M KCl solution facing the tip (a) or base (b) of the conical nanopore. The concentration of 18C6 was 0 mM (◇), 5 mM (□), 10 mM (Δ), 25 mM (○), or 50 mM (□). Each data point is the average of three replicate measurements on the same membrane. The membrane material was polyimide. | ||
These studies show that for 18C6 to have an effect on the current–voltage curve, the nanopore must have a tip diameter comparable to that of the 18C6 molecule. These studies also discount an alternative possibility—that the small amount of complexed K+ produces a large decrease in the conductivity of the 1 M KCl solution. If this were the case, 18C6 would decrease the observed current regardless of the tip diameter of the nanopore, and this is not what was observed experimentally. Furthermore, independent measurements of the conductivities of the various solutions used here confirm that this is not the case.
As noted earlier, conical nanopores that have excess surface charge and a small tip diameter relative to the Debye screening length act as ion-current rectifiers. This is because cations migrating from base to tip experience an electrostatic trap not observed when cations are migrating from tip to base. As a result, in the absence of 18C6, higher currents are observed at any given negative transmembrane potential, relative to the current observed at the same positive transmembrane potential (Fig. 13). The extent of rectification can be quantified via the ratio, r
 | (5) |
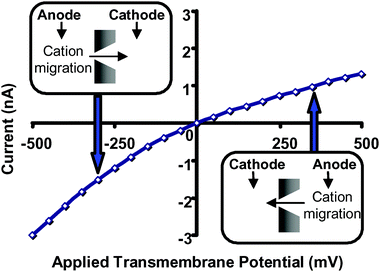 | ||
| Fig. 13 Current–voltage curve for a conical nanopore with tip diameter ∼1.5 nm in 1 M KCl, pH = 8. The membrane material was polyimide. | ||
Addition of 18C6 provided a means to tune the rectifying properties of the nanopore. This was because when added to only one side of the membrane, as described here, 18C6 affected only one branch (positive currents or negative currents) of the current–voltage curve. Hence 18C6 also rectified the ion current, and this “transport-induced rectification” could either add-to (Fig. 11b) or subtract-from (Fig. 11a) the intrinsic electrostatic rectification of the nanopore, depending on which side of the nanopore the 18C6 was added. This was shown in Fig. 14 as plots of r (eqn (5)) vs. concentration of crown ether added to either the solution facing the base or the tip of the conical nanopore.
 | ||
| Fig. 14 Rectification ration, r (eqn (5)), vs. concentration of added 18C6 for a conical nanopore with tip diameter ∼1.5 nm. 18C6 was added to the 1 M KCl solution facing the tip (□) or base (△) of the nanopore. The membrane material was polyimide. | ||
To explain these results, a junction-potential model was developed based on the theory of hindered diffusion, which indicates that the diffusion coefficient for the complex in the tip of the nanopore will be at least two orders of magnitude smaller than the diffusion coefficient for the complex in bulk solution. This difference in diffusion coefficient for the complex between the bulk solution and the tip of the nanopore makes the bulk-solution vs. nanopore transference numbers different, and it is this difference in transference numbers that leads to the junction potential. Careful control experiments with non-binding ethers (Fig. 15) and electrolyte solutions composed of LiCl instead of KCl (Li+ is not complexed by crown ethers) further confirmed the junction-potential model developed.
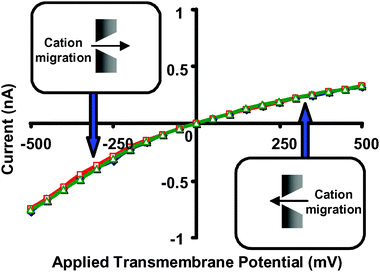 | ||
| Fig. 15 Current–voltage curves for a conical nanopore with tip diameter ∼1.5 nm, and with 1 M LiCl as the electrolyte. (◇) 1 M LiCl, no added 18C6. (□) 1 M LiCl and 50 mM 18C6 added to the solution facing the tip of the nanopore. (Δ) 1 M LiCl and 50 mM 18C6 added to the solution facing the base of the nanopore. The membrane material was polyimide. | ||
4. Sensing with conical nanopores
The experiments described above in detail a number of interesting fundamental phenomena associated with the conical nanopore membranes. We now describe two types of sensors that can be fabricated using these conical nanopores. The first sensor mimics a ligand-gated channel that is modified with molecular recognition chemistries that can bind analytes in solution. The second sensor functions in a resistive-pulse fashion, and is able to detect translocation of a small molecule (a porphyrin) under an applied transmembrane potential.4.1 Biochemically functionalized conical nanotubes
An example of ligand-gated channel mimics involved the use of single conical gold nanopores that were modified with biochemical recognition chemistry to create an “on/off” sensor based on transmembrane ion currents.49 In these experiments, conical nanopores with a base-opening diameter of ∼600 nm and a small-opening diameter of ∼30 nm were produced using anisotropic chemical etching of a poly(ethylene terephthalate) membrane that possessed a single ion track. The conical nanopores were then plated with gold using electroless deposition until the small diameter of the conical pore was in the range of 5–9 nm. The final size of the small diameter of the pore was tuned to match the size of the analyte of interest.After obtaining a conical gold nanotube, the surface of the conical nanopore was modified using the chemisorption of thiols to add biochemical recognition properties to the membrane. For instance, a sensor for the protein streptavidin was created by modifying the conical gold nanotube surface with a thiolated biotin. In this case, biotin serves as a molecular recognition agent for streptavidin. When the biotin-modified conical gold nanotube was mounted in a conductivity cell and a transmembrane potential was applied, a transmembrane ion current flowed through the pore. The ion current was monitored using current–voltage curves (Fig. 16). When 100 nM lysozyme was added to the solution contacting the nanopore, there was no appreciable change in the current–voltage curve of the nanopore, indicating that lysozyme (a control protein) did not interact with the nanopore. In contrast, upon addition of 180 pM streptavidin, the current–voltage curves indicated that ionic current through the conical pore was blocked by the specific adsorption of streptavidin. This created, in effect, a sensor based on the blockage of ionic currents, similar to the case of α-hemolysin, a model protein nanopore. The time required for the biotin-modified conical gold nanopore to block was found to be inversely related to the concentration of streptavidin present in solution (Fig. 17). As can be observed, the error in this process increases with decreasing analyte concentration, a consequence of this diffusion-limited process. This suggested that by using higher applied transmembrane potentials to electrophoretically drive the analyte to the nanopore tip, or by stirring the solutions to increase convection, the response time of the nanopore sensor could be improved.
 | ||
| Fig. 16 I–V curves for the streptavidin sensor in the presence of no protein (×), 100 nM lysozyme (◇), and 180 pM streptavidin (△). The membrane material was poly(ethylene terephthalate) with a single conical nanopore into which was deposited a conical Au nanotube | ||
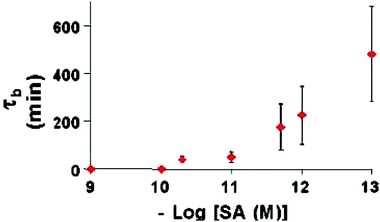 | ||
| Fig. 17 Blockage time vs. –log of the molar SA concentration. The error bars are associated with three replicated measurements done with three different identical nanotube sensors. Membrane as per Fig. 16. | ||
The generality of this sensor design was demonstrated by detecting horse IgG, and by detecting the toxic protein ricin (Fig. 18 and 19, respectively). In the case of horse IgG, the nanopore walls of a conical gold nanotube were modified with Protein G. Protein G binds IgG’s from different species with different affinities. Specifically, Protein G binds horse IgG, but not cat IgG. In the case of 10 nm cat IgG, upon addition to solution, no change in the current–voltage response of the nanopore was observed. When 10 nm horse IgG was added to the solution, the transmembrane ion current was blocked. In the case of ricin, the surface of a conical gold nanotube was modified with an antibody to ricin. When 100 nM of bovine serum albumin (BSA) was added to the solution, no change in the current–voltage response was observed. However, when 100 nM of ricin was added the transmembrane ion current was blocked. These examples demonstrate the generality of this sensing paradigm.
 | ||
| Fig. 18 I–V curves for the horse IgG sensor in the presence of no protein (×), 10 nM cat IgG (◇), and 10 nM horse IgG (Δ). Membrane as per Fig. 16. | ||
 | ||
| Fig. 19 I–V curves for the ricin sensor in the presence of no protein (×), 100 nM cat BSA (◇), and ∼100 nM ricin (○). Membrane as per Fig. 16. | ||
4.2 Resistive-pulse sensing with TPPS16
We have also explored the use of bare conical nanopores fabricated in polyimide as resistive-pulse sensors, in analogy sensing designs that incorporate the biological nanopore α-HL as a stochastic sensor. The conical nanopore membrane was placed between two electrolyte solutions and an applied transmembrane potential was used to drive an ion current through the electrolyte-filled nanopore. The analyte examined, 4,4′,4″,4‴-(porphine-5,10,15,20-tetrayl)tetrakis(benzenesulfonic acid) (TPPS), is a tetravalent anion, and it was added to the solution facing the nanopore tip opening. As a result, at sufficiently high values of positive applied transmembrane potentials, TPPS can be driven electrophoretically into the tip opening (at positive potentials the anode was on the side of the conductivity cell that contacts the base of the conical nanopore). This resulted in downward current pulses in the current–time transient.If no analyte was added to the buffer solutions in contact with the nanopore membrane, application of a constant transmembrane potential difference causes a steady-state ion current to flow through the pore. As would be expected, the magnitude of this current increased with the applied transmembrane potential (Fig. 20). Fig. 21 shows current–time traces in the presence of 60 nM TPPS (added to the solution facing the nanopore tip). At applied transmembrane potentials below ∼300 mV, steady-state current–time traces were again observed (Fig. 21a). This was because the nanopore was cation permselective in the electrolyte solution used here,52,82 and the anionic TPPS was electrostatically repelled from the nanopore.86 In addition, the analyte pays an entropic penalty for entering such a narrow pore. For these reasons, at potentials below a threshold voltage of ∼300 mV, TPPS had no effect on the current–time trace (Fig. 21a). This threshold voltage phenomenon had also been observed for DNA translocation in the α-hemolysin nanopore.86
 | ||
| Fig. 20 Current–time recordings of the conical nanopore with 1 M KCl (pH = 8.0) solutions on both sides of the membrane. The transmembrane potential was (a) 100 mV and (b) 400 mV. The membrane material was polyimide. | ||
 | ||
| Fig. 21 Current–time recordings for the conical nanopore in the presence of 60 nM TPPS. The transmembrane potential was (a) 100 mV, (b) 400 mV, (c) 500 mV, and (d) 600 mV. The membrane material was polyimide. | ||
At larger values of positive applied transmembrane potential the electrostatic and entropic barriers could be overcome, and TPPS could be driven electrophoretically into the nanopore tip opening. Because the diameter of the TPPS molecule (∼2 nm) was comparable to the diameter of the tip opening (∼4.5 nm), TPPS experiences hindered diffusion in the nanopore tip. Indeed, theory predicts that its diffusion coefficient in the tip was ∼10 times smaller than its bulk-solution value. Because the hydrated K+ ion is much smaller (diameter ∼0.3 nm), its diffusion was not hindered in the nanopore tip, and charge was carried through the nanopore by these much more mobile K+ ions. However, the large and relatively immobile TPPS molecules partially occlude the pathways that the K+ ions use to carry charge through the nanopore. As a result downward current blocks were observed (Fig. 21b–d) in the presence of the analyte TPPS—resistive-pulse sensing.
In this detection technique, the duration of an occlusion event was determined by the time it takes the analyte to translocate the nanopore sensing element.22 While this was also true for the conical nanopore system studied here, the electric-field focusing effect discussed above means that the relevant time was the time required for the analyte to translocate the sensing zone, and not the time required for the analyte to translocate the entire length of the pore. The event-duration data were analyzed via plots of the number of times an event of a particular duration was observed vs. the event duration (Fig. 22). At the lowest value of applied transmembrane potential (400 mV), the distribution was much broader than reported for translocation of analytes through the α-HL nanopore. Both entropic and electrostatic interactions were expected to contribute significantly to the dynamics of translocation with our system. The breadth of the distribution observed may result from these complex interactions of the highly charged TPPS molecule with the walls of the conical nanopore. At larger values of applied transmembrane potential, the event-duration distribution narrows, and shifts to shorter times (e.g., Fig. 22c).
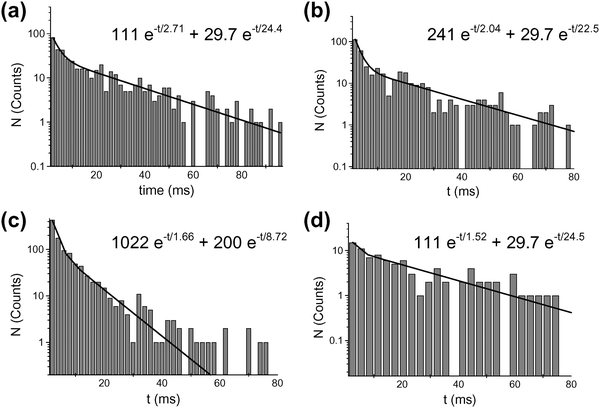 | ||
| Fig. 22 Histograms of event duration for the conical nanopore in the presence of 60 nM (a–c) and 20 nM (d) TPPS. The transmembrane potential was (a) 400 mV, (b) 500 mV, (c) 600 mV, and (d) 400 mV. The membrane material was polyimide. | ||
The electrophoretic velocity (v) of an ion is related to the electric field strength (E) via87
| v = |z|eE/6πηr | (6) |
These studies further examined the population of states and concentration dependence of translocation events. This work demonstrated for the first time that a small molecule was detected using a synthetic nanopore in a resistive-pulse fashion. It further demonstrated that many of the principles of resistive-pulse sensors that are based on biological nanopores can be extended to studies with abiotic conical nanopore membranes.
5. Conclusions and future aspects
The conical nanopores described here offer a flexible venue to develop synthetic ion channel mimics and chemical or biochemical sensors. A number of advantages for conical nanopores relative to cylindrical nanopores exist. Most importantly, with the conical nanopore the voltage drop engendered by the ion current is focused to the tip of the nanopore, thus forming a sensing zone for analyte detection. In addition, the ion current through the conical nanopore can be orders of magnitude larger than in a cylindrical nanopore with diameter equivalent to the diameter of the tip opening of the conical pore. Finally, the conical pore should be less susceptible to unwanted fouling than a cylindrical pore of comparable size.The track-etch method used to prepare the conical nanopores described here also offers some advantages relative to the methods used to prepare other prototype abiotic nanopores for sensor development. First, the track-etch method is a well-known and commercially practiced method for preparing nanopore membranes. Second, the chemical etch procedure used to produce the conically shaped pore requires no specialized or expensive equipment.
Finally, we believe these conical nanopore sensors offer some advantages relative to the α-hemolysin nanopore used for most resistive-pulse sensing experiments. Most importantly, the fragile supported lipid bilayer membrane is eliminated and replaced with a durable polymeric membrane. Because of its fragility, sensor life is prohibitively short with the bilayer membrane, and this is not the case with the polymer membrane. Also, the tip size of the conical nanopore can be modulated to match the size of the analyte, a feat not easily accomplished with biological nanopores. Remarkably, much larger transmembrane potentials can be applied with the polymeric membrane. Since the number of events is related to analyte concentration, it is in principle possible to detect lower concentrations of ionic analytes using higher values of applied transmembrane potential with the polymer nanopore system.
An advantage of the α-hemolysin nanopore is that it can be genetically or chemically engineered to place a selective binding site at a precise location within the lumen of the pore. In this review we have also discussed studies in which conical Au nanotubes were deposited in conical nanopores. This allowed highly selective sensors to be obtained by attaching to the nanopore a molecular-recognition agent that selectively binds the target analyte. These studies make it clear that greater selectivity can be imparted to conical nanopores with appropriate chemical or biochemical functionalization.
We are currently developing more sophisticated “smart” conical nanopores, expanding on this paradigm that has proved so successful with the α-HL based resistive-pulse sensors.
Acknowledgements
We wish to acknowledge past and present members of the Martin group whose work has contributed to this review. Aspects of this work have been funded by the National Science Foundation and the Defense Advanced Research Projects Agency.References
- B. Alberts, D. Bray, J. Lewis, M. Raff, K. Roberts and J. D. Watson, Molecular Biology of the Cell, Garland Publishing, New York, 4th edn, 2002 Search PubMed.
- B. Hille, Ion Channels of Excitable Membranes, Sinauer, Sunderland, 2001 Search PubMed.
- J. Li, D. Stein, C. McMullan, D. Branton, M. J. Aziz and J. A. Golovchenko, Nature, 2001, 412, 166–169 CrossRef CAS.
- D. W. Deamer and D. Branton, Acc. Chem. Res., 2002, 35, 817–825 CrossRef CAS.
- J. Li, M. Gershow, D. Stein, E. Brandin and J. A. Golovchenko, Nat. Mater., 2003, 2, 611–615 CrossRef CAS.
- J. Li, D. Stein, C. Qun, E. Brandin, A. Huang, H. Wang, D. Branton and J. Golovchenko, Biophys. J., 2003, 84, 134a Search PubMed.
- L. Sun and R. M. Crooks, J. Am. Chem. Soc., 2000, 122, 12340–12345 CrossRef CAS.
- R. R. Henriquez, T. Ito, L. Sun and R. M. Crooks, Analyst, 2004, 129, 478–482 RSC.
- A. J. Storm, D. van den Broek, S. Lemay and C. Dekker, Biophys. J., 2002, 82, 52a.
- A. J. Storm, J. H. Chen, X. S. Ling, H. W. Zandbergen and C. Dekker, Nat. Mater., 2003, 2, 537–540 CrossRef CAS.
- A. J. Storm, C. Storm, J. H. Chen, H. Zandbergen, J. F. Joanny and C. Dekker, Nano Lett., 2005, 5, 1193–1197 CrossRef CAS.
- A. J. Storm, J. H. Chen, H. W. Zandbergen and C. Dekker, Phys. Rev. E: Stat. Phys., Plasmas, Fluids, Relat. Interdiscip. Top., 2005, 71, 051903 CrossRef CAS.
- O. A. Saleh and L. L. Sohn, Rev. Sci. Instrum., 2001, 72, 4449–4451 CrossRef CAS.
- O. A. Saleh and L. L. Sohn, Nano Lett., 2003, 3, 37–38 CrossRef CAS.
- O. A. Saleh and L. L. Sohn, Proc. Natl. Acad. Sci. U. S. A., 2003, 100, 820–824 CrossRef CAS.
- E. A. Heins, Z. S. Siwy, L. A. Baker and C. R. Martin, Nano Lett., 2005, 5, 1824–1829 CrossRef CAS.
- E. A. Heins, L. A. Baker, Z. S. Siwy, M. Mota and C. R. Martin, J. Phys. Chem. B, 2005, 109, 18400–18407 CrossRef CAS.
- A. Mara, Z. S. Siwy, C. Trautmann, J. Wan and F. Kamme, Nano Lett., 2004, 4, 497–501 CrossRef CAS.
- K. Healy, B. Schiedt, Z. S. Siwy, A. P. Morrison and R. Neumann, Biophys. J., 2005, 88, 660a.
- L. Song, M. R. Hobaugh, C. Shustak, S. Cheley, H. Bayley and J. E. Gouaux, Science, 1996, 274, 1859–1865 CrossRef CAS.
- O. Braha, B. Walker, S. Cheley, J. J. Kasianowicz, L. Z. Song, J. E. Gouaux and H. Bayley, Chem. Biol., 1997, 4, 497–505 CrossRef CAS.
- H. Bayley and C. R. Martin, Chem. Rev., 2000, 100, 2575–2594 CrossRef CAS.
- O. Braha, L. Q. Gu, L. Zhou, X. F. Lu, S. Cheley and H. Bayley, Nat. Biotechnol., 2000, 18, 1005–1007 CrossRef CAS.
- L. Q. Gu and H. Bayley, Biophys. J., 2000, 79, 1967–1975 CrossRef CAS.
- L. Movileanu, S. Howorka, O. Braha and H. Bayley, Nat. Biotechnol., 2000, 18, 1091–1095 CrossRef CAS.
- H. Bayley and P. S. Cremer, Nature, 2001, 413, 226–230 CrossRef CAS.
- S. Howorka, S. Cheley and H. Bayley, Nat. Biotechnol., 2001, 19, 636–639 CrossRef CAS.
- S. Howorka, L. Movileanu, O. Braha and H. Bayley, Proc. Natl. Acad. Sci. U. S. A., 2001, 98, 12996–13001 CrossRef CAS.
- L. Movileanu and H. Bayley, Proc. Natl. Acad. Sci. U. S. A., 2001, 98, 10137–10141 CrossRef CAS.
- S. Howorka, J. Nam, H. Bayley and D. Kahne, Angew. Chem., Int. Ed., 2004, 43, 842–846 CrossRef CAS.
- S. Howorka, L. Movileanu, X. F. Lu, M. Magnon, S. Cheley, O. Braha and H. Bayley, J. Am. Chem. Soc., 2000, 122, 2411–2416 CrossRef CAS.
- H. Bayley and L. Jayasinghe, Mol. Membr. Biol., 2004, 21, 209–220 CrossRef CAS.
- Y. Astier, O. Braha and H. Bayley, J. Am. Chem. Soc., 2006, 128, 1705–1710 CrossRef CAS.
- J. J. Kasianowicz, E. Brandin, D. Branton and D. W. Deamer, Proc. Natl. Acad. Sci. U. S. A., 1996, 93, 13770–13773 CrossRef CAS.
- A. Meller, L. Nivon, E. Brandin, J. Golovchenko and D. Branton, Proc. Natl. Acad. Sci. U. S. A., 2000, 97, 1079–1084 CrossRef CAS.
- A. Meller, L. Nivon and D. Branton, Phys. Rev. Lett., 2001, 86, 3435–3438 CrossRef CAS.
- S. Howorka, S. Cheley, L. Movileanu, O. Braha and H. Bayley, Biophys. J., 2002, 82, 508a.
- L. Movileanu, S. Cheley and H. Bayley, Biophys. J., 2003, 85, 897–910 CrossRef CAS.
- T. C. L. Sutherland, Y.-T. Stefureac, R.-I. Bediako-Amoa, I. Kraatz and H.-B. Lee J. S., Nano Lett., 2004, 4, 1273–1277 CrossRef CAS.
- O. A. Saleh and L. L. Sohn, Biophys. J., 2003, 84, 293a.
- T. Ito, L. Sun, R. R. Henriquez and R. M. Crooks, Acc. Chem. Res., 2004, 37, 937–945 CrossRef CAS.
- J. D. Uram, K. Ke, A. J. Hunt and M. Mayer, Angew. Chem., Int. Ed., 2006, 45, 2281–2285 CrossRef CAS.
- P. Y. Apel, Y. E. Korchev, Z. S. Siwy, R. Spohr and M. Yoshida, Nucl. Instrum. Methods Phys. Res., Sect. B, 2001, 184, 337–346 CrossRef CAS.
- Z. S. Siwy, Y. C. Gu, H. A. Spohr, D. Baur, A. Wolf-Reber, R. Spohr, P. Apel and Y. E. Korchev, Biophys. J., 2002, 82, 266a.
- C. C. Harrell, Z. S. Siwy and C. R. Martin, Small, 2006, 2, 194–198 CrossRef CAS.
- E. D. Steinle, D. T. Mitchell, M. Wirtz, S. B. Lee, V. Y. Young and C. R. Martin, Anal. Chem., 2002, 74, 2416–2422 CrossRef CAS.
- C. C. Harrell, P. Kohli, Z. S. Siwy and C. R. Martin, J. Am. Chem. Soc., 2004, 126, 15646–15647 CrossRef CAS.
- Z. S. Siwy, E. Heins, C. C. Harrell, P. Kohli and C. R. Martin, J. Am. Chem. Soc., 2004, 126, 10850–10851 CrossRef CAS.
- Z. S. Siwy, L. Trofin, P. Kohli, L. A. Baker, C. Trautmann and C. R. Martin, J. Am. Chem. Soc., 2005, 127, 5000–5001 CrossRef CAS.
- R. L. Fleischer, P. B. Price and R. M. Walker, Nuclear Tracks in Solids, University of California Press, Berkeley, CA, 1975 Search PubMed.
- R. Spohr, Ions Tracks and Microtechnology Principles and Application, Verlegsgschaft mbH, Braunschweig, 1990 Search PubMed.
- Z. S. Siwy, P. Apel, D. Baur, D. D. Dobrev, Y. E. Korchev, R. Neumann, R. Spohr, C. Trautmann and K. O. Voss, Surf. Sci., 2003, 532, 1061–1066 CrossRef.
- Z. S. Siwy, D. Dobrev, R. Neumann, C. Trautmann and K. Voss, Appl. Phys. A: Mater. Sci. Process., 2003, 76, 781–785 CrossRef CAS.
- S. Lee, Y. H. Zhang, H. S. White, C. C. Harrell and C. R. Martin, Anal. Chem., 2004, 76, 6108–6115 CrossRef CAS.
- L. Trofin, S. B. Lee, D. T. Mitchell and C. R. Martin, J. Nanosci. Nanotechnol., 2004, 4, 239–244 Search PubMed.
- Z. S. Siwy, I. D. Kosinska, A. Fulinski and C. R. Martin, Phys. Rev. Lett., 2005, 94, 048102 CrossRef CAS.
- L. A. Baker, P. Jin and C. R. Martin, Crit. Rev. Solid State, 2005, 30, 183–205 Search PubMed.
- C. R. Martin, Science, 1994, 266, 1961–1966 CrossRef CAS.
- M. Nishizawa, V. P. Menon and C. R. Martin, Science, 1995, 268, 700–702 CrossRef CAS.
- C. R. Martin, Acc. Chem. Res., 1995, 28, 61–68 CrossRef CAS.
- C. R. Martin, Chem. Mater., 1996, 8, 1739–1746 CrossRef CAS.
- J. C. Hulteen, V. P. Menon and C. R. Martin, J. Chem. Soc., Faraday Trans., 1996, 92, 4029–4032 RSC.
- B. B. Lakshmi, P. K. Dorhout and C. R. Martin, Chem. Mater., 1997, 9, 857–862 CrossRef CAS.
- B. B. Lakshmi, C. J. Patrissi and C. R. Martin, Chem. Mater., 1997, 9, 2544–2550 CrossRef CAS.
- K. B. Jirage, J. C. Hulteen and C. R. Martin, Science, 1997, 278, 655–658 CrossRef CAS.
- G. L. Che, B. B. Lakshmi, E. R. Fisher and C. R. Martin, Nature, 1998, 393, 346–349 CrossRef CAS.
- S. A. Sapp, D. T. Mitchell and C. R. Martin, Chem. Mater., 1999, 11, 1183–1185 CrossRef CAS.
- C. R. Martin and D. T. Mitchell, J. Electroanal. Chem. Interfacial Electrochem., 1999, 21, 1–74 CAS.
- M. Wirtz, S. F. Yu and C. R. Martin, Analyst, 2002, 127, 871–879 RSC.
- S. B. Lee, D. T. Mitchell, L. Trofin, T. K. Nevanen, H. Soderlund and C. R. Martin, Science, 2002, 296, 2198–2200 CrossRef CAS.
- M. Wirtz and C. R. Martin, Adv. Mater., 2003, 15, 455–458 CrossRef CAS.
- C. R. Martin and P. Kohli, Nat. Rev. Drug Discovery , 2003, 2, 29–37 CrossRef CAS.
- P. Kohli and C. R. Martin, Drug News Perspect., 2003, 16, 566–573 Search PubMed.
- V. P. Menon and C. R. Martin, Anal. Chem., 1995, 67, 1920–1928 CrossRef CAS.
- C. R. Martin, M. Nishizawa, K. B. Jirage and M. Kang, J. Phys. Chem. B, 2001, 105, 1925–1934 CrossRef CAS.
- C. C. Harrell, S. B. Lee and C. R. Martin, Anal. Chem., 2003, 75, 6861–6867 CrossRef CAS.
- J. C. Hulteen, K. B. Jirage and C. R. Martin, J. Am. Chem. Soc., 1998, 120, 6603–6604 CrossRef CAS.
- K. B. Jirage, J. C. Hulteen and C. R. Martin, Anal. Chem., 1999, 71, 4913–4918 CrossRef CAS.
- S. B. Lee and C. R. Martin, Anal. Chem., 2001, 73, 768–775 CrossRef CAS.
- L. Stryer, Biochemistry, W.H. Freeman & Company, New York, 1995 Search PubMed.
- Z. S. Siwy, Y. Gu, H. A. Spohr, D. Baur, A. Wolf-Reber, R. Spohr, P. Apel and Y. E. Korchev, Europhys. Lett., 2002, 60, 349–355 CrossRef CAS.
- Z. S. Siwy, P. Apel, D. Dobrev, R. Neumann, R. Spohr, C. Trautmann and K. Voss, Nucl. Instrum. Methods Phys. Res., Sect. B, 2003, 208, 143–148 CrossRef CAS.
- S. M. Bezrukov and J. J. Kasianowicz, Eur. Biophys. J., 1997, 26, 471–476 CrossRef CAS.
- S. M. Bezrukov, O. V. Krasilnikov, L. N. Yuldasheva, A. M. Berezhkovskii and C. G. Rodrigues, Biophys. J., 2004, 87, 3162–3171 CrossRef CAS.
- O. V. Krasilnikov and S. M. Bezrukov, Macromolecules, 2004, 37, 2650–2657 CrossRef CAS.
- S. E. Henrickson, M. Misakian, B. Robertson and J. J. Kasianowicz, Phys. Rev. Lett., 2000, 85, 3057–3060 CrossRef CAS.
- A. J. Bard and L. R. Faulkner, Electrochemical Methods, John Wiley & Sons, New York, 2nd edn, 2001 Search PubMed.
Footnote |
| † The HTML version of this article has been enhanced with additional colour images. |
| This journal is © the Owner Societies 2006 |
