Electrochemical bursting oscillations on a high-dimensional slow subsystem
István Z.
Kiss
,
Qing
Lv
,
Levent
Organ
and
John L.
Hudson
*
Department of Chemical Engineering, University of Virginia, 102 Engineers’ Way, 22904-4741, Charlottesville, Virginia, USA. E-mail: hudson@virginia.edu
First published on 28th April 2006
Abstract
Experiments are carried out with a chemical burster, the electrodissolution of iron in sulfuric acid solution. The system exhibits bursting oscillations in which fast periodic spiking is superimposed on chaotic, slow oscillations. Regularization of the slow dynamics, i.e., transition from chaotic to periodic bursting oscillations, is investigated through changes in the experimental parameters (circuit potential, external resistance, and electrode diameter). These transitions are accompanied by changes in the fast dynamics; a ‘Hopf–Hopf’ spiking is transformed to ‘homoclinic-Hopf’ spiking. The periodic bursting is destroyed through a period lengthening process in which the fast spiking region extends to a large fraction of the slow oscillatory cycle until there is no clear distinction between the fast and slow oscillations. Finally, it is shown that the time-scales of the fast spiking and, to a lesser extent, of the slow oscillations (or the occurrence of fast spiking) can be controlled with periodic perturbation of an experimental parameter, the circuit potential.
1. Introduction
Bursting oscillations are characterized by a complex waveform in which slow, ‘silent’ dynamics are interrupted by fast, repetitive spiking.1 Several types of waveforms have been observed in biological systems, e.g., ‘parabolic’ bursting of neuronal pacemakers,2 ‘square wave’ bursting of insulin secreting pancreatic β cells,3,4 or the ‘elliptic’ bursting of rodent trigeminal interneurons.5 Although bursting was originally observed and studied in biology, it also occurs in a variety of physical6 and chemical systems.7–9 For example, electrochemical bursting oscillations have been reported during H2O2 reduction on platinum,10,11 iron dissolution in sulfuric acid with halogen additives12,13 and with dichromate ions coupled with graphite or zinc electrodes.14 A possible mechanism of bursting in electrochemical systems has been developed based on a polarization scan with two negative slopes and a (hypothetical) slow variable.15A mathematical description and a formal classification of bursting dynamics in neurons were proposed by Rinzel1 and later extended by Izhikevich.16 The essential variables describing the bursting dynamics can be divided into slow and fast depending on the timescales over which they vary.1 The fast subsystem, described by a minimum of two variables, is responsible for the fast spiking. The slow subsystem is responsible for the slow modulation causing the periodic appearance of the fast spiking behavior. In the simplest case the slow subsystem consists of one slow variable and thus the simplest neural models incorporate two fast and one slow variables. A systematic characterization of such low-dimensional bursting has been carried out based on the possible bifurcation structure of the fast subsystem as a function of the (constant) slow variable.16 The bursters are named after the bifurcation of the fast subsystem that leads to the repetitive spiking from the quiescent state and the bifurcation of the spiking attractor that leads to the quiescent state. For example, if the repetitive spikings occur through a supercritical Hopf bifurcation and disappear through a homoclinic bifurcation the burster is called a ‘Hopf-homoclinic’ type. (This classification is convenient for nomenclature purposes. However, all parameters are held constant and thus no bifurcations in the traditional sense take place. Rather the characteristics of the complex waveform change as a function of a slowly changing variable.) Several (over one hundred) bursting waveforms, many not yet reported in experiments and realistic model equations, have been identified.
However, some biological bursting activities exhibit high-dimensional behavior. Many cells, such as the lateral pyloric and pyloric dilator in the stomatogastric central pattern generator of the California spiny lobster have, when isolated from their natural connections, a highly irregular spiking–bursting activity.17–20 Nonlinear analyses of the membrane potential time series registered in these neurons show the chaotic nature of the isolated cells.19 This complex behavior implies that high-dimensional fast or slow subsystems could play an important role in bursting dynamics.
In this paper a chemical bursting oscillator is presented with an inherently high-dimensional, chaotic slow subsystem. The dynamics of the slow and fast subsystems are characterized with wavelet transform and interspike histograms. A transition is described from chaotic to periodic bursting as experimental conditions such as applied potential, external resistance, and electrode size are varied. The ability of the burster to entrain to high- and low-frequency external signals, that have frequencies similar to that inherent dynamics, is studied with periodic perturbation of the circuit potential.
2. Experimental
A schematic of the experimental apparatus is shown in Fig. 1. A standard three-compartment electrochemical cell consisting of a downward-facing iron working electrode (99.995% purity, metals basis, Alfa Aesar), an Hg/Hg2SO4 reference electrode with saturated K2SO4 salt bridge solution (Radiometer Analytical), and a platinum mesh counter electrode were used. The iron wire electrode is embedded in Ellsworth Epoxy Resin (activator W, adhesive C-7) and the reactions take place only at the end; the electrode is connected to the potentiostat through an external resistance Rext. The potential of the electrode was controlled by a potentiostat (EG&G PAR 273). The current of the electrode was measured by a Zero Resistance Ammeter. The data was acquired by the DAS-1802HC (Keithley) plug-in board and recorded by a computer. The electrolyte solutions were prepared from certified ACS plus grade H2SO4 (Fisher Scientific) and de-ionized H2O.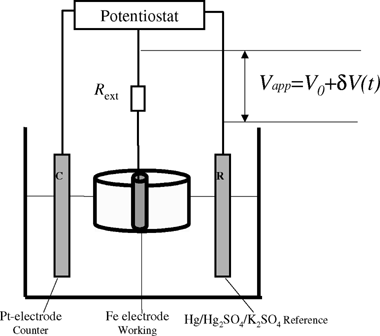 | ||
| Fig. 1 Schematic of the experimental apparatus. | ||
Before each experiment, the electrolyte solution was bubbled with nitrogen for 10 min. The working electrode was wet polished by 240, 320, 400, 600, 800 and 1200 grit polishing papers sequentially. After the polishing, the electrode was rinsed with de-ionized H2O and placed into the solution in a downward facing position. The potential (V) is swept from rest potential (−0.95 V) at a rate of 1 mV s−1 to the target potential and data were recorded at fixed potential.
In the forcing experiment, a single 0.5-mm iron electrode connected with a 1000-Ω individual resistance was dissolved in 1 mol L−1 H2SO4. The electrode was held at the applied potential (Vapp) with a potentiostat. As shown in Fig. 1, the applied potential was the sum of a constant potential (V0) and a perturbation [δV(t) = A sin 2πΩft] due to forcing. The forcing signal was generated by a function generator (HP-33120A).
3. Results
A. Effects of experimental parameters on regularity of bursting oscillations
Two general types of bursting behavior were observed in experiments with different experimental conditions (such as electrode size, applied potential, and external resistance); examples of irregular and regular bursting oscillations are shown in Fig. 2a and d, respectively. A common feature is the occurrence of oscillations that have separate timescales: slow and very fast oscillations alternate. An efficient analysis of a complex signal composed of multiple frequency components can be done with a wavelet analysis. The wavelet transform of signal s(t) gives high resolution instantaneous amplitude of oscillations of the various frequency components.21 | (1) |
 | (2) |
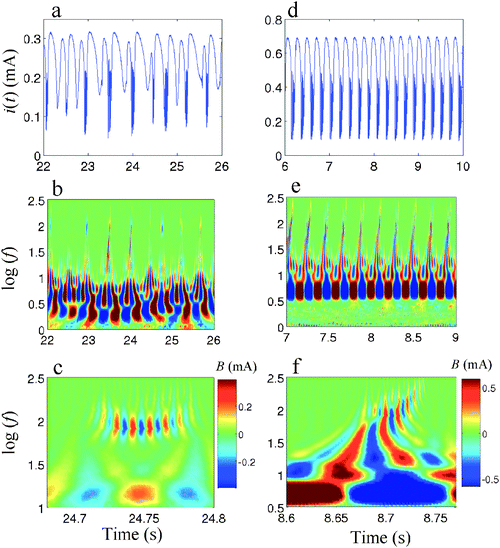 | ||
| Fig. 2 Irregular (left column, d = 1 mm, cH2SO4 = 0.5 M, Rext = 100 Ω, V = −0.19 V) and regular (right column, electrode diameter d = 0.5 mm, cH2SO4 = 0.5 M, Rext = 602 Ω, V = −0.20 V) bursting behavior. (a–b) Current vs. time. (c–f) Wavelet transform of current in a color coded plot (color denotes amplitudes B(t,f) of the transform). | ||
The separation of the timescales in the bursting waveform can then be visualized with the wavelet transform. The instantaneous amplitudes of the (Morlet) frequencies in the 1–200 Hz range for the irregular bursting are shown in Fig. 2b. The irregular, slow oscillations span the frequency range 1–10 Hz. (Large oscillations amplitudes are shown by red color.) The high frequency (about 100 Hz) oscillations vary in the number of spikes and amplitudes; for better visualization a zoom to the 100 Hz region is shown for a fast spike at 24.8 s in Fig. 2c.
For comparison, the wavelet analysis is also presented for the periodic bursting oscillations in Fig. 2e and f. The periodic bursting exhibits well-defined low frequency oscillations (see Fig. 2e) with a frequency about 20 Hz. The fast oscillations for the periodic bursting (Fig. 2f) show very different structure from those in chaotic bursting (Fig. 2c); they span a larger frequency range from 50 to 250 Hz and thus the low- and high-frequency components are not as separate as those with irregular oscillations. The wavelet analysis thus confirms the existence of two timescales and also shows that the fast and slow behavior in the periodic and chaotic bursting are quite different.
The waveform of the bursting oscillations can further be illustrated by considering the waveform of the slow and fast oscillations separately, i.e., by looking at the low-pass and high-pass filtered signals, respectively.
A reconstructed attractor of the slow oscillations for irregular bursting is shown in a 3-D projection of phase space in Fig. 3a. (The solid triangles indicate the locations of beginnings of individual bursts.) The slow behavior is reminiscent of the low-dimensional chaotic behavior seen in iron dissolution without bursting;22,23 a recent analysis has shown that the oscillations have a strong non-phase coherent nature.24,25 (We obtained an embedding dimension of 3 and correlation dimension of 2.5 for the attractor shown in Fig. 3a but these numbers should be taken with caution because the calculations were done using the data after a low pass filter.) The fast spikes do not occur in every cycle of the slow oscillations but rather in a limited region of the phase space on the attractor. This implies that the irregular occurrence of spiking has a dynamical rather than a stochastic character although stochastic effects from system noise cannot be excluded.
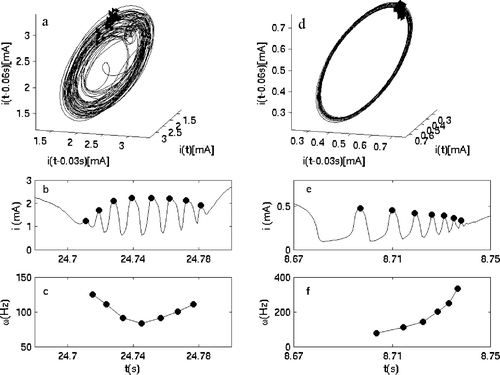 | ||
| Fig. 3 Features of typical fast dynamics in irregular (left column) and regular (right column) bursting. (a) Reconstructed attractor with time-delay coordinates of the low-pass filtered current in irregular bursting region. Triangles show the occurrence of fast spikes. (b) Time series of current in irregular bursting. (c) Time series of instantaneous frequency in irregular bursting. (d) Reconstructed attractor with time-delay coordinates of the low-pass filtered current in regular bursting region. (e) Time series of current in regular bursting. (f) Time series of instantaneous frequency in regular bursting. | ||
The time series of current of a typical spiking in irregular bursting (see Fig. 3b—the solid circles mark the maximum of the spikes inside the burst) shows that the fast spikes start and end with a small amplitude and a well-defined frequency; these characteristics imply that the beginning and cessation of spiking in the fast subsystem are consistent with the occurrence of two supercritical Hopf bifurcations. The instantaneous frequencies (defined as the reciprocals of the time intervals between two neighboring maxima) in a burst (Fig. 3c) as well as the amplitudes (Fig. 3b) exhibit a parabolic shape.
In regular bursting, the slow oscillation is periodic (Fig. 3d) and bursts occur in every cycle at approximately the same spot on the attractor. The fast spiking (Fig. 3e) starts with large period and constant amplitude. These are characteristics of a homoclinic bifurcation. (We note that similar hard transition could be obtained with a subcritical Hopf bifurcation, however, in that case the period lengthening observed in Fig. 3e would not necessarily be seen.) The cessation of the spiking occurs with small amplitude and finite frequency similar to a supercritical Hopf bifurcation. The frequencies (Fig. 3f) as well as the amplitudes (Fig. 3e) exhibit monotonically changing trends.
To investigate the effects of different experimental conditions on the bursting dynamics, particularly, how the transitions from bursting to a stationary state (through variation in potential) and from irregular to regular bursting (through changes in electrode size and external resistance) take place, series of experiments were carried out by varying a single experimental parameter while holding the other parameters constant.
Typical time series of currents are shown in Fig. 4a, b, and c at three different circuit potentials. The starting state is a periodic bursting behavior (see Fig. 4a). At larger potential the slow waveform changes to period-2 character (Fig. 4b): every other slow oscillation has the same amplitude and, in addition, fast spiking occurs in every other slow oscillation. At even larger circuit potential (Fig. 4c) the period-2 character of the slow oscillation remains but the spiking region becomes larger and there is an increase of the period of the overall cycle.
 | ||
| Fig. 4 The effect of circuit potential (V) on bursting dynamics. The data are obtained from slow scans (scan speed = 1 mV s−1). (a) Time series of current at V = −0.17 V. (The potential is the mean potential over the time interval.) (b) Time series of current at V = −0.15 V. (c) Time series of current at V = −0.13 V. (d) The period of low pass filtered current as a function of potential. (e) Current vs. potential near passivation. (d = 0.5 mm, cH2SO4 = 0.5 M, Rext = 602 Ω.) | ||
To explore the effects of potential on the slow oscillations, the current was filtered by a low pass FFT filter with a cutoff frequency of 8 Hz. The Hilbert transform of the low pass current (i) was used for the definition of phase:27–29
 | (3) |
 | (4) |
 | ||
| Fig. 5 The effect of electrode size (d) on bursting dynamics. Time series of currents (left column) and histogram of interburst intervals (right column) at different electrode sizes. cH2SO4 = 0.5 M. (a–b) Strongly irregular bursting at d = 2 mm. ARext = 1.25 Ω cm2. V = −0.03 V. (c–d) Irregular bursting, d = 1 mm, ARext = 1.02 Ω cm2. V = −0.19 V. (e–f) Regular bursting at d = 0.5 mm. ARext = 1.18 Ω cm2. V = −0.20 V. | ||
 | ||
| Fig. 6 The effect of potential drop in the electrolyte and external resistance on bursting dynamics: standard deviation of interburst intervals vs. specific resistance. (a) The effect of potential drop in the electrolyte (d = 0.5, 1, and 2 mm, ARext = 1.18, 1.02, and 1.25 Ω cm2, respectively). (b) The effect of potential drop in external resistance. d = 1 mm. cH2SO4 = 0.5 M. | ||
External resistance also influences the dynamics of bursting behavior. To produce (bursting) oscillations, a minimal Rext is required; this is characteristic of negative differential resistance electrochemical oscillators.15 Organ et al.31 showed that the system ceases oscillating when Rext exceeds a certain upper limit. The present study of the effect of external resistance was conducted within a range where bursting oscillations could occur. Three parallel experiments with different values of external resistivity (ARext) were carried out with the intermediate size electrode (diameter = 1 mm). The standard deviation of the histogram of interburst interval of the three cases is plotted vs. ARext in Fig. 6b. Small ARext yields more regular behavior (corresponding to a narrower distribution of interburst intervals).
The similarity between the trends in Fig. 6a and b implies a similar effect of electrode size and external resistance; smaller electrode size, and thus smaller current through the cross section of the electrode, and smaller external resistance both induce smaller potential drop. Since the two factors influence the potential drop in the same way, they have the same effect on the bursting dynamics.
B. External entrainment of regular bursting behavior
The entrainability of the periodic bursting dynamics was explored with the imposition of external periodic forcing, high- and low-frequency, in the ranges of the fast and slow dynamics of the bursting oscillations, respectively.The results of small amplitude (A = 9 mV) forcing are shown in left column of Fig. 7. The time series of current when forcing begins and ends are shown in Fig. 7a and b. When forcing is switched on, there is a short transient period of irregular behavior as shown in the time series of current in Fig. 7a. Before forcing ends, the system has reached a steady regular bursting state with slow part frequency Ω = 5.15 Hz, similar to inherent frequency Ω0 = 5.04 Hz, almost unaffected by the forcing signal (Ωf = 6.00 Hz). The phase difference between the oscillator and external forcing was examined. The monotonically increasing phase difference during the forcing period in Fig. 7c suggests that the two signals behave almost independently and entrainment does not occur with this small amplitude forcing.
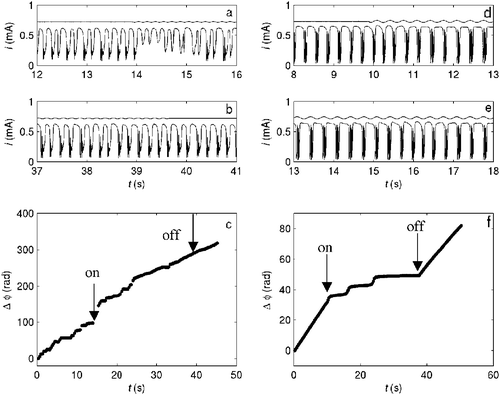 | ||
| Fig. 7 Low-frequency forcing of the circuit potential in the regular bursting region at different amplitudes (A): A = 9 mV (left column, electrode diameter d = 0.5 mm, cH2SO4 = 1 M, Rext = 1000 Ω, V = −0.077 V, Ωf = 6 Hz, Ω0 = 5.04 Hz) and A = 19 mV (right column, d = 0.5 mm, cH2SO4 = 1 M, Rext = 1000 Ω, V = −0.069 V, Ωf = 3 Hz, Ω0 = 3.53 Hz). (a–b) Time series of current during a low-amplitude forcing experiment. The curve above the time series shows the same amplitude and frequency as the circuit potential. (c) Time series of phase difference between forcing signal and current. (A = 9 mV.) (d–e) Time series of current during a large amplitude forcing experiment. (f) Time series of phase difference between forcing signal and current (A = 19 mV). For the electrochemical oscillator, the beginning of the nth burst was considered as the beginning of the nth cycle of the phase, i.e., φn = 2πn. (The phase was calculated as 2πΩft for the sinusoidal forcing signal.) | ||
The time series of current with large amplitude (A = 19 mV) forcing is shown in Fig. 7d. It is again found that the waveform of slow oscillation has slight changes when forcing begins. However, during the forcing interval, partial phase synchronization is observed: the time series of phase difference in Fig. 7f exhibits entrained state with two phase slips. (When a phase slip takes place, there is an additional slow oscillation for a forcing period as shown in Fig. 7e at about 16 s.)
When the forcing frequency Ωf was far away from inherent frequency Ω0, irregular bursting behavior with significantly deformed slow oscillation waveform was observed.
 | ||
| Fig. 8 High-frequency forcing of circuit potential in regular bursting region at different amplitude (A). Left column: Time series of current in a single burst (the circle marks the spike with approximately the same frequency as the forcing frequency). Right column: histogram of the instantaneous frequencies of the spikes in all of the recorded bursts. (a–b) Without forcing. A = 0 mV, V = −0.079 V. (c–d) Weak forcing. A = 39 mV, V = −0.079 V, Ωf = 150 Hz. (e–f) Strong forcing. A = 82 mV, V = −0.082 V, Ωf = 160 Hz. (Electrode diameter d = 0.5 mm, cH2SO4 = 1 M, Rext = 1000 Ω.) | ||
When small amplitude (A = 39 mV), high frequency forcing (Ωf = 150 to 160 Hz) was applied, no significant effect of forcing is seen. The time series of current of a single burst and histogram of instantaneous frequency are shown in Fig. 8c and d, respectively. There is only one spike with frequency close to forcing frequency. The histogram gives similar wide distribution of frequency to that without forcing (in Fig. 8b).
With large amplitude (A = 82 mV) forcing, there is a strong effect of forcing. There are 6 spikes with frequency similar to forcing frequency in the single burst shown in Fig. 8e. From an overall perspective, the histogram of instantaneous frequencies in Fig. 8f exhibits a peak at the forcing frequency, which indicates that most of the spikes have a frequency similar to Ωf.
Experiments with different forcing amplitudes were carried out from 38 to 82 mV. With forcing, only certain spikes entrain to the forcing frequency. In Fig. 9, the gray region corresponds to entrained frequency range as a function of the forcing amplitude. With larger amplitude forcing more spikes adjust their frequencies to Ωf and thus the width increases in a similar manner as in the “Arnold tongues” of frequency-locked regions32 of forced periodic oscillators.
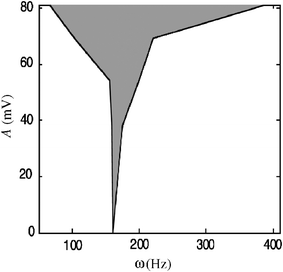 | ||
| Fig. 9 The effect of amplitude of high frequency forcing on the entrainment of fast dynamics: the phase-locked region (shade) in A–ω parameter space. The spikes with similar frequency to Ωf were all marked and the number and time when these spikes appear were recorded for all the bursts. By averaging these values, frequency range was determined in which the spikes entrain to the forcing signal. | ||
4. Discussion
The bursting oscillations develop and cease with changes in an experimental parameter, the circuit potential. At very low potential there is no fast spiking. As the circuit potential is increased, the bursting oscillations appear at a particular phase space region of the attractor. Since fast spiking is limited to a well-defined region in phase space, there exist some unstable periodic orbits that do not enter the critical region. When the trajectory does travel through this critical region the waveform exhibits changes that are similar to bifurcations of low-dimensional dynamical systems with variations of a parameter; it is likely that in the electrodissolution system this ‘parameter’ is a slowly varying dynamical variable. Both the occurrence and the cessation of the fast spiking are similar to supercritical Hopf bifurcations, and thus, following the naming convention of Izhikevich,16 the burster can be considered a chaotic Hopf–Hopf burster. As the circuit potential is increased, the duration of the fast spiking region grows. With further increases of the potential, the fast spiking region changes structure, and the fast spiking starts similar to a homoclinic bifurcation instead of a Hopf; therefore the bursting behavior is now of ‘homoclinic-Hopf’ type.Along with changes of the fast spiking subsystem the characteristics of the slow dynamics are also changed. We have identified several features of the transition between ‘Hopf–Hopf’ and ‘homoclinic-Hopf’ bursters. Since the period of the oscillations of the fast spiking is larger in the homoclinic case (due to the logarithmic increase of period close to a homoclinic bifurcation), the fast spiking region grows during the transition and, along with this process, the slow chaotic behavior is regularized through an inverse period-doubling sequence. We have observed a chaos-period-2–period-1 sequence in the slow dynamics with increase of potential. Therefore, as opposed to the chaotic ‘Hopf–Hopf’ burster, we obtained a periodic ‘homoclinic-Hopf’ burster with increase of potential. With further increase of potential the dynamics remains periodic and an exponential increase of period of the overall dynamics is observed; just before the homoclinic transition to a stationary state (passivation of the metal) the periodic structure breaks down and highly irregular oscillations occur in which it is not possible to differentiate ‘slow’ and ‘fast’ oscillations. The period lengthening of the electrochemical burster is similar to that obtained by Gaspard in a general model of bursting caused by delay.33
By careful changes of other parameters such as electrode size and external resistance, we found a dynamical behavior in which nearly periodic oscillations of the slow chaotic subsystem do not enter the critical region of phase space that produces spiking. These nearly periodic oscillations are likely unstable periodic orbits of the slow chaotic attractor as they occur occasionally, remain periodic for a long time, and eventually lead back to chaos. In this parameter region the occurrence of spikes is rather sporadic and large periods of time can elapse between the occurrences of two spiking regions as a result of a close visit to the unstable periodic orbit. This behavior can be of importance in biological chaotic bursters where the spiking plays an important role; spiking could be controlled to disappear (by stabilizing the stable period-1 orbit) or occur regularly (by stabilizing an unstable periodic orbit that produces fast spiking).
The periodic ‘homoclinic-Hopf’ burster can be entrained to external periodic signals. With an external signal that matches the timescale of the slow (1–10 Hz) oscillations (and thus the period of the overall dynamics) partial/intermittent locking was observed with phase slips; in this system the occurrence of fast spiking was controlled by an external signal at an optimal forcing amplitude. We note, however, that complete phase locking was not observed in the experiments because the large forcing amplitude destroyed the periodic bursting dynamics instead of causing entrainment. With an external signal that matched the timescale of the fast spiking (100 Hz–10 kHz) the period of the fast spikes was controlled; the effect of forcing amplitude revealed an Arnold tongue in which with an increase of forcing amplitude a larger fraction of the spikes became entrained.
The electrochemical metal dissolution system with a high-dimensional chaotic slow subsystem exhibited some dynamical features not seen with bursting behavior of a low-dimensional slow subsystem. The fast and slow subsystems interact with each other and produce chaos regularization through inverse period doubling, sporadic occurrence of spiking regions due to non-spiking unstable period orbits, and period lengthening. Such behaviors can be expected in systems in which there are subsystems of complex dynamics with different timescales, and the subsystems are coupled through essential dynamical species. In the electrochemical system the subsystems are likely to be the iron(II)/iron-oxide(s) system (active/passive) and the iron(II)/iron sulfate system (active dissolution) and the essential species are the iron(II) concentrations and the electrode potential.31 Such coupled systems may especially occur in compartmentalized biological systems (cells) where the diffusion of certain species between the compartments can be strongly enhanced or blocked by the cell membrane.
Acknowledgements
Financial support from National Science Foundation (CTS-0317762) is acknowledged.References
- J. Rinzel, in Mathematical Topics in Population Biology, Morphogenesis and Neurosciences, Springer, Berlin, 1987, pp. 267–281 Search PubMed.
- R. E. Plant, J. Math. Biol., 1981, 11, 15–32 CrossRef CAS.
- T. R. Chay and J. Keizer, Biophys. J., 1983, 42, 181–190 CrossRef CAS.
- M. Pernarowski, R. M. Miura and J. Kevorkian, SIAM J. Appl. Math., 1992, 52, 1627–1650 Search PubMed.
- C. A. Del Negro, C. F. Hsiao, S. H. Chandler and A. Garfinkel, Biophys. J., 1998, 75, 174–182 CrossRef CAS.
- R. Meucci, A. Di Garbo, E. Allaria and F. T. Arecchi, Phys. Rev. Lett., 2002, 88, 144101 CrossRef CAS.
- M. Dolnik and I. R. Epstein, J. Chem. Phys., 1993, 98, 1149–1155 CrossRef CAS.
- K. R. Graziani, J. L. Hudson and R. A. Schmitz, Chem. Eng. J., 1976, 12, 9–21 CrossRef CAS.
- A. C. West, J. Electrochem. Soc., 1993, 140, 403–408 CAS.
- N. Fetner and J. L. Hudson, J. Phys. Chem., 1990, 94, 6506–6509 CrossRef CAS.
- T. G. J. van Venrooij and M. T. M. Koper, Electrochim. Acta, 1995, 40, 1689–1696 CrossRef CAS.
- D. Sazou, M. Pagitsas and C. Georgolios, Electrochim. Acta, 1992, 37, 2067–2076 CrossRef CAS.
- D. Sazou, M. Pagitsas and C. Gerogolios, Electrochim. Acta, 1993, 38, 2321–2332 CrossRef CAS.
- F. D’Alba and C. Lucarini, Bioelectrochem. Bioenerg., 1995, 38, 185–189 CrossRef CAS.
- M. T. M. Koper, Adv. Chem. Phys., 1996, 92, 161–298 CAS.
- E. M. Izhikevich, Int. J. Bifurcation Chaos, 2000, 10, 1171–1266 CrossRef.
- P. Varona, J. J. Torres, R. Huerta, H. D. I. Abarbanel and M. I. Rabinovich, Neural Networks, 2001, 14, 865–875 CrossRef CAS.
- R. C. Elson, R. Huerta, H. D. I. Abarbanel, M. I. Rabinovich and A. I. Selverston, J. Neurophys., 1999, 82, 115–122 Search PubMed.
- H. D. I. Abarbanel, R. Huerta, M. I. Rabinovich, N. F. Rulkov, P. F. Rowat and A. I. Selverston, Neural Computation, 1996, 8, 1567–1602 Search PubMed.
- T. Bal, F. Nagy and M. Moulins, J. Comput. Physiol. A, 1988, 163, 715–727 Search PubMed.
- A. Grossman and J. Morlet, SIAM J. Math. Anal., 1984, 15, 723–736 Search PubMed.
- C. B. Diem and J. L. Hudson, AIChE J., 1987, 33, 218–224 CrossRef CAS.
- M. U. Kleinke, J. Phys. Chem., 1995, 99 Search PubMed.
- M. C. Romano, M. Thiel, J. Kurths, I. Z. Kiss and J. L. Hudson, Europhys. Lett., 2005, 71, 466–472 CrossRef CAS.
- I. Z. Kiss, Q. Lv and J. L. Hudson, Phys. Rev. E, 2005, 71 Search PubMed.
- K. Krischer, in Advances in Electrochemical Science and Engineering, ed. R. C. Alkire, Wiley-VCH Verlag, 2002, vol. 8, pp. 89–208 Search PubMed.
- A. S. Pikovsky, M. G. Rosenblum, G. V. Osipov and J. Kurths, Physica D, 1997, 104, 219–238 CrossRef.
- I. Z. Kiss and J. L. Hudson, Phys. Chem. Chem. Phys., 2002, 4, 2638–2647 RSC.
- I. Z. Kiss and J. L. Hudson, Phys. Rev. E, 2001, 64, 046215 CrossRef.
- S. H. Glarum and J. Marsahll, J. Electrochem. Soc., 1985, 132, 2872 CAS.
- L. Organ, I. Z. Kiss and J. L. Hudson, J. Phys. Chem. B, 2003, 107, 6648–6659 CrossRef CAS.
- V. I. Arnold, Am. Math. Soc. Transl., Ser. 2, 1965, 46, 213 Search PubMed.
- A. Destexhe and P. Gaspard, Phys. Lett. A, 1993, 173, 386–391 CrossRef.
| This journal is © the Owner Societies 2006 |
