Three crystal forms of tetrakis(μ2-2-nitrobenzoato-O,O′)-diaqua-di-copper(II)
Zvicka
Deutsch
,
Janice M.
Rubin-Preminger
,
Joel
Bernstein
* and
James Y.
Becker
Ben-Gurion University of the Negev, P.O. Box 653, Be'er Sheva, Israel 84105. E-mail: yoel@bgumail.bgu.ac.il
First published on 8th December 2005
Abstract
Two previously unrecognized concomitant polymorphic structures of the copper complex tetrakis(μ2-o-nitrobenzoato-O,O′)-diaqua-copper(II) 1–Cu2(2-NO2C6H4COO)4(H2O)2 are reported. These two structures have been solved and there is substantial evidence of a nonaquo structure Cu2(2-NO2C6H4COO)4 that precipitated from the same aqueous solution. Diaquo form 1 crystallizes as emerald green prisms of varying sizes and is the thermodynamically stable form. Crystal data: Mr = 827.56, monoclinic, a = 7.534(2), b = 13.411(4), c = 15.404(4) Å, β = 97.101(5)°, V = 1544.5(7) Å3, T = 295(2) K, space group P21/n, Z = 2, μ = 1.47 mm−1, Dx = 1.780 Mg m−3, λ(Mo Kα) = 0.71073 Å, F(000) = 836, final R[int] = 0.0397 for 3725 reflections used in the refinement. Diaquo form 2 crystallizes in two habits, plates and diamondoids, and is the kinetically stable form. The crystals are usually thinner and consequently lighter shaded than form 1. Crystal data: Mr = 827.56, monoclinic, a = 26.561(3), b = 7.4708(9), c = 16.652(2) Å, β = 106.510(3)°, V = 3168.1(6) Å3, T = 293(2) K, space group P21/c, Z = 4, μ = 1.434 mm−1, Dx = 1.735 Mg m−3, λ(Mo Kα) = 0.71073 Å, F(000) = 1672, final R[int] = 0.0539 for 7828 reflections used in the refinement.
Introduction
In the course of carrying out a ‘routine’ first year undergraduate laboratory exercise, we have discovered two previously unrecognized concomitant polymorphic structures of the diaquo copper complex tetrakis(μ2-o-nitrobenzoato-O,O′)-diaqua-copper(II) 1–Cu2(2-NO2C6H4COO)4(H2O)2.Extensive studies have been carried out on similar dimeric copper complexes with the benzoato anion monosubstituted or disubstituted ortho and para with a myriad of groups such as halogens, OH, OCH3 and with a variety of molecules on the axial position. Steric overcrowding of substituents on the aromatic ring results in non-planarity of those substituents and the ring.
As the data gather, the various conformations that are adopted by the ligand molecules and the deviations from their gas phase conformations can be studied to help understand the energy considerations and polarization of packing modes.
There is a growing interest in similar coordination network structures in the field of new zeolite type materials due to their ability to form nanopores and channels that can be utilized as molecular sieves or reversible adsorbing materials.1
Experimental
Methods
Crystal preparation
Crystallization of two distinct polymorphs of 1 and an additional nonaquo form from aqueous solutions in slightly varying conditions was observed and is documented here. The solution was prepared in three steps: (i) 1.015 g (1 mol) of o-nitro-benzoic acid were dissolved in 25 ml of water; (ii) 0.510 g (1 mol) of NaHCO3 was added rapidly to the solution in order to guarantee complete deprotonation of the acid; (iii) 0.76 g (0.5 mol) of CuSO4 was mixed into the solution. Gentle heating at 45 °C was required only in the end until the resulting light green solution was completely clear. Standing under ambient conditions in an open vessel for a week yielded form 1—emerald green prism shaped crystals, which were then filtered off under vacuum and washed slightly with ethanol (Fig. 1).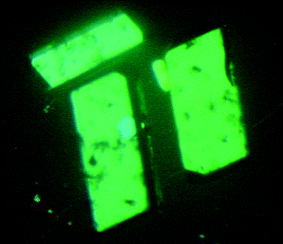 | ||
| Fig. 1 Micrographs of the emerald green prisms of form 1 in polarized light. Their length is approximately 1 mm. | ||
Along with form 1, we observed concomitant crystallization of tiny light green sticky twinned diamondoid plates in a considerably lesser amount (Fig. 2a). They were subsequently identified and characterized as form 2. This polymorph gradually disappeared with the growth of prisms of form 1 which is one manifestation of concomitant polymorphism.3 On the assumption that form 2 is the kinetic product we attempted to increase its relative yield by carrying out the crystallization at 50 and 60 °C. The resulting fuzzy heavily twinned crystalline residue was found to consist mostly of light green plates, identified as form 2, with the occasional emerald green “bump” or “island” of form 1 (Fig. 3)
 | ||
| Fig. 2 (a) and (b) – Micrographs of form 2. This form crystallizes in two distinct habits. In one habit, as depicted in (a), crystals are twinned diamondoid light green plates that gradually disappear as form 1 continues growing at their expense (the comparatively large crystal of form 1 is observable on the right of micrograph (a)). In the second habit, as depicted in (b), crystals grow as lighter shaded emerald green plates from a common centre resembling a 3-D “star”. In this habit the growth of form 1 does not noticeably retard the growth of form 2. | ||
 | ||
| Fig. 3 Forms 1 and 2 manifest concomitant polymorphism. Under kinetic conditions the amount of form 1 can be reduced and that of form 2 is substantiated. The arrows point at crystals of both forms. | ||
In a separate experiment, the growth of a lighter shade of emerald green plates from a common centre (resembling a 3-D “star”) was observed (Fig. 2b). We later identified these as an additional habit of form 2. In this habit, growth of form 1 at the expense of form 2 was considerably retarded.
The color appears to be a function of the thickness of the crystal and is therefore not an accurate indication of the crystal form; i.e. the plates tend to have a lighter shade simply because they are thinner.
With no apparent difference in experimental conditions a third form—subsequently classified as a nonaquo complex—was obtained immediately upon the addition of the copper salt. It appeared as a dark powdery precipitate that adhered to the surface of the vessel and the magnetic stirrer. The vessel was left to stand under ambient conditions for two weeks, at which point the precipitate no longer adhered to the surface and the nonaquo complex could be harvested from the bottom of the vessel (Fig. 4).
 | ||
| Fig. 4 Micrograph of form 3, showing dark powdery precipitate that formed immediately upon the addition of the copper ions to the solution of the ligand. | ||
Results and discussion
Crystal structures
Crystal data for the two forms are summarized in Table 1.| Chemical formula | C28 H20 Cu2 N4 O18 | C28 H20 Cu2 N4 O18 |
| Formula weight | 827.56 | 827.56 |
| Space group | P21/n | P21/c |
| a/Å | 7.534(2) | 26.561(3) |
| b/Å | 13.411(4) | 7.4708(9) |
| c/Å | 15.404(4) | 16.6522(19) |
| β/° | 97.101(5) | 106.510(3) |
| V/Å3 | 1544.5(7) | 3168.1(6) |
| D calc/Mg m−3) | 1.780 | 1.735 |
| Z | 2 | 4 |
| F(000) | 836 | 1672 |
| θ Range for data collection/° | 5.77 to 28.31 | 0.80 to 28.28 |
| Index ranges | −10 ≤ h ≤ 8, −17 ≤ k ≤ 17, −20 ≤ l ≤ 19 | −35 ≤ h ≤ 35, −9 ≤ k ≤ 9, −22 ≤ l ≤ 22 |
| Reflections collected | 9512 | 26808 |
| Independent reflections | 3725 [R(int) = 0.0397] | 7828 [R(int) = 0.0539] |
| Refinement method | Full-matrix least-squares on F2 | Full-matrix least-squares on F2 |
| Data/restraints/parameters | 3725/0/275 | 7828/0/549 |
| Goodness-of-fit on F2 | 1.027 | 0.987 |
| final R indices [I > 2σ(I)] | R 1 = 0.0316, wR2 = 0.0798 | R 1 = 0.0387, wR2 = 0.1051 |
| R indices (all data) | R 1 = 0.0409, wR2 = 0.0878 | R 1 = 0.0598, wR2 = 0.1299 |
| Largest difference peak and hole/e Å−3 | 0.409 and −0.507 | 0.492 and −0.592 |
CCDC reference numbers 205466 and 280256 of forms 1 and 2, respectively. For crystallographic data in CIF or other electronic format see DOI: 10.1039/b511326a
The ORTEP drawing of form 1, along with its numbering is shown in Fig. 5.
 | ||
| Fig. 5 ORTEP diagram of form 1. Hydrogen atoms have been omitted for clarity. The letter “a” indicates atoms at equivalent position (−x, 1 − y, 1 − z). | ||
The material crystallizes as a centrosymmetric dimer in which two central copper ions are coordinated to one another at a distance of 2.623 Å. There are four ligand molecules of o-nitrobenzoate that bridge the copper pair via the carboxylato oxygens. Each of the two oxygens from a single carboxylato group is coordinated to one copper ion forming a square base around each copper. The bond length of axial water ligand is 2.161 Å, with the Cu atom displaced by 0.195 Å from the plane of the carboxylato oxygens in the direction of the axial water molecule. Similar structures are found in the dihydrate4 and DMSO solvate5 of the diaquo copper complex with o-nitrobenzoic acid and in the dihydrate6 and monoacetone solvate1 of the diaquo copper complex with p-nitrobenzoic acid. The two C–O bond lengths of the benzoato ligands are both 1.25 (2) Å.
The ORTEP drawing of form 2 molecules, along with their numbering is shown in Fig. 6.
 | ||
| Fig. 6 ORTEP diagram of one of the two molecules in the asymmetric unit of form 2. Hydrogen atoms have been omitted for clarity. | ||
Form 2 consists of two molecules in the asymmetric unit with slight conformational and bond length variations. The structure of this form is also of a centrosymmetric dimer with the axial water molecule at a distance of 2.145 and 2.147 Å in molecule 1 and 2, respectively. The Cu atom lays 0.202 and 0.205 Å from the plane of the square base in molecule 1 and 2, respectively.
A conformational comparison (summarised in Table 2) reveals distinct differences between the two forms.
| Form 1 | Form 2 | ||||
|---|---|---|---|---|---|
| Torsion angles of ligand rings | Torsion angles of nitro groups on rings | Torsion angles of ligand rings | Torsion angles of nitro groups on rings | ||
| a Ligand 1 corresponds to the purple frame and ligand 2 corresponds to the blue frame in Fig. 7. The torsion angles are specified by atom numbers that correspond to the ORTEP diagrams. | |||||
| Molecule 1 in asymmetric unit | Ligand 1 | 82.7 (∼90) | −0.7 (∼0) | 125.2 | −45.2 |
| O1–C1–C2–C3 | C2–C7–N1–O2 | O1′–C1′–C2′–C3′ | C2′–C7′–N1′–O2′ | ||
| Ligand 2 | 47.0 | −34.2 | 54.0 | 32.6 | |
| O11–C11–C12–C13 | C12–C17–N11–O12 | O11′–C11′–C12′–C13′ | C12′–C17′–N11′–O12′ | ||
| Molecule 2 in asymmetric unit | Ligand 1 | — | — | 125.0 | −44.0 |
| O1″–C1″–C2″–C3″ | C2"–C7"–N1"–O2" | ||||
| Ligand 2 | — | — | 53.6 | 32.1 | |
| O11″–C11″–C12″–C13″ | C12"–C17"–N11"–O12" | ||||
In form 1, as seen in Fig. 7, the ring depicted in the purple frame is approximately perpendicular to the plane of the page (torsion of 82.7°). The other ring, depicted in the blue frame, forms a torsion angle of 47°.
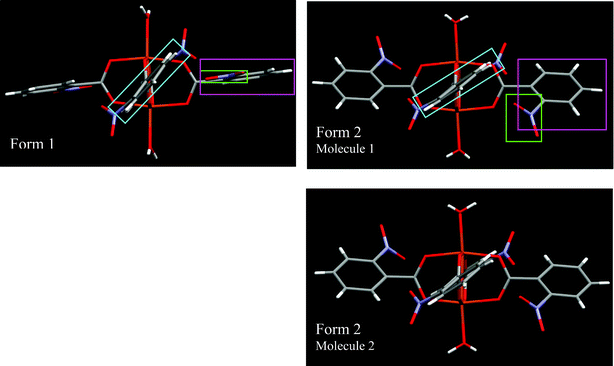 | ||
| Fig. 7 Form 1 has one molecule in the asymmetric unit and form 2 has two molecules with slight conformational variations. All molecules in this diagram are presented in such a way that the copper ions and two out of the four carboxylato groups are in the plane of the page with the vector connecting the two water ligands vertically. The most striking conformational differences between forms 1 and 2 occur at three distinct locations, which have been color coded. The purple frame depicts how the torsion angle of one ligand ring (and the one opposite) varies between form 1 and 2 from 82.7 to 125.2° or 125.0° (O1–C1–C2–C3). The green frame shows how the torsion angle of the nitro group (and the one opposite) changes between form 1 and 2 from 0.7° to 45.15° or 44.02° (C2–C7–N1–O2). The blue frame depicts how the torsion angle of the other ligand ring (and the one opposite) changes slightly between forms 1 and 2 from 47.0 to 54.0° or 53.6° (O11–C11–C12–C13). | ||
The nitro group depicted in the green frame is in the plane of the benzene ring itself which is the preferable conformation for nitro substituted benzene,7 whereas the other nitro group forms an angle of 34.2° with the ring depicted in the blue frame. This is apparently due to repulsion between the oxygen of the carboxylato and that of the nitro group.
In form 2, as seen in Fig. 7, all the benzene rings are rotated by an angle of about 50° (or 180 − 50 = 130°) as depicted in the blue and purple frames. The nitro groups in the green frame form a torsion angle of 32.6 and 32.1° whereas the other nitro groups, depicted in the blue frame, form a torsion angle of 45.2 and 44.0°. It is known that π-electron delocalization from the aromatic ring to the nitro moiety requires a decrease of the rotation about the C–N bond and results in a shortening of that bond.8
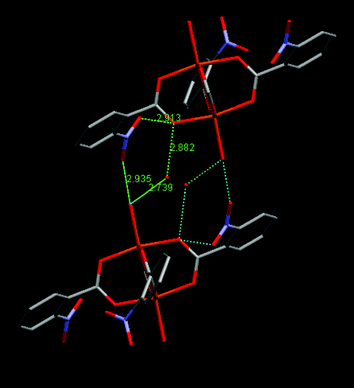
Hydrogen bonding is another factor tending to orient the substituents.9 The metrics of the hydrogen bonding are summarized in Table 3. The molecule in the asymmetric unit of form 1 and both molecules in the asymmetric unit of form 2 exhibit two characteristic hydrogen bonds. In each case the axial water is the donor molecule involved in hydrogen bonding, as seen for reference molecule a in Fig. 8 and 9. One hydrogen atom of the axial water is bonded to one of the oxygen atoms on the nitro group of an adjacent molecule (marked b), with an O–H⋯O distance of 3.01 Å. The second hydrogen atom of the water molecule is bonded to the underside (area of the lone pairs) of the outer oxygen atom of the benzoate group, of a third molecule (marked c), with an O–H⋯O distance of 2.85 Å. The presence of a center of symmetry leads to an R22(8) motif marked in blue in Fig. 8 and 9.
 | ||
| Fig. 8 Hydrogen bonding in form 1. Two ligand rings and hydrogens have been omitted for clarity. Molecule a is an arbitrary reference molecule exhibiting the two characteristic hydrogen bonds in which the axial water is involved. Only nitro groups that are in the plane of the ring (marked in red) are involved in hydrogen bonding. The R22(8) motif is marked in blue. A distinct feature of form 1 is a lack of interaction between molecules c and b which both interact with a. | ||
 | ||
| Fig. 9 Hydrogen bonding in form 2 for molecule 1 and molecule 2 of the asymmetric unit. Two ligand rings and hydrogens have been omitted for clarity. Molecule a is an arbitrary reference molecule exhibiting the two characteristic hydrogen bonds that the axial water is involved in. Only nitro groups that are marked in red are involved in hydrogen bonding. The R22(8) motif is marked in blue. A distinct feature of form 2 is an interaction between molecules c and b of which both interact with a. | ||
| O6axial–H2–O1/11caboxylato | O6axial–H1–O3/13nitro | |||||
|---|---|---|---|---|---|---|
| Form 1 | Form 2molecule 1 | Form 2molecule 2 | Form 1 | Form 2molecule 1 | Form 2molecule 2 | |
| a Two hydrogen bonds characterize each molecule. A comparison is made between the different molecules for each hydrogen bond. | ||||||
| d(H⋯A)/Å | 2.1 | 2.17 | 2.15 | 2.16 | 2.21 | 2.04 |
| d(D⋯A)/Å | 2.849 | 2.888 | 2.873 | 3.011 | 2.908 | 2.891 |
| ∠D–H⋯A/° | 172.8 | 160.7 | 158 | 171.7 | 156.3 | 149.3 |
The hydrogen bonding in this system exhibits a distinct feature. In form 1, there is no interaction between the two neighboring molecules that hydrogen bond to reference molecule a, whereas in form 2 the molecule marked b forms a hydrogen bond via its own axial water to a nitro group on molecule c.
Form 2 has a layered structure as shown in Fig. 10. Within a layer, molecules are held together via hydrogen bonding, whereas the layers are held together by van der Waals interactions with a minimum distance of 2.314 Å between the outermost hydrogens of adjacent layers.
 | ||
| Fig. 10 Depiction of the layered structure of form 2 looking down the c axis. Minimum intermolecular distance between peripheral hydrogen atoms of adjacent layers is 2.31 Å. Click /ej/ce/2006/b511326a/10.htm to access a 3-D rotatable image of Fig. 10. | ||
Another structural feature differentiating the two forms is the difference between benzene ring overlap of neighboring molecules as seen in Fig. 11. In form 2, two rings of an arbitrary central molecule (in blue) complementarily overlap with two from a neighboring molecule—maintaining a layered structure, whereas in form 1, each of the four rings of a central reference molecule (in blue) overlaps with a single ring from a different molecule, thereby disrupting the layered structure. It is clear that form 1 exhibits better π overlap between ligand rings.
 | ||
| Fig. 11 Packing showing the overlap of nitro phenyl groups for (a) form 1 and (b) form 2. Click /ej/ce/2006/b511326a/11a.htm to access a 3-D rotatable image of Fig. 11a. | ||
It is instructive to include a discussion of the hydrate of this substance4 which the experimental description for its crystallization does not apparently differ from that described here. The use of copper acetate rather than copper sulfate and NaHCO3 was made but the same preparation carried out in our lab did not yield the hydrate. The hydrate exhibits a different structure and mild differences in torsion angles compared to the two polymorphs presented here. The carboxylato torsion angle referred to here as O11C11C12C13 (in blue frame) is 65° which is higher than 54° exhibited by form 2 and 47° exhibited by form 1. The nitro in the ortho position to that group is accordingly oriented closer to the plane of the ring (due to less overcrowding) with a 29° angle which is lower than 32° exhibited by form 2 and 34° exhibited by form 1. The ring torsion angle referred to here as O1C1C2C3 (in purple frame) is 131° subtly different from that of 125.24 in form 2. Accordingly, the nitro is pushed slightly further out of the ring at an angle of 45.7 compared to 45.14 in form 2. As can be recalled, the ring in form 1 forms a torsion of almost 90° whilst the nitro is in the plane of the ring.
The difference in structure is mostly due to the hydrogen bonding motif which is distinctly different in the hydrate, with the additional water molecule playing an important role. As seen in Fig. 12, the axial water molecule is not bonded to two molecules via the nitro of one and the carboxylato of the other (as in forms 1 and 2) but is rather interacting with only one molecule; directly via the nitro group and indirectly via the water molecule which is in turn interacting with the carboxylato group. The intervening water molecule also causes the two interacting molecules to be further away from each other than in forms 1 and 2.
 | ||
| Fig. 12 Hydrogen bonding in the hydrate of 1 (ref. 4). Two ligand rings and hydrogens have been omitted for clarity. See text for discussion. | ||
Thermal analysis
The onset of dehydration for both forms varies from crystal to crystal in the range of 150–180 °C. Dehydration is also effected by the heating rate, and the size and shape of the crystal. The thermal events were further investigated with DSC.
 | ||
| Fig. 13 DSC of the two forms of 1. Heating rate 10 deg min−1. | ||
The two peaks at slightly different positions would suggest that the two molecules are in slightly different chemical environments. However, in form 1 they are crystallographically equivalent, being related by a centre of symmetry. The double peak is therefore consistent with a mechanism of dehydration in which the second water molecule experiences an increased association with the copper ions after the liberation of the first water molecule. The broad nature of the peaks can be accounted for by the fact that it takes time for the water molecules from different parts of the crystal to escape from the crystal lattice, which is consistent with the observed change in peak shape with changes in crystal shape.
IR spectroscopy
The FTIR spectra of the two forms are very similar, as can be seen in Fig. 14. | ||
| Fig. 14 Comparison between FTIR spectra of the three forms in the range 600–1800 cm−1. | ||
We also measured microscope IR spectra from single crystals of all three forms (Fig. 15 and 16). The spectrum of the nonaquo complex clearly lacks the characteristic broad OH peak in the range 3250–3600 cm−1, which is additional evidence that it is indeed a nonaquo form. It was found that there is a variation in the shape of the OH peak. In form 1 it is split into a broad and sharp peak and in form 2 the peak is always single.
 | ||
| Fig. 15 Comparison of single crystal IR spectra of the three forms in the range 3000–3800 cm−1. | ||
 | ||
| Fig. 16 Comparison of single crystal IR spectra of the three forms in the range 1900–2300 cm−1. | ||
Additional evidence of the nonaquo form comes from Fig. 16. The wide peaks in the spectrum of form 1 (2150 cm−1) and form 2 (2050 cm−1) are in the area of overtones and combination vibrations of aromatics. The peak is absent from the nonaquo complex.
Powder diffraction
The diffractograms (Fig. 17 and 18) calculated for both diaquo complexes forms from the single crystal data are in good agreement with the experimental PXRD although in both cases the experimental data suffer from some preferred orientation and peak broadening. On the basis of this comparison it is clear that the dark green powder and both diaquo complexes have a distinctly different structure (compare Fig. 17–19). | ||
| Fig. 17 The upper diffractogram is the calculated diffraction pattern of form 1 from single crystal data, experimental data shown in the lower diffractogram. | ||
 | ||
| Fig. 18 The upper diffractogram is the calculated diffraction pattern of form 2 from single crystal data, experimental data shown in the lower diffractogram. | ||
 | ||
| Fig. 19 The upper diffractogram is of emerald green crystal (form 1) that underwent dehydration on hotstage microscope. The lower one is of the green powder (nonaquo complex). | ||
The final piece of evidence that allowed us to identify conclusively the green powder as the anhydrate was the diffractogram in Fig. 19 (lower). This is a diffractogram of a crystal of form 1 that underwent dehydration on the hot stage microscope. As can be seen, this pattern very closely resembles that of the green powder shown in Fig. 19 (upper). The same result is obtained for crystals of form 2
The two diaquo and the nonaquo complexes can be easily distinguished by the prominent single low angle peaks (form 1, 6.95°; form 2, 8.73°; anhydrate, 7.81).
Summary
Two new polymorphic structures of 1 were found to crystallize concomitantly from water at room temperature. The crystallization phenomena and the data presented are all consistent with the fact that form 1 is the thermodynamically stable form—crystallizing at room temperature with slow evaporation, whereas form 2 is the kinetic metastable product—crystallizing at higher temperatures and converting to form 1 in solution over time.Form 2 exhibits a layered structure as opposed to form 1. Both forms exhibit hydrogen bonds at identical locations but form 2 has an additional hydrogen bond within a given layer. The layered structure of form 2 and the lack of hydrogen bonding between the layers may provide a rationale for its lower stability and the additional H bond within separate layers may provide a rationale for its inclination to form under kinetic conditions.
Analysis of powder diffraction revealed that there is a tetracoordinated complex without aquo ligands, as well as two diaquo complexes, that may be obtained from an aqueous solution. This result was extremely difficult to reproduce, but the diffractograms were distinctly different for all three forms. This conclusion was confirmed by IR spectroscopy.
This serendipitous discovery of three crystal forms of a “familiar” and well studied material demonstrates again the role of keen observation in noticing incongruities in solid state and the value of applying a variety of analytical techniques to analyzing and characterizing new polymorphs.
Acknowledgements
Our thanks go to Dr V. Eurkhimovitch for the single crystal IR dataReferences
- O. Kristiansson and L. E. Tergenius, J. Chem. Soc., Dalton Trans., 2001, 1415–1420 RSC.
- G. M. Sheldrick, SHELXL97. Program for Crystal Structure Refinement. University of Gottingen, ( 1997) Search PubMed.
- J. Bernstein, J. Davey and J. O. Heack, Angew. Chem., Int. Ed., 1999, 38, 3440–3461 CrossRef.
- P. Stachová, D. Valiguraa, M. Komana, M. Melníka, M. Korabikb, J. Mrozinskib and T. Glowiakb, Polyhedron, 2004, 23, 1303–1308 CrossRef CAS.
- M. Klinga, M. R. Sundberg, M. Melník and J. Mrozinski, Inorg. Chim. Acta, 1989, 162, 39 CrossRef.
- B. T. Usubaliev, E. M. Movsumov, I. R. Amiraslanov and Kh. S. Mamedov, Dokl. Akad. Nauk Az. SSR, 1980, 36, 40 CAS (in Russian).
- M. Takezaki, N. Hirota, M. Terazima, H. Sato, T. Nakajima and S. Kato, J. Phys. Chem. A, 1997, 101, 5190–5195 CrossRef CAS.
- S. K. Bhattacharjee and H. L. Ammon, Acta Crystallogr., Sect. B, 1981, B37, 2082–2085 CrossRef CAS.
- H. Muhonen, Acta Crystallogr., Sect. C, 1983, C39, 536–540 CrossRef CAS.
| This journal is © The Royal Society of Chemistry 2006 |