Detection of chemical warfare simulants by phosphorylation of a coumarin oximate†
Karl J.
Wallace
a,
Ruth I.
Fagbemi
a,
Frantz J.
Folmer-Andersen
a,
Jeroni
Morey
b,
Vincent M.
Lynth
a and
Eric V.
Anslyn
*a
aDepartment of Chemistry and Biochemistry, The University of Texas at Austin, Austin, TX, USA. E-mail: anslyn@ccwf.cc.utexas.edu; Fax: (512) 477 7911; Tel: (512) 471 0068
bDepartament de Química, Universitat de les Illes Balears, 07122, Palma de Mallorca, Spain. E-mail: jeroni.morey@uib.es
First published on 1st September 2006
Abstract
The detection of chemical warfare simulants is attained by the PET mechanism that gives an “off–on” fluorescent response with a half-life of approximately 50 ms upon phosphorylation of a reactive oximate functionality; the X-ray crystal structure of the oximate was also obtained and is discussed.
The current rise in international concern over criminal terrorist attacks using chemical warfare (CW) agents has brought about the need for reliable and affordable detection of toxic gases. For example, in March 1995 the Aum Shinrikyo sect killed 12 and injured nearly 6000 people when sarin gas was released in a Tokyo subway. Therefore, there has been a significant interest in the decontamination1,2 and detection3,4 of CW agents. One approach that has been studied uses chromogenic detector reagents, which directly bind to, or react with, a target nerve agent, causing a modulation in the absorbance spectra.5–8
Recently, Rebek developed a fluorescent sensor based on a PET quenching mechanism of a fluorophore that upon cyclization produced a strong fluorescent signal.9 A very similar concept was also developed by Timothy Swager in 2003. He created a fluorescent indicator with a dramatic spectral change created in response to the cyclization of a flexible chromophore. Upon exposure to a sarin surrogate (diisopropylfluorophosphate, DFP) the system creates a fluorophore, causing an “off–on” response in the micromolar concentration range.4a In both of these recent examples a fluorescent signal is turned “on”, which is a highly desirable property. However, both systems use an alcohol as a nucleophile, and the half-life for the reaction of an alcohol with DFP (let alone that anticipated with sarin/soman) approaches an hour.4b Due to the intrinsically slow rate of the reaction of alcohols with phosphorus(V)-fluoride groups, we decided to explore a fluorophore containing an oxime moiety, 2a. Upon deprotonation an oximate ion, which is a well-known supernucleophile, is formed. The fluorophore of choice was a coumarin, as Timothy Glass has previously shown that an increase in fluorescence is observed for the detection of amines via the reversible formation of imines in situ with aldehyde 1.10,11
We have previously shown that a simple colorimetric response is obtained when an oximate moiety is attached to a benzene core. Upon phosphorylation with DFP a UV-Vis shift in the blue direction is obtained.12 Even though colorimetric systems have one particular advantage, i.e., the response can be seen with the naked eye, a particular disadvantage is the sensitivity of the system. The Centers for Disease Control and Prevention (CDC) has established the concentration that is Immediately Dangerous to Life or Health, IDLH value, of sarin and soman to be 0.1 mg m−3 (1.7 ppm vapor). At these concentrations a colorimetric approach is not sensitive enough. However, it is well known that fluorescence allows for very high sensitivity, particularly when the signal is turned “on” as demonstrated by both Rebek and Swager.4,9
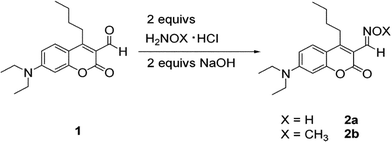
Our design approach was to use coumarin aldehyde 110,13 which is simply converted to an oxime functionality. Reacting 1 with hydroxylamine hydrochloride and sodium hydroxide gave the desired oxime 2a in respectable yield (Scheme 1). The analogous methyloxime (2b) was also synthesized to act as a control.
 | ||
| Scheme 1 Preparation of oximes 2a and 2b. | ||
Both compounds were characterised by NMR and HRMS spectroscopy and all the spectroscopic data agreed with the proposed compounds.
In order to observe whether the fluorophore 2a induced a color change in the UV-Vis spectra, a set of experiments was carried out by titrating aliquots of DFP‡ (6.0 mol dm−3 in DMSO) into a 2.5 × 10⁻⁵ mol dm−3 solution of 2a in DMSO. It is well known that strong bases such as NaOH can react with DFP to form the less toxic hydrolysis product.1 This is a common procedure for the decontamination of CW agents. To avoid this, a nitrogen–phosphorus super-base was used: the P4-t-Bu base (DMSOpKBH+ = 30.25). This base is approximately six orders of magnitude stronger than DBU (MeCNpKBH+ = 24.3) but is non-nucleophilic.
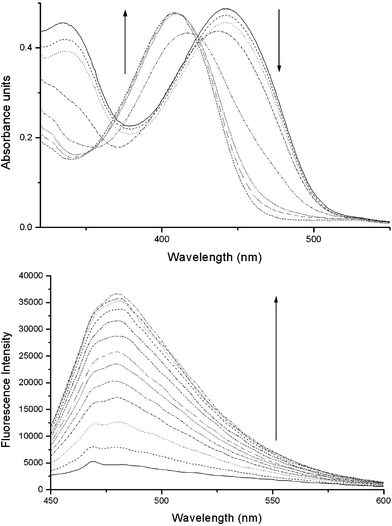
The initial UV-Vis solution of oxime 2a (2.5 × 10⁻⁵ mol dm−3) in DMSO showed a broad band at λmax = 409 nm. On the addition of two equivalents of the P4 base a band at λmax = 443 nm, assigned to the η–π* transition, appears.14 This shift in the red direction is consistent with an anionic species. Upon the gradual addition of aliquots of DFP the band is hypsochromically shifted to λmax = 409 nm through a pseudo isosbestic point at 425 nm (Fig. 1 Top). This can be explained by the experimental procedure. The isosbestic point is not perfect because the conjugate base of compound 2a is diluted upon the addition of DFP throughout the titration. In order to keep the concentration of 2a constant we need to titrate with a solution of 2a and DFP, but due to the instantaneous and irreversible reaction between these two entities this is not possible. A control experiment was carried out analogous to the experiment described above. A solution of 2b (2.5 × 10⁻⁵ mol dm−3) in DMSO was prepared, and on addition of DFP no shift in the UV-Vis absorption was observed. This confirms that the oximate phosphorylates the DFP (see supplementary material).
 | ||
| Fig. 1 (Top) UV-Vis absorption spectra of 2a on addition of aliquots of DFP into a 2.5 × 10⁻⁵ mol dm−3 DMSO solution with 2 equivalent of P4 base. (Bottom) Fluorescence spectra of 2a 0.5 × 10⁻⁶ mol dm−3 in DMSO (excitation 410 nm) as a function of added DFP. | ||
Fluorescence studies on compounds 2a and 2b were carried out by preparing a 0.5 × 10⁻⁶ mol dm−3 solution in DMSO with a 50 fold excess of P4 base, and titrating small aliquots of DFP. The fluorescence signal of 2a with the P4 base alone is weak. This is a result of the high-energy lone pair of the oximate anion quenching the fluorescence via a PET mechanism. Yet, upon phosphorylation by DFP, the energies of these orbitals are lowered, reducing the PET quenching effect, and the fluorescence is turned “on” (Fig. 1 Bottom). Compounds 1 and 2b are also highly fluorescent. This is in good agreement with the PET mechanism, as neither compound has a negative charge to quench the fluorescence. On addition of DFP to 2b the signal remains unchanged (see supplementary material).
It is imperative that the detection of CW agents is achieved quickly. It was observed that upon the addition of an aliquot of DFP there is an immediate change in the UV-Vis or fluorescence spectrum, suggesting that the rate of the reaction is very fast. Stop-flow kinetics experiments were carried out by watching the turn “on” of the fluorescence signal upon the addition of DFP. A 2.5 × 10⁻⁵ mol dm−3 solution of 2a and a 1.25 × 10⁻⁴ mol dm−3 solution of DFP were prepared and placed in the stop-flow apparatus. Equal volumes of the solutions were mixed together and the reaction was monitored for 1 second. The fluorescence intensity increased upon mixing, in good agreement with the fluorescence studies described above. Pseudo first-order kinetics were used and by monitoring the fluorescence intensity at various times one can calculate the rate of the reaction by plotting ln(Ao/(Ao − P)) versus time (Fig. 2 inset), where Ao is the final fluorescence intensity and P is the fluorescence intensity at each time interval measured. The rate constant k (slope) was calculated to be 1410 s−1. Therefore the half-life (t½ = ln(2)/k) was calculated to be approximately 50 ms.
 | ||
| Fig. 2 Fluorescence increase upon phosphorylation. Inset, first-order kinetic plot of ln(Ao/Ao − P) versus time. | ||
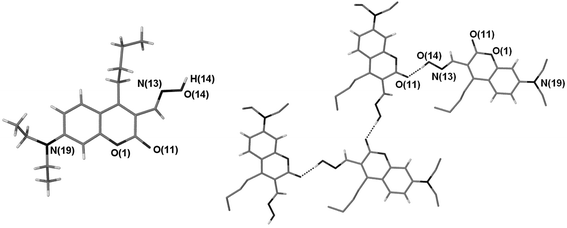
As an aside to the goal of this project, X-ray quality crystals of the coumarin oxime 2a were obtained (Fig. 3). There are two independent molecules in the asymmetric unit and each forms a hydrogen bonding chain (vide infra).§ The oxime functional group in our system has been used as the reactive site for phosphorylation upon deprotonation. However, another facet of the oxime moiety is its use as a building block to control the aggregation of molecules via intermolecular interactions to form arrays of infinite networks. The ideal way to tailor supramolecular structures is readily achieved when interactions are directional and are held together by complementary functional groups that form strong intermolecular bonds. Crystal engineering has extensively used carboxyl,15 amide16 and alcohol17 functional groups to build elaborate architectures. Recently, the oxime moiety has been the functional group of interest in supramolecular chemistry, with respect to crystal engineering.18 A recent study carried out by Motherwell et al. predicts the binding motifs of oximes using known structures of oximes in the CSD.19 Typical binding motifs are dimers, trimers, tetramers and catemers (infinite chains). The formation of these motifs is dependent on the accessibility of the nitrogen atom surface towards a hydrogen atom. This is dependent on the configuration of the N![[double bond, length as m-dash]](https://www.rsc.org/images/entities/char_e001.gif) C double bond with respect to the OH group, and as a consequence these stereoisomeric forms have a detrimental effect on the binding motif. The structure of 2a shows that the accessibility of the nitrogen atom is hindered by the bulky butyl chain in the 4 position of the coumarin molecule, thereby forcing the trans isomer to adopt catemer formation producing a single hydrogen bond interaction between the OH group of one coumarin molecule and the carbonyl functionality of an adjacent coumarin molecule (Fig. 3).
C double bond with respect to the OH group, and as a consequence these stereoisomeric forms have a detrimental effect on the binding motif. The structure of 2a shows that the accessibility of the nitrogen atom is hindered by the bulky butyl chain in the 4 position of the coumarin molecule, thereby forcing the trans isomer to adopt catemer formation producing a single hydrogen bond interaction between the OH group of one coumarin molecule and the carbonyl functionality of an adjacent coumarin molecule (Fig. 3).
 | ||
| Fig. 3 The crystal structure of 2a (molecule A) and view illustrating a portion of the H-bonding array observed for molecule 2a. Most hydrogen atoms have been removed for clarity. Dashed lines are indicative of H-bonding interactions. The geometries of these interactions are: O14–H14⋯O11 (related by x, 3/2 − y, ½ + z); O⋯O 2.673(4) Å, H⋯O 1.73(6) Å, O–H⋯O 170(6)°. | ||
In summary, coumarin 2a was prepared from the aldehyde in a moderate yield. Compound 2a can be deprotonated with a strong base that is non nucleophilic. Phosphorylation of the DFP produces a modulation in the wavelength in the UV-Vis spectra as a consequence of the deprotonation of the oxime. The lone pair on the oximate quenches the fluorescence signal, but upon phosphorylation on the addition of DFP the fluorescence is turned “on” within a ms timescale. Other oxime fluorophores are presently being developed in our laboratories and will be reported in due course.
The authors would like to thank K. A. Johnson for the use of the stop-flow apparatus. We gratefully acknowledge support for this project which was sponsored by the Army Research Laboratory and the Welch Foundation and was accomplished under Cooperative Agreement Number W911NF-04-2-0043.
The views and conclusions contained in this document are those of the authors and should not be interpreted as representing the official policies, either expressed or implied, of the Army Research Laboratory or the U.S. Government. The U.S. Government is authorized to reproduce and distribute reprints for Government purposes notwithstanding any copyright notation hereon.
Notes and references
- Y.-C. Yang, J. A. Baker and R. J. Ward, Chem. Rev., 1992, 92, 1729–1743 CrossRef CAS.
- Y.-C. Yang, Acc. Chem. Res., 1999, 32, 109–115 CrossRef CAS.
- H. Sohn, S. E. Letant, M. J. Sailer and W. Trogler, J. Am. Chem. Soc., 2000, 122, 5399–5400 CrossRef CAS.
- (a) S.-W. Zhang and T. Swager, J. Am. Chem. Soc., 2003, 125, 3420–3421 CrossRef CAS; (b) see supporting information.
- T. Novak, Anal. Lett., 1990, 23, 169–182.
- T. Novak, Anal. Lett., 1991, 24, 925–934 CAS.
- T. Novak, Anal. Lett., 1995, 28, 181–192 CAS.
- C. A. Bunton, N. D. Gillitt and A. Kumar, J. Phys. Org. Chem., 1997, 10, 221–228 CrossRef CAS.
- T. J. Dale and R. Rebek, Jr, J. Am. Chem. Soc., 2006, 128, 4500–4501 CrossRef CAS.
- E. K. Feuster and T. E. Glass, J. Am. Chem. Soc., 2003, 125, 16174–16175 CrossRef CAS.
- K. E. Secor and T. E. Glass, Org. Lett., 2004, 6, 3727–3730 CrossRef CAS.
- K. J. Wallace, J. Morey, V. M. Lynch and E. V. Anslyn, New J. Chem., 2005, 29, 1469–1474 RSC.
- H. Takechi, Y. Oda and N. Nishizono, Chem. Pharm. Bull., 2000, 48, 1702–1710 CAS.
- R. M. Silverstein, G. C. Bassler and T. C. Morrill, Spectrometric Identification of Organic Compounds, John Wiley & Sons: New York, 1963; Vol. 4 Search PubMed.
- A. Zafar, J. Yang, S. J. Geib and A. D. Hamilton, Tetrahedron Lett., 1996, 37, 2327–2330 CrossRef CAS.
- J. C. M. Rivas and L. Brammer, New J. Chem., 1998, 22, 1315–1318 RSC.
- C. P. Brock, Acta Crystallogr., Sect. B: Struct. Sci., 2002, 58, 1025–1031 CrossRef.
- C. B. Aakeroy, A. M. Beatty and D. S. Leinen, CrystEngComm, 2000, 27, 1–6 RSC.
- L. Infantes and S. Motherwell, Struct. Chem., 2004, 15, 173–184 CrossRef CAS.
Footnotes |
| † Electronic supplementary information (ESI) available: Experimental details. See DOI: 10.1039/b609861d |
| ‡ DFP is notoriously acidic, containing trace amounts of HF even when bought fresh from Aldrich. To avoid acid interfering with our system DFP solution was stored over piperidinomethyl polystyrene prior to use. |
| § Crystal data for 2a. C18H24N2O3, M = 316.39, monoclinic, a = 14.9783(4), b = 16.9346(6), c = 13.5481(6) Å, α = 90, β = 99.484(2), γ = 90°, U = 3389.5(2) Å3, T = 117(2) K, space group P21/c, Z = 8, λ 0.71073 Å. Density (calculated) 1.240 Mg m−3, μ 0.085 mm−1, F(000) 1360, crystal size 0.27 × 0.20 × 0.04 mm, 3.01 to 25.00°, reflections collected 10984, independent reflections 5895 [Rint = 0.1388], R1 = 0.0786, wR2 = 0.1143. R indices (all data). R1 = 0.2382, wR2 = 0.1414. Extinction coefficient 2.6(3) × 10−6. Largest diff. peak and hole 0.558 and −0.251 e Å−3. CCDC 614391. For crystallographic data in CIF or other electronic format see DOI: 10.1039/b609861d |
| This journal is © The Royal Society of Chemistry 2006 |
