High efficiency micellar electrokinetic chromatography of hydrophobic analytes on poly(dimethylsiloxane) microchips
Gregory T. Roman, Kevin McDaniel and Christopher T. Culbertson*
Department of Chemistry, Kansas State University, 111 Willard, Manhattan, KS 66506, USA. E-mail: culbert@ksu.edu; Fax: +1-785-532-6666; Tel: +1-785-5326685
First published on 11th November 2005
Abstract
This paper describes a simple method for the effective and rapid separation of hydrophobic molecules on polydimethylsiloxane (PDMS) microfluidic devices using Micellar Electrokinetic Chromatography (MEKC). For these separations the addition of sodium dodecyl sulfate (SDS) served two critical roles – it provided a dynamic coating on the channel wall surfaces and formed a pseudo-stationary chromatographic phase. The SDS coating generated an EOF of 7.1 × 10⁻⁴ cm2 V−1 s−1 (1.6% relative standard deviation (RSD), n = 5), and eliminated the absorption of Rhodamine B into the bulk PDMS. High efficiency separations of Rhodamine B, TAMRA (6-carboxytetramethylrhodamine, succinimidyl ester) labeled amino acids (AA), BODIPY® FL CASE (N-(4,4-difluoro-5,7-dimethyl-4-bora-3a,4a-diaza-s-indacene-3-propionyl)cysteic acid, succinimidyl ester) labeled AA's, and AlexaFluor® 488 labeled Escherichia coli bacterial homogenates on PDMS chips were performed using this method. Separations of Rhodamine B and TAMRA labeled AA's using 25 mM SDS, 20% acetonitrile, and 10 mM sodium tetraborate generated efficiencies > 100 000 plates (N) or 3.3 × 10⁶ N m−1 in <25 s with run-to-run migration time reproducibilities <1% RSD over 3 h. Microchips with 30 cm long serpentine separation channels were used to separate 17 BODIPY® FL CASE labeled AA's yielding efficiencies of up to 837 000 plates or 3.0 × 10⁶ N m−1. Homogenates of E. coli yielded ∼30 resolved peaks with separation efficiencies of up to 600 000 plates or 2.4 × 10⁶ N m−1 and run-to-run migration time reproducibilities of <1% RSD over 3 h.
Introduction
We report a method for the effective and rapid separation of hydrophobic molecules using poly(dimethylsiloxane) (PDMS) microfluidic devices through the addition of sodium dodecyl sulfate (SDS) to the running buffer. For these separations the SDS played two critical roles; first, it provided a charged, dynamic coating on the surface of the microchannel walls; and, second, SDS-based micelles served as a pseudo-stationary chromatographic phase to provide a basis for analyte separation. Because of its simplicity, effectiveness, and robustness this method should find application for the separation of a wide variety of charged and neutral molecules.Microfluidic devices have several advantages over conventional scale chemical analysis instrumentation. These devices can integrate multiple chemical processing steps in a channel manifold so that a number of chemical manipulations can be performed either in series or parallel. Such systems are also known as micrototal analysis systems (μ-TAS). Several different types of chemical processing and handling steps have been demonstrated using μ-TAS including mixing, reactions, filtering, preconcentration and separations.1–6 Several of these processing and handling steps have been integrated to generate devices capable of performing complete chemical analyses.3,4,7–9
The microfluidic devices reported thus far have been fabricated from a variety of glasses and polymers.10–16 Polymers have potential advantages over glasses as the microchip substrate material and fabrication costs are substantially lower. While several polymers have been investigated for the fabrication of microfluidic devices including poly(carbonate), poly(ester),17 poly(styrene),18,19 poly(ethylene terephthalate glycol),18,19 poly(methyl methacrylate),20 poly(acrylic resins),21,22 cellulose acetate,23 and poly(olefins),24 the most popular material by far is poly(dimethylsiloxane) (PDMS),25 a durable hydrophobic elastomer. PDMS is a relatively inexpensive substrate material, and devices can be rapidly and easily molded from the prepolymer. PDMS offers good optical transmission characteristics, high electrical resistivity, and acceptable thermal conductivity.12 PDMS-based microfluidic devices, however, have some fundamental limitations stemming from the hydrophobicity of the PDMS. For example, the channels in these devices are difficult to wet and, therefore, fill. The hydrophobic surface of PDMS also non-specifically adsorbs proteins and other hydrophobic analytes generating low separation efficiencies, asymmetric peak shapes, and drifting electroosmotic flows.26,27
A variety of covalent and dynamic surface coatings for PDMS-based microfluidic devices have been reported to try to overcome some of the aforementioned limitations. Covalent modifications of PDMS channel surfaces often begin with the formation of reactive wall surfaces using plasma, corona discharge or ultraviolet light. The reactive PDMS surface is then further processed by coupling it to specific chemical functionalities either using silanization,28–30 atom-transfer radical polymerization,31,32 or radiation induced graft polymerization.33–36 Alternative techniques for covalently modifying the PDMS surface include sol-gel coatings,37 chemical vapor deposition,38,39 and radical initiators such as cerium(IV).40 In addition to these covalent modifications, several dynamic modifications of the PDMS channel wall surfaces have been reported and include polyelectrolyte multilayers (PEMS),41 phospholipid bilayer coatings,42 and ionic surfactant coatings.26,43,44
Ionic surfactant coatings on PDMS are very simple to apply. Both SDS and cetyltriammonium bromide (CTAB) have been reported to selectively adsorb to PDMS surfaces.26 This adsorption changes the EOF generated in the PDMS channel. PDMS channels coated with SDS concentrations between 0.005 to 0.1% exhibit EOFs between 3 × 10⁻⁴ and 5 × 10⁻⁴ cm2 V−1 s−1, respectively.45 The addition of CTAB at concentrations between 1 × 10⁻⁴ to 2.3 × 10⁻⁴% can be used to reverse the EOF.45 Hydrophobic analyte adsorption studies by Berglund et al.46,47 using optical reflectometry have demonstrated that SDS adsorbs strongly to the surface of PDMS and significantly reduces the adsorption of hydrophobic hydroxypropyl cellulose or hydroxyethyl cellulose. Additionally, hydroxypropyl cellulose and hydroxyethyl cellulose trapped on the PDMS surface can be removed through the addition of SDS.46,47
While MEKC is frequently implemented in fused silica capillaries and glass microchips, there are few reports of its use on polymer microfluidic devices.48,49 These reports include the use of MEKC on PDMS microchips for (1) the precolumn labeling and separation of biogenic amines50 and (2) the separation of antioxidants prior to pulsed amperometric detection.51 It is on polymers, however, especially hydrophobic polymers, like PDMS, where the use of SDS might have considerable impact due to its dual nature as both a dynamic coating agent as well as a pseudo-stationary phase. In this paper we describe the successful separations of Rhodamine B, TAMRA and BODIPY® FL CASE labeled AA's, and AlexaFluor® 488 labeled E. coli homogenates in PDMS-based microchips using MEKC. To improve the initial separations, a PDMS chip with a 30 cm long serpentine separation channel incorporating tapered turns was fabricated and used for some of the separations.52
Materials and methods
Reagents and solutions
Sodium dodecyl sulfate, acetonitrile (ACN), sodium tetraborate, Rhodamine B and AA's were purchased from Acros Organics (Geel, Belgium). The polyamines 1,4-diaminobutane (putrescene), 1,5-diaminopentane (cadaverine), and spermidine were purchased from Sigma Chemical Co. (St. Louis, MO). Commercial PDMS (Sylgard 184) was obtained from Dow Corning (Midland, MI). All of the chemicals were used as received. All solutions were made using distilled, deionized water from a Barnstead Nanopure System (Dubuque, IA) and then filtered through 0.45 µm Acrodiscs (Gelman Sciences; Ann Arbor, MI).Microchip fabrication
Photomasks were generated by The Photoplot Store (Colorado Springs, CO) at 40 000 dpi using a photoplotting process. The mask designs were created in AutoCAD2000LT (Thomson Learning; Albany, NY) and sent to The Photoplot Store for translation and fabrication. Two different masks were used to fabricate the chips reported below. We used a cross microchip with a 4 cm long separation channel for the separations of Rhodamine B and the fluorescently labeled hydrophobic AA's. The dimensions of this chip were identical to that previously reported.37 In addition, we used a serpentine microchip with a separation channel of 30 cm that is similar in design to what has been published previously.52 The serpentine chip was used for AA and E. coli protein homogenate separations and is shown in Fig. 1. The separation channel was 20 µm deep and 75 µm wide. The turns were tapered to minimize band-broadening. The channel dimensions in the turns were 20 µm wide and 20 µm deep.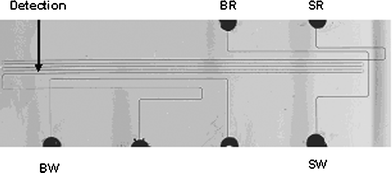 | ||
| Fig. 1 Serpentine PDMS microfluidic chip with tapered turns and a 30 cm separation channel. The separation channel depth and width were 20 µm and 75 µm, respectively, while the tapered turns had a width of 20 µm. SR: Sample reservoir, SW: Sample waste, BR: Buffer reservoir, BW: Buffer waste. | ||
Molds were fabricated using previously reported procedures.37 The Sylgard 184 elastomer was constituted and activated as specified by the manufacturer and degassed for 1 h. Part of this mixture was poured on an SU-8 mold and another part on a clean microscope slide (the blank). After curing for 10 min at 80 °C, both parts were carefully and slowly peeled off the mold and blank. The two pieces of PDMS were then conformally contacted and placed in the oven at 95 °C for 2 h.
Reservoirs for the PDMS chips were fabricated from commercially available borosilicate glass tubing with an outer diameter of 0.8 cm and an inner diameter of 0.5 cm. Reservoirs were cut to 0.7 cm lengths and glued to 1 cm × 1 cm × 0.1 cm glass squares that had holes predrilled into them. The predrilled hole had a diameter of 0.35 cm. The glass tubing was epoxied to the glass square using EPO-TEK, a 2 part epoxy (Epoxy Technology; Billerica, MA). The EPO-TEK was mixed as specified by the manufacturer and cured at 90 °C for 1 h. The glass square with the predrilled hole served as a large adhesive area for anchoring the reservoir to the PDMS microchip. PDMS was mixed in a ratio of 1 to 10 and spread on the back of the glass squares. The glass squares were then placed over the small through holes in the PDMS coverplate that connected with the PDMS channels. The reservoirs were then cured for 1.5 h and allowed to cool at room temperature before being used.
BODIPY® FL CASE Labeling protocol
BODIPY® FL CASE ester dye was purchased from Molecular Probes (Eugene, OR). AA solutions were prepared at concentrations of 5 mM in 150 mM sodium bicarbonate buffer at a pH of 8.5. The reactive BODIPY® FL CASE ester dye was warmed to room temperature prior to diluting in DMSO to a concentration of 10 mM. The BODIPY® FL CASE–DMSO solution was vortexed for 1 min and allowed to equilibrate for 5 min prior to adding to the AA's for conjugation. The AA's were labeled individually by adding 900 µL of an AA solution to a microcentrifuge tube followed by the addition of 100 µL of the reactive BODIPY® FL CASE dye solution. Each tube was then vortexed for 1 min and placed in a dark box on a shaker at 100 rpm. After 4 h, the labeled solutions were removed from the shaker and stored at <0 °C.Amine/Protein extraction protocol
The EasyLyse™ bacterial protein kit from Epicenter (Madison, WI) was used to extract bacterial proteins and amines from E. coli. The E. coli was harvested from a suspension culture of E. coli in phosphate buffered saline by pelleting 1 mL of the culture fluid in a microcentrifuge. E. coli were present at ∼109 cells mL−1and generated ∼100–150 µg of cell homogenate. Once the E. coli were pelleted, the supernatant was removed and the pellet frozen at −20 °C for 1 h. A solution containing 0.5 mL of distilled water, 2 µL of 1 M MgCl2, 0.5 mL of lysis buffer and 2 µL of enzyme mix was vortexed and allowed to equilibrate for 2 min at room temperature. The cell pellet was resuspended in 200 µL of the above solution and incubated for 7 min at room temperature. After incubation the cellular debris were pelleted in a centrifuge for 2 min, and the supernatant was transferred to a clean tube.E. coli homogenate and polyamine labeling
The pH of the extracted E. coli homogenate was approximately neutral. Since protein/amine labeling with the AlexaFluor® 488 TFP ester is optimal around 8.5, the pH of the E. coli extract was adjusted. This was accomplished by adding 200 µL of 0.1 M sodium bicarbonate to 200 µL of the homogenate collected from the extraction described above. The pH of this solution was ∼8.5 as measured by litmus paper. This solution was added to ∼5 mg of TFP ester and reacted for 1 h at room temperature. After 1 h had elapsed the protein and TFP mixture was added to the top of a Bio-Rad BioGel P-30 size exclusion purification resin. The TFP conjugate was allowed to diffuse into the size exclusion purification resin for 10 min prior to adding the elution buffer. The column was eluted with a solution containing 0.1 M potassium phosphate, 1.5 M NaCl and 2 mM sodium azide at a pH of 7.2. The elution buffer was added to the column until the conjugate was eluted and collected.The amine standards were diluted in a 150 mM sodium bicarbonate buffer at pH 8.5 to a final amine concentration of 5 mM. The TFP ester was added in a 4 ∶ 1 molar ratio to ensure that all the amines were labeled with AlexaFluor® 488 TFP ester.
Diffusion coefficient measurements
Peak variance should increase as the migration time increases according to the Einstein-Smoluchowski equation (σ2 = 2Dt) where σ2 is the peak variance, D is the diffusion coefficient, and t is the migration time.53,54 Peak variances, therefore, at sequentially longer separation distances were measured, and these peak variances were then plotted as a function of increasing migration time. The diffusion coefficient was calculated from the slope of this plot. The peak variances and slope were calculated using Igor Pro (version 4.0.7.0, Wavemetrics, Lake Oswego, OR).55Separations and detection
The electrokinetic chromatographic separations and laser induced fluorescent detection were performed with equipment that was similar to that previously described.37 Separations of TAMRA and BODIPY FL CASE labeled AA's were performed with analyte concentration of 1 µM unless otherwise specified. Rhodamine B separations were performed at a concentration of 10 µM unless otherwise specified. The separations and gated injections56 were performed using three independent and remotely programmable high voltage (0–10 kV) power sources from EMCO (Sutter Creek, CA). The proper potentials to apply at each reservoir were determined using Kirchhoff's rules and Ohm's Law.57 The injection times were 0.02 s.Electroosmotic flow (EOF) measurements
EOF measurements were performed on PDMS chips using the current monitoring method.26,58,59 Straight channels were fabricated out of PDMS and subsequently filled with 50 mM SDS, 10 mM sodium tetraborate and 20% acetonitrile, pH = 9.5. The channel was allowed to equilibrate at room temperature for 1 h. After this time period the reservoirs were refreshed with new buffer to ensure that there were no changes in buffer composition due to evaporation. The buffer in the anode reservoir was then replaced with a solution containing 50 mM SDS, 5 mM sodium tetraborate and 20% acetonitrile. This solution had a pH = 9.5. Electric field strengths of 300 V cm−1 were applied using a Bertan (Hauppauge, NY) custom designed 0–10 kV voltage supply. Application of the voltage resulted in the electroosmotic migration of the lower conductivity buffer into the channel. Once the lower conductivity buffer migrated to the reservoir with the cathode in it, the conductivity reached a constant value. The time that it took the lower conductivity buffer to migrate to the cathodic reservoir was used to calculate the electroosmotic mobility in the channel. This particular method was chosen as opposed to the monitoring of a neutral marker because neutral molecules such as Rhodamine B tend to be absorbed by PDMS and, therefore, do not provide a good measure of electroosmotic flow.Imaging of Rhodamine B injections
Two Rhodamine B solutions were prepared, one for capillary electrophoresis (CE) and the other for MEKC. The MEKC solution consisted of 50 mM SDS, 10 mM sodium tetraborate and 20% acetonitrile. The CZE buffer consisted of 10 mM sodium tetraborate. Cross channel chips with separation channel widths, depths and lengths of 20 µm × 10 µm × 3.5 cm, respectively, were used for the injection imaging. The gated injections56 were performed using two independent and remotely programmable high voltage (0–10 kV) power sources from Bertan. The proper potentials to apply at each reservoir were determined using Kirchhoff's rules and Ohm's Law.57 The injection times were 0.2 s. The gated injections were imaged using a Nikon Eclipse TE2000E microscope with an epi-illumination attachment and a Sony CCD color video camera (SSC-DC50A).Results and discussion
Buffer optimization and EOF measurements
One of the primary drawbacks to the use of PDMS microchips is the difficulty of filling the channel manifolds with aqueous solutions. Small nucleation sites within the channel produce air bubbles as the channels are filled with solution. Eliminating this characteristic of PDMS is extremely difficult, but also very important for the broad applicability of PDMS microchips. We found that bubble formation was greatly suppressed using SDS-MEKC buffers on PDMS microchips and that the PDMS channels were just as easy to fill with MEKC buffer as aqueous solutions in glass capillaries. This allowed us to fill 30 cm long PDMS channels with MEKC buffers without air bubble generation. We attribute this effect not only to the selective adsorption and partitioning of SDS to the surface of the PDMS channel but also to the organic content of the solvent which helped to wet the surfaces of the channels and lower the buffer viscosity.The EOF measured in the PDMS channels was 7.1 × 10⁻⁴ cm2 V−1 s−1 (n = 5, 1.6% RSD) for a buffer consisting of 50 mM SDS, 10 mM sodium tetraborate, and 20% acetonitrile (pH 9.5). EOF measurements in PDMS channels using a 10 mM sodium tetraborate and 20% acetonitrile (pH 9.5) buffer yielded an EOF of only 2.1 ± 0.2 × 10⁻⁴ cm2 V−1 s−1 (RSD = 7%, n = 10). The EOF generated on the PDMS devices with the addition of SDS was ∼340% greater than the EOF generated without the SDS. The higher EOF observed for PDMS with the MEKC buffer was due to the partitioning of anionic SDS at the surface of the PDMS as was first described by Harrison's group.26 This higher EOF for the MEKC buffer in PDMS microchips is useful for generating high speed MEKC separations. Generally SDS-based MEKC separations take longer to perform than CE separations as the micelles are migrating opposite to the direction of the EOF. Increasing the EOF, decreases the migration times of the analytes and consequently increases the speed of the MEKC separations compared to the MEKC separations performed on glass chips.
Rhodamine B injections
Electrokinetic gated injections on PDMS chips run in both CE and MEKC modes were imaged using a CCD camera. Fig. 2A shows a gated injection on a PDMS chip in CE mode. Rhodamine B is rapidly absorbed into the sidewalls of the channel. Upon injection of the Rhodamine B into the separation channel there is significant absorption into and adsorption onto the channel wall surfaces, thus yielding non-Gaussian injection plugs that migrate extremely slowly with time. Fig. 2B shows a gated injection on a PDMS chip in MEKC mode. The PDMS does not show any measurable absorption into or adsorption onto the PDMS walls. The injected plug is Gaussian and is transported rapidly down the channel. | ||
| Fig. 2 Gated injections of Rhodamine B on a PDMS chip with tinj = 0.2 s and E = 200 V cm−1. (A) Buffer, 10 mM sodium borate; sample, 10 µM Rhodamine B. (B) Buffer, 10 mM sodium tetraborate, 50 mM SDS and 20% (v/v) ACN; sample 10 µM Rhodamine B. | ||
Rhodamine B separations
Since the MEKC buffer contains acetonitrile it was critical to design reservoirs on PDMS chips that minimized the solvent evaporation as mentioned in the microchip fabrication section above. We found that uncapped reservoirs containing small volumes of fluids often contributed to large run-to-run relative standard deviations (% RSD's) as the acetonitrile would evaporate over the course of an experiment. After constructing larger, capped reservoirs, we were able to achieve run-to-run reproducibilities of <1% RSD.As might be expected, free solution separations (10 mM sodium borate buffer) of Rhodamine B on PDMS microchips with single-point LIF detection, yielded no observable peaks on the electropherogram at a distance of 3 cm from the cross injector. This was primarily due to the absorption of the Rhodamine B into the bulk PDMS. While a fluorescent signal can be observed ∼0.3 cm from the injector, this signal rapidly declines as the distance from the injector increases. Conversely, separations of Rhodamine B using the MEKC buffers generated high efficiency peaks with excellent detection limits and very reproducible run-to-run migration times and peak areas. The separations were performed on a cross channel design with a separation channel 4.0 cm long. The separation distance was 3.4 cm, and the applied electric field was 650 V cm−1. Separations of Rhodamine B under these conditions on PDMS chips using MEKC yielded efficiencies of 63 000 ± 500 (n = 3; RSD = 0.9%), or 1.9 × 10⁶ N m−1. Fig. 3 shows electropherograms for consecutive separations of Rhodamine B using MEKC on a PDMS microchip. Detection limits for this separation were 10 pM, calculated at a S/N ratio of 5. The detection volume defined by the channels (10µm × 20 µm) and detection window (400 µm) was 8 × 10⁻⁸ cm3 yielding a detection limit of 482 molecules. The migration time and peak area reproducibilities for these separations was 0.7% RSD (n = 3) and 0.89% RSD (n = 3), respectively. The diffusion coefficient of Rhodamine B was calculated using the Einstein–Smoluchowski equation from its peak width and found to be 4.4 ± 0.2 × 10⁻⁶ cm2 s−1. This value is within experimental error of the values reported for other small dye molecules in similar solutions.55 The excellent detection limits, migration time and peak area reproducibilities, and measured diffusion coefficients indicate that Rhodamine B is not significantly adsorbing to the sidewall of the PDMS microfluidic device.
 | ||
| Fig. 3 A series of electropherograms of Rhodamine B generated using PDMS microfluidic devices. Device: cross channel PDMS chip with 4.0 cm separation channel; separation distance = 3.4 cm and applied electric field = 650 V cm−1; buffer: 10 mM sodium tetraborate, 50 mM SDS, 20% ACN; sample, 10 nM Rhodamine B. The nominal charge of Rhodamine B is 0. The polarity of the separation was from the anode (sample injector) to the cathode (separation waste). | ||
Amino acid separations
Separations of hydrophobic TAMRA labeled AA's performed on PDMS microchips using MEKC are shown in Fig. 4. The separation parameters were identical to that of the Rhodamine B separations except for a slightly longer detection distance of 3.65 cm. Hydrophobic AA's such as phenylalanine and tryptophan were separated with high efficiencies. Absolute separation efficiencies of 136 000 ± 3000 (n = 5, 2.2% RSD) and 133 000 ± 6000 (n = 5, 4.5% RSD) were obtained for phenylalanine and tryptophan, respectively. These AA separations are significant because they demonstrate the ability to separate extremely hydrophobic AA's on PDMS microfluidic devices. Day-to-day migration time and peak area reproducibilities of these TAMRA labeled AA separations averaged 5.1% RSD and 4.4% RSD, respectively. These separations were performed without the use of the extra volume capped reservoirs as described in the methods and materials section. We found that it was much more difficult to control solvent evaporation from our 100 µL uncapped reservoirs and this directly caused an increase in the reproducibility. | ||
| Fig. 4 Electropherogram of 1 µM Rhodamine B, and TAMRA labelled tryptophan (W), phenylalanine (F), serine (S), proline (P), and aspartic acid (D). Device: cross channel PDMS chip with 4.0 cm separation channel; separation distance = 3.65 cm and applied electric field = 650 V cm−1; buffer, 10 mM sodium tetraborate, 50 mM SDS, 20% ACN. The nominal charge on each AA–TAMRA conjugate and Rhodamine B are as follows: D(−2), S(−1), P(−1), W(−1), F(−1), Rh-B(0). The overall analyte migration was toward the cathode in the separation waste reservoir. | ||
To increase the separation efficiency, resolution and reproducibility of our separations we fabricated a serpentine chip shown in Fig. 1 that has a 30 cm separation channel with extended volume capped reservoirs. The MEKC buffer filled this PDMS channel rapidly without bubble formation. Using a Spellman high voltage power supply we applied −15 kV at the separation waste reservoir to help generate a 750 V cm−1 applied field strength across the separation channel.60 In addition to TAMRA labeled AA's, we also separated BODIPY FL CASE labeled AA's. Fig. 5 shows separations of 17 BODIPY FL CASE labeled AA's in a 50 mM SDS buffer on the PDMS serpentine chip with a 27 cm separation distance. Separation efficiencies for these AA's ranged from 496 000 ± 11 000 (n = 5, 2.3% RSD), or 1.8 × 10⁶ N m−1 for early eluting peaks to 837 000 ± 24 000 (n = 5, 2.9% RSD), or 3.0 × 10⁶ N m−1 for later eluting peaks. Ocvirk et al. reported that BODIPY 493/503 could not be analyzed by CE in a PDMS device because it was extracted into the PDMS.26 Through the application of MEKC on PDMS chips, it is now possible to separate BODIPY FL CASE labeled AA's on PDMS chips with high efficiencies.
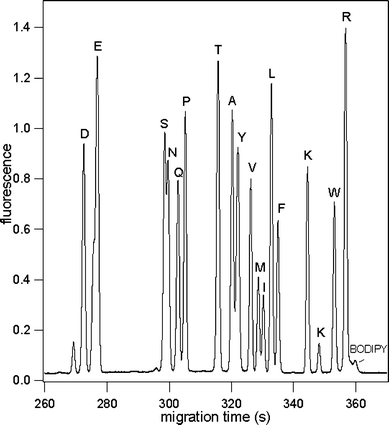 | ||
| Fig. 5 Electropherogram of 17 labeled BODIPY FL CASE AA's; device: serpentine channel PDMS chip with 30 cm separation channel; separation distance = 27 cm and applied electric field = 750 V cm−1; buffer: 10 mM sodium tetraborate, 50 mM SDS, 20% acetonitrile; sample: 1 µM BODIPY FL CASE AA's. AA's are represented by their one letter abbreviation. The nominal charges on each AA–BODIPY conjugate are as follows: D(−3), E(−3), S(−2), N(−2), Q(−2), P(−2), T(−2), A(−2), Y(−2), V(−2), M(−2), L(−2), F(−2), K(−1), W(−2), R(−1). The overall analyte migration was toward the cathode in the separation waste reservoir. | ||
Diffusion coefficients were also calculated for BODIPY FL CASE labeled AA's on PDMS serpentine chips to investigate whether the tapered turns introduced any effective band broadening and whether the BODIPY FL CASE AA's were adsorbing to the channel walls. Diffusion coefficients for BODIPY FL CASE-Ser, and BODIPY FL CASE-Pro were calculated to be 3.8 ± 0.2 × 10⁻⁶ cm2 s−1 and 3.65 ± 0.2 × 10⁻⁶ cm2 s−1, respectively, and are within the experimental error of the literature values.55 This suggests that neither the tapered turns nor the PDMS adversely broadened the analyte bands. In addition, the number of theoretical plates as a function of migration time (i.e. separation distance) was linear for BODIPY FL CASE-Asp and BODIPY FL CASE-Arg (Fig. 6).
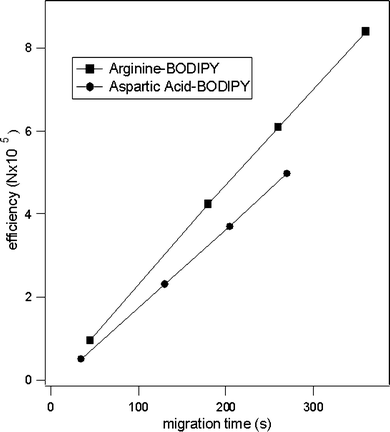 | ||
| Fig. 6 Efficiency of aspartic acid and arginine labeled with BODIPY FL CASE as a function of migration time. Electropherograms were collected using buffer of 10 mM sodium tetraborate, 50 mM SDS, and 20% acetonitrile, electric field strength = 750 V cm−1. The BODIPY–Arg and BODIPY–Asp conjugates have nominal charges of −1 and −3, respectively. The overall analyte migration was toward the cathode in the separation waste reservoir. | ||
Bacterial homogenate separations
To further examine the performance of our PDMS serpentine chip we separated E. coli homogenates. The homogenates were isolated using commercially available lysis and extraction protocols as described in the Materials and Methods section. Our primary goal was to extract the proteins from the homogenate and separate them using MEKC. The results of those separations will be reported in a separate paper. As part of that analysis, the homogenate was labelled with AlexaFluor 488 and then filtered through several molecular weight cut-off filters (MWCO). The homogenate which passed through the 3000 MWCO was used for the separations reported in this paper. This fraction is expected to contain various biogenic amines and AA's. The separation of these AlexaFluor 488 labelled amines and AA's is shown in Fig. 7. The separation efficiencies of these peaks varied from 320 000 ± 3000 for early eluting peaks to 400 000 ± 5000 for later eluting peaks. Using the extended volume reservoirs, run-to-run migration time and peak area reproducibilities were 1.1% RSD, and 1.3% RSD over a 3 h time period. | ||
| Fig. 7 Electropherogram of AlexaFluor 488 TFP labeled E coli homogenate; device: serpentine channel PDMS chip with 30 cm separation channel; separation distance = 20 cm and applied electric field = 750 V cm−1; buffer: 10 mM sodium tetraborate, 50 mM SDS, 20% ACN. The nominal charges on AF–(1,4-diaminobutane), AF–(1,5-diaminopentane) and AF–spermidine are all −4. The nominal charge on AF unreacted label is −2. The overall analyte migration was toward the cathode in the separation waste reservoir. | ||
In order to tentatively identify some of the peaks in the filtered E. coli homogenate, AlexaFluor 488 labeled standard amines—spermidine, cadaverine and putrescene—were comigrated with the homogenate. Each standard was spiked individually into the homogenate and run. The migration order of the polyamines increased as a function of their hydrophobicity as would be expected if the MEKC separation was primarily chromatographic in nature. Spermidine had the longest migration time followed by cadaverine (1,5-diaminopentane) and putrescine (1,4-diaminobutane). These peaks all comigrated with peaks in the bacterial homogenate allowing their tentative identification (Fig. 7).
Conclusion
We have demonstrated a rapid and facile method for separating hydrophobic analytes on PDMS microchips using MEKC with very high separation efficiencies and very low detection limits. Extended separation distances were realized on these chips using a serpentine channel pattern with tapered turns. This device was easily filled with buffer and was capable of generating diffusion limited MEKC separations. A wide variety of charged and neutral molecules were separated using this method, including Rhodamine B, TAMRA and BODIPY FL CASE labeled AA's, Alexafluor 488 labeled amines, and AlexaFluor 488 labeled bacterial homogenates. The application of MEKC on PDMS-based microchips should significantly extend the variety of analytes that can be manipulated and analyzed. As this method takes advantage of the wide availability of soft lithography and requires no pre-treatment of the PDMS either pre or post fabrication, the technology is accessible to a wide variety of research groups.Acknowledgements
Acknowledgment is made to the donors of the American Chemical Society Petroleum Research Fund for partial support of this research. This material is also partially based upon work supported by the National Science Foundation under Grant No. EPS-0236913 and matching support from the State of Kansas through Kansas Technology Enterprise Corporation. The authors also gratefully acknowledge Kurt Hoeman for generating the serpentine chip photoplots. KM acknowledges funding from the American Chemical Society Petroleum Research Fund and the SUROP program at Kansas State University. We also thank Dr George Marchin of the Kansas State Division of Biology for providing the E. coli.References
- W. N. Vreeland and L. E. Locascio, Anal. Chem., 2003, 75, 6906–6911 CrossRef CAS.
- B. He, B. J. Burke, X. Zhang, R. Zhang and F. E. Regnier, Anal. Chem., 2001, 73, 1942–1947 CrossRef CAS.
- N. Gottschlich, C. T. Culbertson, T. E. McKnight, S. C. Jacobson and J. M. Ramsey, J. Chromatogr., B., 2000, 745, 243 CrossRef CAS.
- M. G. Roper, J. G. Shackman, G. M. Dahlgren and R. T. Kennedy, Anal. Chem., 2003, 75, 4711–4717 CrossRef CAS.
- A. G. Hadd, S. C. Jacobson and J. M. Ramsey, Anal. Chem., 1999, 71, 5206 CrossRef CAS.
- R. S. Foote, J. Khandurina, S. C. Jacobson and J. M. Ramsey, Anal. Chem., 2005, 77, 57–63 CrossRef CAS.
- C. A. Emrich, H. Tian, I. L. Medintz and R. A. Mathies, Anal. Chem., 2002, 74, 5076–5083 CrossRef CAS.
- J. M. Karlinsey, J. Monahan, D. J. Marchiarullo, J. P. Ferrance and J. P. Landers, Anal. Chem., 2005, 77, 3637–3643 CrossRef CAS.
- T. Tang, M. Y. Badal, G. Ocvirk, W. E. Lee, D. E. Bader, F. Bekkaoui and D. J. Harrison, Anal. Chem., 2002, 74, 725–733 CrossRef CAS.
- S. K. Sia and G. M. Whitesides, Electrophoresis, 2003, 24, 3563–3576 CrossRef CAS.
- H. Makamba, J. H. Kim, K. Lim, N. Park and J. H. Hahn, Electrophoresis, 2003, 24, 3607–3619 CrossRef CAS.
- J. C. McDonald and G. M. Whitesides, Acc. Chem. Res., 2002, 35, 491–499 CrossRef CAS.
- H. Becker and L. E. Locascio, Talanta, 2002, 56, 267–287 CrossRef CAS.
- G. Binyamin, T. D. Boone, H. S. Lackritz, A. J. Ricco, A. P. Sassi and S. J. Williams, Lab Chip, 2003, 83–112 Search PubMed.
- T. D. Boone, Z. H. Fan, H. H. Hooper, A. J. Ricco, H. Tan and S. J. Williams, Anal. Chem., 2002, 74, 78A–86A CAS.
- L. E. Locascio, A. C. Henry, T. J. Johnson and D. Ross, Lab Chip, 2003, 65–82 Search PubMed.
- W. Xu, K. Uchiyama, T. Shimosaka and T. Hobo, J. Chromatogr., A, 2001, 907, 279–289 Search PubMed.
- S. L. R. Barker, D. Ross, M. J. Tarlov, M. Gaitan and L. E. Locascio, Anal. Chem., 2000, 72, 5925–5929 CrossRef CAS.
- S. L. R. Barker, M. J. Tarlov, H. Canavan, J. J. Hickman and L. E. Locascio, Anal. Chem., 2000, 72, 4899–4903 CrossRef CAS.
- J. Liu, T. Pan, A. T. Woolley and M. L. Lee, Anal. Chem., 2004, 76, 6948–6955 CrossRef CAS.
- L. Martynova, L. E. Locascio, M. Gaitan, G. K. Kramer, R. G. Christensen and W. A. MacCrehan, Anal. Chem., 1997, 69, 2626–2630 CrossRef CAS.
- R. M. McCormick, R. J. Nelson, M. Goretty Alonso-Amigo, D. J. Benvegnu and H. H. Hooper, Anal. Chem., 1997, 69, 2626–2630 CrossRef CAS.
- M. A. Roberts, J. S. Rossier, P. Ber ier and H. Girault, Anal. Chem., 1997, 60, 2035–2042 CrossRef.
- J. Gaudioso and H. G. Craighead, J. Chromatogr., A, 2002, 971, 249–253 Search PubMed.
- J. C. McDonald, D. C. Duffy, J. R. Anderson, D. T. Chiu, H. S. Wu, J. A. Olivier and G. M. Whitesides, Electrophoresis, 2000, 21, 27–40 CrossRef CAS.
- G. Ocvirk, M. Munroe, T. Tang, R. Oleschuk, K. Westra and D. J. Harrison, Electrophoresis, 2000, 21, 107–115 CrossRef CAS.
- J. K. Towns and F. E. Reignier, Anal. Chem., 1992, 64, 2473–2478 CrossRef CAS.
- B. Wang, Z. Abdulali–Kanji, E. Dodwell, J. H. Horton and R. D. Oleschuk, Electrophoresis, 2003, 24, 1442–1450 CrossRef CAS.
- B. Wang, L. Chen, Z. Abdulali-Kanji, J. H. Horton and R. D. Oleschuk, Langmuir, 2003, 19, 9792–9798 CrossRef CAS.
- B. Wang, R. D. Oleschuk and J. H. Horton, Langmuir, 2005, 21, 1290–1298 CrossRef CAS.
- D. Xiao, T. Van Le and M. J. Wirth, Anal. Chem., 2004, 76, 2055–2061 CrossRef CAS.
- D. Xiao, H. Zhang and M. Wirth, Langmuir, 2002, 18, 9971–9976 CrossRef CAS.
- S. Hu, X. Ren, M. Bachman, C. E. Sims and G. P. Li, Anal. Chem., 2004, 76, 1865–1870 CrossRef CAS.
- S. Hu, X. Ren, M. Bachman, C. E. Sims, G. P. Li and N. L. Allbritton, Anal. Chem., 2002, 74, 4117–4123 CrossRef CAS.
- S. Hu, X. Ren, M. Bachman, C. E. Sims, G. P. Li and N. L. Allbritton, Electrophoresis, 2003, 24, 3679–3699 CrossRef CAS.
- S. Hu, X. Ren, M. Bachman, C. E. Sims, G. P. Li and N. L. Allbritton, Langmuir, 2004, 20, 5569–5574 CrossRef CAS.
- G. T. Roman, T. Hlaus, K. J. Bass, T. G. Seelhammer and C. T. Culbertson, Anal. Chem., 2005, 77, 1414–1422 CrossRef CAS.
- J. Lahann, M. Balcells, H. Lu, T. Rodon, K. F. Jensen and R. Langer, Anal. Chem., 2003, 75, 2117–2122 CrossRef CAS.
- J. Lahann, M. Balcells, T. Rodon, J. Lee, I. S. Choi, K. F. Jensen and R. Langer, Langmuir, 2002, 18, 3632–3638 CrossRef CAS.
- B. E. Slentz, N. A. Penner and F. E. Regnier, J. Chromatogr., A, 2002, 948, 225–233 Search PubMed.
- Y. Liu, J. C. Fanguy, J. M. Bledsoe and C. S. Henry, Anal. Chem., 2000, 72, 5939–5944 CrossRef CAS.
- Y. Tinglu, S.-y. Jung, M. Hanbin and P. S. Cremer, Anal. Chem., 2001, 73, 165–169 CrossRef CAS.
- M. Y. Badal, M. Wong, N. Chiem, H. Salimi-Moosavi and D. J. Harrison, J. Chromatogr., A, 2002, 277–286 Search PubMed.
- D. C. Duffy, J. C. McDonald, J. A. Schueller and G. M. Whitesides, Anal. Chem., 1998, 70, 4974–4984 CrossRef CAS.
- M. Y. Badal, M. Wong, N. Chiem, H. Salimi-Moosavi and D. J. Harrison, J. Chromatogr., A, 2002, 947, 277–286 Search PubMed.
- K. D. Berglund, T. M. Przybycien and R. D. Tilton, Langmuir, 2003, 19, 2714–2721 CrossRef CAS.
- K. D. Berglund, T. M. Przybycien and R. D. Tilton, Langmuir, 2003, 19, 2705–2713 CrossRef CAS.
- H. Nagata, M. Tabuchi, K. Hirano and Y. Baba, Electrophoresis, 2005, 26, 2247–2253 CrossRef CAS.
- M. Galloway, W. Stryjewski, A. Henry, S. M. Ford, S. Llopis, R. L. McCarley and S. A. Soper, Anal. Chem., 2002, 74, 2407–2415 CrossRef CAS.
- K. W. Ro, K. Lim, H. Kim and J. H. Hahn, Electrophoresis, 2002, 23, 1129–1137 CrossRef CAS.
- R. W. Hompesch, C. D. Garcia, D. J. Weiss, J. M. Vivanco and C. S. Henry, The Analyst, 2005, 130, 694–700 RSC.
- J. D. Ramsey, S. C. Jacobson, C. T. Culbertson and J. M. Ramsey, Anal. Chem., 2003, 75, 3758–3764 CrossRef CAS.
- A. Einstein, Ann. Phys., 1906, 19, 371 Search PubMed.
- M. von Smoluchowski, Ann. Phys., 1906, 21, 756 Search PubMed.
- C. T. Culbertson, S. C. Jacobson and J. M. Ramsey, Talanta, 2002, 56, 365–373 CrossRef CAS.
- S. C. Jacobson, L. B. Koutny, R. Hergenröder, A. W. Moore Jr and J. M. Ramsey, Anal. Chem., 1994, 66, 3472–3476 CrossRef CAS.
- K. Seiler, Z. H. Fan, K. Fluri and D. J. Harrison, Anal. Chem., 1994, 66, 3485–3491 CrossRef CAS.
- C. S. Lee, W. C. Blanchard and C. T. Wu, Anal. Chem., 1990, 62, 1550–1552 CrossRef CAS.
- C. S. Lee, D. McManigill, C. T. Wu and B. Patel, Anal. Chem., 1991, 63, 1519–1523 CrossRef CAS.
- C. T. Culbertson, S. C. Jacobson and J. D. Ramsey, Anal. Chem., 2000, 72, 5814–5819 CrossRef CAS.
| This journal is © The Royal Society of Chemistry 2006 |