Nano-sized self-assemblies of nonionic surfactants as solubilization reservoirs and microreactors for food systems†
Nissim
Garti
*,
Aviram
Spernath
,
Abraham
Aserin
and
Rachel
Lutz
Casali Institute of Applied Chemistry, Givat Ram Campus, The Hebrew University of Jerusalem, Jerusalem 91904, Israel. E-mail: garti@vms.huji.ac.il; Fax: +972-2-652-0262; Tel: +972-2-658-6574/5
First published on 7th July 2005
Abstract
In recent studies we have found unique mixtures of food-grade oils, two or more food-grade nonionic hydrophilic emulsifiers, cosolvent (polyol), and coemulsifiers that self-assemble to form mixed reverse micelles (“the concentrate”) and can be diluted with an aqueous phase, progressively and continuously, without phase separation, and are transformed into bicontinuous structures and finally, upon further dilution, can be inverted into oil-in-water nanodroplets. The “concentrate” is capable of solubilizing nutraceuticals, drugs, antioxidants, and other compounds that are poorly soluble in water or in the oil phase, with 10–20 times more solubility capacity than that of any food-grade oils or water phase. For example, phytosterols were solubilized up to 12 times more than the dissolution capacity of the oil (R-(+)-limonene) for the same compounds. Similarly, the solubilization of lycopene in the concentrate was found to be ca. ten times more than in the corresponding oil. The effects of the guest molecule and microemulsions ingredients on the microstructure transitions and their interfacial reactivity were studied, and the correlation between the surface activity of the guest molecule and its effect on the phase transitions was determined. The advantages of these systems in protecting the solubilizates from environmental reactivity (oxidation), was demonstrated. Lycopene did not oxidize—even after 75 days in an open vessel—if solubilized in the microemulsion medium, while if left unformulated, it was totally oxidized. The systems are unique since they demonstrate significant interfacial reactivity. Maillard reactions between sugars and amino acids, carried out at the O/W interface, can be kinetically controlled better than reactions carried out in the aqueous phase; the products are more regioselective and can form Maillard compounds that are not found in aqueous phase processes. Advanced analytical techniques such as SAXS, PGSE-NMR, and viscosity measurements have been used to evaluate the microstructures of the reverse and direct swollen micelles in both the absence and presence of the guest molecules.
 Nissim Garti | Nissim Garti has been a full professor in the Hebrew University of Jerusalem since 1990. He is a board member of the directorates of several academic institutes, and is on the editorial board of several prestigious journals such as Current Opinions. He has written over 300 scientific papers, 60 review articles, 80 patents, and 5 books, and received several international and Israeli awards. He has expertise in: colloid science, surfactants, fats and oils, dispersion technology, emulsion and microemulsion technology and food science. |
 Aviram Spernath | Aviram Spernath is a PhD student in Prof. Garti’s laboratory at the Hebrew University of Jerusalem. He has written several scientific papers and reviews on microemulsion technology. His research titled “New Nanosized Vehicles for Triggering and Targeting of Phytochemicals” received the prestigious Lord Kaye innovation award. |
 Abraham Aserin | Dr Abraham Aserin has 25 years of experience in Colloid Science. He is the head of the Formulation Center at the Casali Institute of Applied Chemistry, The Hebrew University of Jerusalem. He has published several original papers, reviews and patents, and won international awards for innovations and inventions. |
 Rachel Lutz | Rachel Lutz is a PhD student in Prof. Garti’s laboratory at the Hebrew University of Jerusalem. She has written several scientific papers and reviews on reactions in microemulsion and double emulsion technology. |
Introduction
Microemulsions have been known about for over 50 years and yet there are few commercial products based such systems. To the best of our knowledge, there are no food products based on microemulsions. Lack of sufficient food-grade types of surfactants that can form large isotropic regions, lack of knowledge on constructing U-type (dilutable) phase diagrams, systems with very low solubilization capacities, lack of sufficient protection of the solubilized compounds from environmental reactivity, are only a few of the reasons that prevent the incorporation of these systems in foods.Most of the studies that were carried out on microemulsions were aimed at forming either W/O (L2 isotropic systems) or O/W (L1 systems) microemulsions (Fig. 1). The concentrates (surfactant and oil phases), loaded with nutraceuticals or food supplements consisting of ‘reverse micelles’ or ‘surfactant-in-oil phases,’ can not be inverted into oil-in-water droplets upon simple aqueous dilution. In other words, there is not even one oil/surfactant/solubilizate composition that is continuously and progressively dilutable with water or an aqueous phase, all the way to the far water-rich corner. The dilution lines are termed, for example, lines 55, 64, 73, and 82, indicating oil-based concentrate composed of 50, 60, 70, and 80 wt.% surfactant phase and 50, 40, 30, and 20 wt.% oil phase.
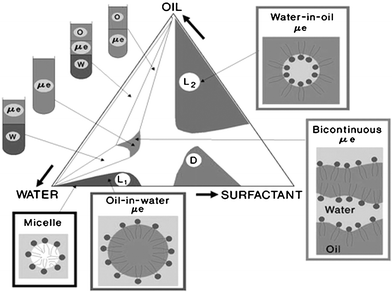 | ||
| Fig. 1 Typical ternary phase diagram based on oil, surfactant, and water. | ||
Typical phase diagrams, similar to the one presented in Fig. 1 have no practical value in food applications since any L2 mixture will separate upon dilution in the final product (beverage).
In addition, it has been well-documented that the L2 isotropic regions are obtained with hydrophobic surfactants, while a hydrophilic surfactant is required to construct L1 regions. Mixture of the two types of surfactants will result in the formation of an emulsion or phase separation. The phase diagram also shows that the system has only a very small bicontinuous region that is not connected to either the L2 or L1 regions.
The idea behind this work was to select blends and compositions of ‘oil phase’ and ‘surfactant phase’ that, even after being loaded with nutraceuticals (guest molecules), will remain miscible as a single isotropic region even if diluted with an aqueous phase. They should be capable of inverting into oil-in-water droplets upon dilution without leaching the active molecule into the continuous aqueous phase.
In order to find such compositions, it is essential to select blends of food grade solvents (oils) composed of two or more types of compounds (one more hydrophilic and the other more hydrophobic). One of the oils should have a small molecular volume and the other possess a larger molecular volume. The ‘surfactant phase’ should be a blend of a mostly hydrophilic surfactant with a more hydrophobic cosurfactant, and/or with polyol. The aqueous phase is water and polyols.
The self-assembled structures that are formed in the oil phase can, at a certain dilution composition, be hydrated with water and form bicontinuous structures that eventually, upon further dilution, will invert into oil-in-water structures. The cosurfactant, at the W/O interface, partitions at the bicontinuous structures, between the water, the oil and the interface, while upon inversion, when the hydrophilic surfactant fully covers the droplets, the cosurfactants, and the cosolvents should migrate and dissolve in the outer and into the inner phases
This study describes the formation of U-type microemulsions capable of solubilizing nutraceuticals and capable of controlling the kinetics and thermodynamics of interfacial reactions both in the W/O interfaces as well as in the O/W interfaces.
Studies on the effect of water-soluble polyols (e.g., propylene glycol, glycerol) and their binary mixtures on the phase behavior and microstructure of low molecular weight surfactants1–5 (such as polyoxyethylene-type nonionic surfactants) and amphiphilic copolymers have been recently reported.6,7 Replacement of water by polar solvents in ionic and nonionic systems leads to an increase in critical micellization concentrations,8–10 a reduced tendency for structure formation,11 and a decrease in the stability of liquid crystalline phases.1,2 These effects have been interpreted in terms of changed water solvent quality. It was reported that the addition of these solvents could lead to dehydration (hydration) of the poly(ethylene oxide) chain of the surfactants and a corresponding decrease (increase) of the surfactant hydrophilicity.2,6,7
The phase behavior and structure of non-aqueous microemulsions have been investigated.3,4,12 The phase behavior of these systems was found to be similar to that of water microemulsions.3–5
Our recent works13,14 have specifically dealt with the improved water and oil solubilization in the presence of polyols (propylene glycol [PG] and glycerol [Gly]) and short-chain alcohol (ethanol [EtOH]) in U-type nonionic W/O and O/W food (and cosmetic) microemulsion systems. We found that alcohols and polyols destabilize the liquid crystalline phase and extend the isotropic region to higher surfactant concentrations. Of interest is the ability of these additives to provide large monophasic systems in which high amounts of oil and water could be solubilized. The pseudo-ternary phase diagrams for R-(+)-limonene–ethanol–water–PG systems based on Brij 96V (cosmetic applications) Tween 60 (food-grade system) are shown in Fig. 2.13,14 In this system, structural evolution of the microemulsion system from poor-aqueous phase to rich-aqueous phase, without encountering phase separation, is possible. These complex systems have attracted a great deal of attention because of their potential application as reservoirs for enhanced solubilization of active hydrophobic or hydrophilic food ingredients.15–18
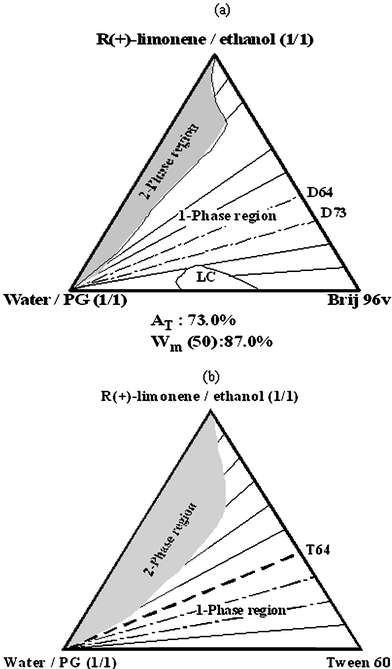 | ||
| Fig. 2 Typical U-type phase diagram with (a) Brij 96 and (b) Tween 60 as surfactants (this phase diagram was used for studying solubilization of lycopene and phytosterols). | ||
In this context, the present work has fundamental significance for an improved understanding of the effects of water-soluble polyols and short-chain alcohols on the microstructure of five-component nonionic microemulsions and also has practical significance, e.g., in food formulations. This investigation aims to produce a system where the type of microstructure can be modulated by varying the aqueous and/or the oleic phase composition and content. To achieve this goal, we have used small angle X-ray scattering (SAXS), NMR pulsed-gradient-spin-echo (PGSE) nuclear magnetic resonance (NMR), and viscosity measurements as the experimental techniques. These techniques are very powerful tools for the characterization of microemulsions and have been useful in the structural characterization of different ionic and nonionic microemulsions.19–22
In recent years, microemulsions have been investigated as reaction media for various chemical reactions.23–30 It has been shown that the influence of structured fluids on the chemical reactions can be described by three aspects:30 firstly, solubilization of a broad spectrum of substances in a one-phase system to overcome reagent incompatibility problems; secondly, enhancement of specific reaction rates due to the partitioning and concentration of reactants and products; thirdly, the structured fluids can influence reaction regioselectivity due to orientation of reactants at the interfacial region.
The term ‘Maillard reaction’ or non-enzymatic browning is used to describe very complex reactions between reducing sugars and free amino acids or proteins. The Maillard reaction is of primary importance in the food industry since it is one of the most important routes to the production of flavor, taste, and color in cooked food.31–33 We chose the Maillard reaction as our model system to determine the influence of microemulsion structure on the formation of volatile compounds and the reaction rate.
Experimental
Materials
Ethoxylated sorbitan esters, Tween 60 (ethoxylated-20 EO-sorbitan monostearate) and Tween 80 (ethoxylated-20 EO-sorbitan monooleate) were commercial grade and purchased from Sigma Chemical Co. (St. Louis, MO, USA). The sucrose ester surfactants (sucrose alkanoates) were mono-, di-, and polyesters of sucrose (sucrose mono-, di-, and polyalkanoates) and fatty acids. These surfactants are food grade and were obtained from Mitsubishi-Kasei Food Corp. (Mie, Japan). R-(+)-limonene (98%) was supplied by Sigma Chemical Co. (St. Louis, Missouri, USA). Ethanol was obtained from Frutarom (Haifa, Israel). Propylene glycol (PG, 1,2-propanediol) and n-butanol were purchased from BDH, Poole, England. The reagents for the Maillard reaction were L-leucine and L-cysteine (Aldrich Chemical Co., Milwaukee, WI, USA), anhydrous D-glucose (Mallinckrodt, Inc., Paris, KY), and furan-2-aldehyde [furfural] (Sigma Chemical Co., St. Louis, MO, USA). The water was double distilled.Phase diagrams
The multi-component systems were described on pseudo-ternary phase diagrams as recently reported,13 at 25 °C.Solubilization
Phytosterols or lycopene and R-(+)-limonene were heated under an inert atmosphere to 110 °C or 140 °C, respectively, for 15 min to allow full dissolution. The water, PG, ethanol, and surfactant were added dropwise at ca. 90 °C. The samples were cooled to room temperature and clear isotropic non-viscous microemulsions, with the desired composition, were formed. The samples, once transparent, were stored at 25 °C. Samples that remained transparent for at least 20 days were considered to be microemulsions.Phytosterols and lycopene are planar molecules. Free phytosterol (Fig. 3a)34 is a commercial mixture of ‘soy free phytosterols’ in an alcoholic form, extracted and purified from soybean oil. Lycopene (Fig. 3b)35 was extracted from tomatoes. Phytosterols dissolve at ca. 2.5 wt.% in the R-(+)-limonene, lycopene dissolves at levels of ca. 0.07 wt.% (700 ppm) in the oil (Table 1). The two nutraceuticals have negligible solubility in water (only a few ppm).
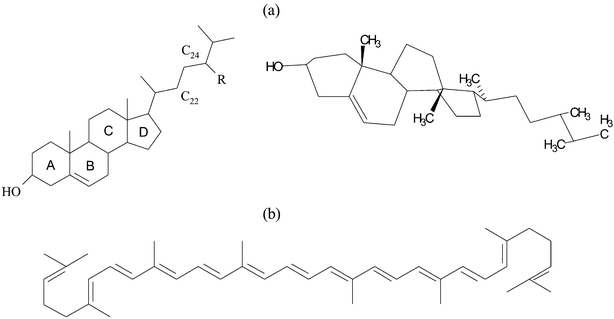 | ||
| Fig. 3 Molecular structures and 3D arrangement of: (a) free phytosterols (R = H–cholesterol; R = CH2CH3–β–sitosterol; R = CH2CH3 and additional double bond at C22–stigmasterol; R = CH3–campasterol; R = CH3 and additional double bond at C22–brassicasterol), and (b) lycopene. | ||
| Microemulsion components | Phytosterols (ppm) | Lycopene (ppm) |
|---|---|---|
| R-(+)-limonene | 20000 | 700 |
| Tween 60 | 25000 | 800 |
| Tween 80 | ND | ND |
| Ethanol | <10 | 20 |
Small-angle X-ray scattering measurements
The small-angle X-ray scattering (SAXS) experiments were carried out using an X-ray generator (Philips, PW 1730/10) operating at 40 kV and 100 mA with a sealed-tube Cu anode (Cu Kα wavelength of 0.154 nm) as we recently reported.36Viscosity measurements
Viscosity measurements were performed at 25 °C on samples along the dilution line T64 (Fig. 2b). The measurements were made on a Carri-Med SCL-50 controlled stress rheometer (TA Instruments, UK) using a cone (6 cm diameter, 1 grad angle) and plate geometry. Shear rates were 10–20 s−1. All samples were measured three times.Self-diffusion measurements
NMR measurements were performed on microemulsion samples at 25 °C on a Bruker DRX-400 spectrometer, with a BGU II gradient amplifier unit, and a 5 mm BBI probe equipped with a z-gradient coil, providing a z-gradient strength (g) of up to 55 G cm−1. The self-diffusion coefficients were determined using a pulsed field gradient stimulated spin-echo (BPFG- SSE).15Spectrophotometric measurements
The visible absorption of lycopene was measured by a UV-VIS spectrophotometer (V-530, JASCO, Victoria, BC, Canada) at 472 nm, against petroleum ether as the blank.Interfacial Maillard reactions
Results and discussion
Small angle X-ray scattering (SAXS)
Microemulsions based on Tween 60 were investigated along various aqueous phase dilution lines.A series of scattering curves of Tween 60 systems along the dilution line T64 is presented in Fig. 4. In the present study, the experimental scattering data are typically shown as raw data after subtraction of the blank scattering, without further manipulations like de-smearing of the instrumental broadening. The dilution line contains a constant weight ratio of R-(+)-limonene/ethanol/surfactant (1 : 1 : 3) and is characterized by a single continuous microemulsion region (transition from oil-rich to aqueous phase-rich microemulsions without the occurrence of phase separation). In this unique Winsor IV isotropic region, the system transforms from a W/O microemulsion via a bicontinuous phase to an O/W microemulsion.17,18Fig. 4 shows that with an increase in the aqueous phase content (water/PG at a constant weight ratio of 1 : 1), the position of the intensity maximum shifts to lower scattering angle, corresponding to increasing distances. Furthermore, the peak initially sharpens and becomes more pronounced at the middle of the dilution line, and then broadens again. It was found that the effective volume fractions36 derived from the structure factors are very close to the weight fraction of the dispersed phase (surfactant + oil phase), despite the fact that they should be higher since they include the solvation shell of the droplets. This is just a coincidence, because ethanol is only formally part of the oil phase; actually, most of it moves into the aqueous phase and part of it penetrates the interface (this will be discussed later in greater detail). The increase in distance with dilution can be explained by the fact that the increase in the aqueous phase content leads to a decrease in interfacial concentration of ethanol (redistribution).
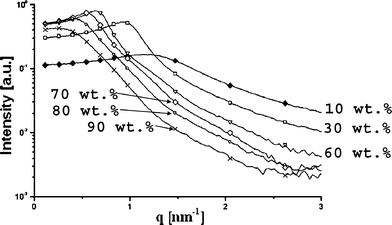 | ||
| Fig. 4 Experimental, slit smeared small angle X-ray scattering curves after subtraction of the background and solvent scattering for the samples along dilution line T64. The aqueous phase (water plus PG at constant weight ratio of 1 : 1) content of the investigated samples: (◆) 10 wt.%, (□) 30 wt.%, (∇) 60 wt.%, (◇) 70 wt.%, (○) 80 wt.%, and (×) 90 wt.%. | ||
Solubilization
Diluting the concentrates with aqueous phase affects the solubilization. The results are presented as total solubilization capacity (μ) from the total formulation content, and as the solubilization capacity normalized to the oil content for each dilution point (solubilization efficiency, α). The maximum solubilization (in wt.%) of the guest molecule, per given formulation, was plotted against the aqueous phase content (μ) along dilution line 64. Such presentation of the results has “application value” (important to technologists or formulators), because it demonstrates how much “total nutraceuticals can be solubilized per preparation”. Such presentation is somewhat conceptually misleading if one wishes to evaluate the “solubilization capacity efficiency” of the guest molecule, because the solubilization capacity does not take into consideration the aqueous dilution factor along the dilution line. To compare the oil phase solubility of solubilizate to its “effective solubilization capacity” in the microemulsion, we used a different term, which is “the amounts (wt.%) of solubilized guest molecules per weight content of the oil phase in the microemulsion,” which was defined as the “solubilization efficiency” and denoted α.A. Phytosterols' solubilization
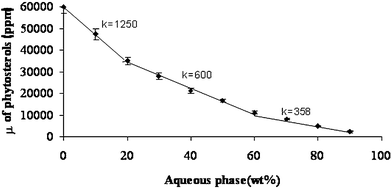 | ||
| Fig. 5 Solubilization capacity (μ) curve of phytosterols along the dilution line T64 at 25 °C. The three regions along the curve are: (I) W/O microstructure; (II) bicontinuous microstructure; (III) O/W microstructure. It should be noted that the line presented in this figure is only a visual guideline. | ||
The decrease in solubilization capacity as the aqueous phase concentration increases may be attributed to the microstructure transformations and the dilution factor. The structural transformation from W/O via bicontinuous to O/W microstructure forces the phytosterols to solubilize between the hydrophobic amphiphilic chains, which is a less preferable location, thus causing a decrease in the SC.
Closer examination of the solubilization patterns in Fig. 5 reveals three regions of solubilization. The regions differ by their slope (k). A sharp slope (k = 1250) can be seen in the first region (0–20 wt.% aqueous phase). In the second region (20–60 wt.% aqueous phase), a more moderate slope is observed (k = 600), reflecting a decrease of more than 50% compared with the slope of the first region. In the third region (more than 60 wt.% of aqueous phase) the slope is very moderate (k = 360), a decrease of 40% compared to the slope in the second region.
Fig. 6 and Table 1 show the α values as a function of the aqueous phase content. The α values of phytosterols in microemulsion are much higher than those of phytosterols in R-(+)-limonene. The increase in solubilization efficiency suggests that phytosterols are incorporated at the interface. One should note that the α values of phytosterol microemulsions containing more than 60 wt.% of aqueous phase are lower than the α values of reverse micellar systems. The advantage of these microemulsions is seen in their dilution capability by the aqueous phase. The solubilization efficiency (α) curve can be divided into three regions as was shown for the SC curve. The changes in the slope of the α curve are more prominent than in the SC curve.
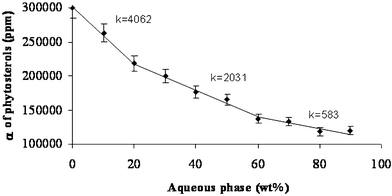 | ||
| Fig. 6 Solubilization efficiency (α) of phytosterols along dilution line T64 at 25 °C. The three regions along the curve are: (I) W/O microstructure; (II) bicontinuous microstructure; (III) O/W microstructure. It should be noted that the line presented in this figure is only a visual guideline. | ||
In the first region (0–20 wt.% of aqueous phase) the curve slope (k) is 4062. In the second region (20–60% aqueous phase) the slope is only half the slope of the first region (k = 2031). In the third region (over 60 wt.% aqueous phase), the slope is 3.5 times smaller than the slope of the second region (k = 583).
B: Lycopene solubilization
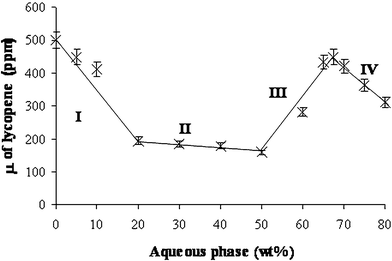 | ||
| Fig. 7 Solubilization capacity (μ) curve of lycopene along dilution line T64 at 25 °C. The four regions along the curve are: (I) W/O microstructure; (II) bicontinuous microstructure; (III) O/W microstructure; (IV) diluted O/W microstructure. It should be noted that the line presented in this figure is only a visual guideline. | ||
At 20–50 wt.% aqueous phase (region II) the solubilization capacity remains almost unchanged (decreased only by an additional 17%). This fairly small decrease in the solubilization capacity could be associated with the gradual transformation of the system into a bicontinuous phase, and the interfacial area remains almost unchanged when the aqueous phase concentration increases.
Surprisingly, in region III (50–67 wt.% aqueous phase), the SC increases from 160 to 450 ppm (an increase of 180%).
In region IV, the solubilization capacity decreases to 312 ppm (a decrease of 30%).
Fig. 8 and Table 1 show the solubilization efficiency (α) as a function of the aqueous phase content. The solubilization efficiency of lycopene, in microemulsion is higher than the solubility of lycopene in R-(+)-limonene.
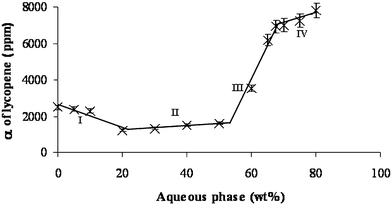 | ||
| Fig. 8 Solubilization efficiency (α) curve along dilution line T64 at 25 °C. The four regions along the curve are: (I) W/O microstructure; (II) bicontinuous microstructure; (III) O/W microstructure; (IV) diluted O/W microstructure. It should be noted that the line presented in this figure is only a visual guideline. | ||
The solubilization efficiency curve (as seen in Fig. 8) can also be divided into four regions, similarly to the solubilization capacity curve in Fig. 7.
In the first region (0–20 wt.% aqueous phase), the solubilization efficiency decreases by 50%, (from 2500 ppm to 1220 ppm). The decrease in solubilization efficiency can be attributed to the decrease in the interfacial area, as the micelles swell.
In the second region (20–50 wt.% aqueous phase), the solubilization efficiency remains almost unchanged (increased by 20%). Systems containing 20–50 wt.% aqueous phase seem to have a bicontinuous microstructure (as indicated in Fig. 4). The interfacial area in a bicontinuous microemulsion does not change as a result of the increase in the aqueous phase content.
In the third region, the solubilization efficiency dramatically increases by 340%, suggesting that lycopene prefers the O/W interface.
In the fourth and last region (67–80 wt.% aqueous phase), the solubilization efficiency is almost unchanged (increased by 11%). The solubilization efficiency indicates that no further microstructure changes occur.
In order to explain the changes in solubilization capacity of phytosterols and lycopene, we characterized the microstructure of microemulsions along dilution line T64, using viscosity experiments and PGSE-NMR technique (see “diffusion coefficient from NMR” section).
Viscosity
Microemulsions are Newtonian. Viscosity depends largely on the microemulsion structure, i.e., the type and shape of aggregates, concentration and interactions between dispersed particles. Viscosity can, therefore, be used to obtain important information concerning the microstructural alternation (transformations) in microemulsions.13Fig. 9 shows the variation in viscosity along dilution line 64, in empty microemulsions, and microemulsions loaded with phytosterols. The general behavior of the empty and the loaded microemulsions seems to be the same. When the weight fraction of the aqueous phase is low, the microemulsion consists of isolated water globules dispersed in the continuous oil medium, and the interactions between the globules are minimal.19 In the bicontinuous region, the interconnected channels increase molecular interactions and hence increase in the viscosity.13 Beyond a certain point in the aqueous phase (>45 wt.%), a sudden decrease in the viscosity is observed which correlates with structural changes or transition from bicontinuous phase into an O/W microemulsion. Nevertheless, phytosterols seem to delay the structural inversion which is derived from the fact that the phytosterols participate at the interface and act somewhat like a cosurfactant. The full transformation from bicontinuous to O/W droplets occurs gradually and progressively as the amount of water increases. Further validation of the results can be obtained using the self-diffusion NMR technique.
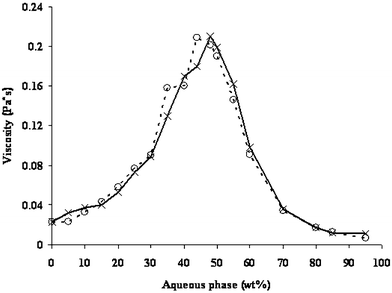 | ||
| Fig. 9 Viscosity of empty microemulsions (○) and microemulsions loaded with phytosterols (×). | ||
Diffusion coefficients
It is not always easy to define the secondary transitions within the phase diagram from the viscosity change. The boundaries are sometimes not detectable or occur progressively. We used the PGSE-NMR technique to define the transition boundaries better, and to estimate the effect of the solubilizate on such transitions.The diffusion coefficients of the water (Dw) and the oil (Do) were normalized to the values measured for aqueous phase (water/polyol, Dw0 = 55.5 × 10⁻¹¹) and pure oil (Do0 = 38.3 × 10⁻¹¹) and were plotted against the aqueous phase content in empty microemulsions and in microemulsions containing phytosterols (Fig. 10a, 11a), and lycopene (Fig. 10b, 11b). The diffusion coefficients of water in the W/O region are quite different in empty vs. solubilized systems. Similarly in the O/W region, the oil diffusion coefficients in empty systems differ from those of the solubilized microemulsions.
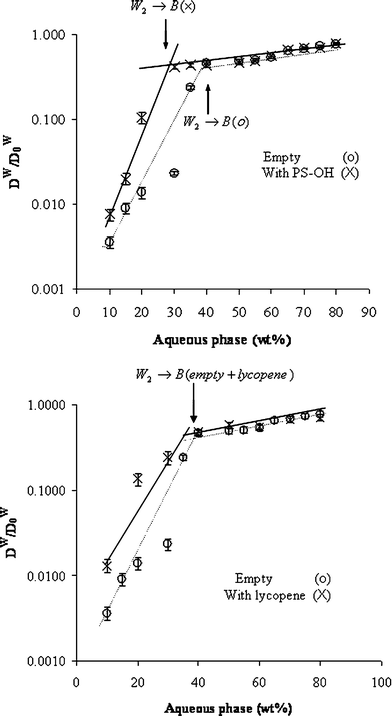 | ||
| Fig. 10 Relative self-diffusion coefficients of the water (Dw/Dw0) calculated from PGSE NMR (pulsed gradient spin echo NMR) as a function of aqueous phase content along dilution line 64 of empty microemulsions (○) and microemulsions loaded with nutraceuticals (×): (a) phytosterols as guest molecule, and (b) lycopene. | ||
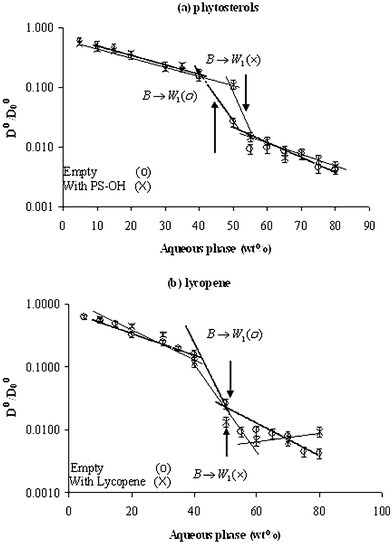 | ||
| Fig. 11 Relative self-diffusion coefficients of the oil (Do/Do0) calculated from PGSE NMR (pulsed gradient spin echo NMR) as a function of aqueous phase content along dilution line 64 of empty microemulsions (○) and microemulsions loaded with nutraceuticals (×): (a) phytosterols as guest molecule, and (b) lycopene. | ||
The NMR results will be discussed in terms of: (1) the absolute diffusion coefficient values of each phase with and without the solubilizate and (2) the relative diffusion coefficient D(empty)/D(solubilized). The diffusion coefficients of water are strongly affected in the water-poor region while the diffusion coefficients of the oil are more pronounced in the water-rich region.
The water diffusion coefficients (Dw)
| Diffusion coefficients | Empty ME | ME with nutraceutical | Empty ME | ME with nutraceutical | ||||
|---|---|---|---|---|---|---|---|---|
| 10−12Dw | D w/Dw0 | 10−12Dw | D w/Dw0 | 10−12Do | D o/Do0 | 10−12Do | D o/Do0 | |
| Phytosterols (at 10% water) | 2.0 | 0.003 | 4.2 | 0.01 | 206.0 | 0.53 | 168.5 | 0.44 |
| Phytosterols (at 80% water) | 431.0 | 0.77 | 443.4 | 0.79 | 1.6 | 0.004 | 1.84 | 0.0048 |
| Lycopene (at 10% water) | 2.0 | 0.003 | 7.2 | 0.013 | 206.0 | 0.53 | 168.5 | 0.53 |
| Lycopene (at 80% water) | 431.0 | 0.77 | 392.0 | 0.70 | 1.6 | 0.004 | 1.84 | 0.01 |
Close examination of the Dw of the empty system vs. the solubilized one, in the W/O region, reveals that the phytosterols and the lycopene enhance the mobility of the water at the W/O region and the Dw(phytosterol)>Dw(empty) (4.2 vs. 2.0 × 10⁻¹² m2 s−1). Similarly Dw(lycopene)>Dw(empty) (7.2 × 10⁻¹²vs. 2.0 × 10⁻¹² m2 s−1) (Table 2).
Observation of the relative diffusion coefficient reveals that in the empty systems the transition occurs at 40 wt.% water, while in the presence of solubilized phytosterols the transition occurs at ca. 30 wt.% water (Fig. 10a). Phytosterols are solubilized at the W/O interface and tend to flatten the curvature and induce the transition to a bicontinuous phase. Therefore, the transition occurs at lower water content.
Lycopene has similar effect on the mobility of the aqueous phase but a smaller effect on the phase transition, probably because of its low interface content, therefore, the transition from the W/O to the bicontinuous phase is similar to the transition in an empty system (Fig. 10b).
The oil diffusion coefficient (Do)
In the W/O region, as expected, the relative Do in empty and solubilized systems decreased moderately with dilution (shallower slope) and the exact transition is difficult to detect, while in the O/W region the oil is more immobilized and the effect is more pronounced (steeper slope). Therefore, it is expected that the oil mobility and inversion will be determined better by the oil diffusion coefficient in the water-rich region.Note that the absolute values are method-dependent. It seems that the transitions are more accurately detected from the viscosity changes than from NMR techniques (possibly due to the different times of the methods) but the trends are similar and in good agreement.
The oil diffusion coefficients in the presence of lycopene are similar to the empty system (Table 3). Lycopene does not have any hydrogen bonding groups and is not solvated by the lipophilic chains of the surfactant and therefore, its effect on the interface, when convex toward the water, is minor and its effect on the mobility of the oil prior to the transition is negligible (Fig. 11b).
| Water content (wt.%) | L1695 | S1570 | ||||
|---|---|---|---|---|---|---|
| A/B (1 h) | B/C (1 h) | B/C (8 h) | A/B (1 h) | B/C (1 h) | B/C (8 h) | |
| a The reactions were carried at 60 °C. A = furfurylthiol (FFT). B = 2-(2-furanyl)-thiazole. C = N-(2-mercaptovinyl)-2-(2-furanyl)-thiazolidine. | ||||||
| 8 | 0.02 | 2.00 | 0.07 | 0.02 | 2.00 | 0.15 |
| 16 | 0.05 | 1.64 | 0.10 | 0.03 | 1.50 | 0.35 |
| 32 | 0.15 | 1.20 | 0.30 | 0.07 | 1.00 | 0.45 |
Lycopene seems to induce the transition of W/O to the bicontinuous phase. Transition in empty microemulsions occurs at 40 wt.% water, while in the presence of lycopene it is brought forward to 30 wt.% water.
Phytosterols and lycopene do not change the transition point to O/W microemulsion (at 60 wt.% water).
Oxidative stability of lycopene
The lycopene molecule contains 13 conjugated double bonds. This physical property causes lycopene to be very sensitive to oxidative degradation, and visible light radiation. This sensitivity to visible light limits the shelf life of lycopene.We compared the oxidative stability of lycopene dissolved in acetone with the oxidative stability of lycopene solubilized in O/W microemulsions.
The concentration of lycopene was measured by UV/VIS spectrophotometer as described in the experimental section.
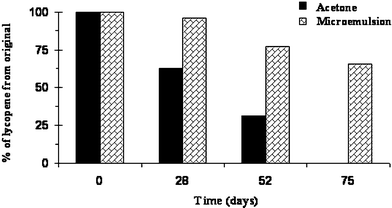
As indicated in Fig. 12, after 28 days of exposing a lycopene sample dissolved in acetone to daylight, the concentration of lycopene decreased by 50%. 75 days of exposure decreased the lycopene concentration to virtually zero. In contrast, exposing a lycopene sample solubilized in four different O/W microemulsions for a period of 28 days, resulted in an average decrease of 8.5% in the lycopene concentration. After 75 days exposure, the average remaining lycopene concentration is ca. 60%.
Those results agree with the results reported by Xu et al.41 They reported that the concentration of lycopene solubilized in micelles is almost unchanged with exposure to light, whereas the concentration of lycopene dissolved in THF decreased significantly. The results indicate that the solubilization of lycopene in the amphiphilc film protects it from oxidative degradation.
Microemulsion as microreactors
Another promising application of microemulsions is their use as nanoreactors for organic and enzymatic reactions.23–30 The constrained environments, the reactant compartmentalization, and the large interfacial area unit volume allow the possibility of controlling the reaction pathways, rates, yield, and regioselectivity.Garti et al.37–40 studied a model Maillard reaction in W/O non-ionic microemulsion composed of sucrose esters or ethoxylated sorbitan esters and compared it to other water-based Maillard reactions. Two kind of amino acids (L-cysteine or L-leucine) and two sugars (furfural or D-glucose) were investigated;
Regioselectivity in furfural-L-cysteine reaction
The first step in the Maillard reaction, as also shown previously by Vauthey et al.,42 is the dehydration of the furfural, resulting in the formation of either the 1- or 3-deoxypentosone. Finally, cyclization and elimination of water lead to the formation of 4-hydroxy-5-methyl-3(2H)-furanone (norfuraneol) as the major product. Moreover, it was shown that it might liberate hydrogen sulfide, which reacts with furfural to efficiently generate 2-furfurylthiol (FFT) (Fig. 13).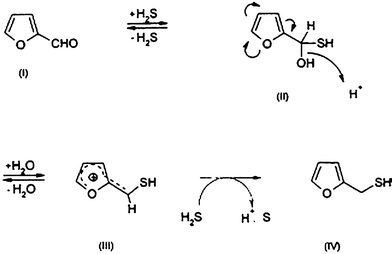 | ||
| Fig. 13 Hypothetical reaction pathway leading from furfural and H2S to 2-furfurylthiol (FFT). | ||
To elucidate the influence of the W/O interface of microemulsions on the formation of the volatile compounds, two different media systems were investigated:37 (1) water (as a reference), and (2) W/O microemulsion based on sucrose esters (stearate, S1570 and laurate, L1695) where dodecane and alcohol in a 1 : 1 ratio served as the oil phase, and phosphate buffer solutions (pH 4–8) containing L-cysteine served as the aqueous phase. The furfural was solubilized in the microemulsion interface.
The reaction of furfural with L-cysteine in aqueous solution at 60 °C leads to the formation of one main sulfur compound (2-furfurylthiol), known as a key odorant in several thermally processed foods. Interestingly, the same reaction performed in the W/O binary systems or W/O ternary microemulsions generates not only higher amounts of 2-furfurylthiol (Fig. 13) but also new sulfur compounds in high concentrations (thiazolidine derivatives), thus demonstrating the particular interest in using the microemulsions as microreactors. The results showing the regioselectivity that was obtained are summarized in Table 3.
The formation of aroma products was also investigated in O/W microemulsions based on ethoxylated sorbitan esters (Tween 60) where R-(+)-limonene and alcohol in a 1 : 1 ratio served as the oil phase and PG/buffer solutions (pH 5) 1 : 1 by weight containing L-cysteine, served as the aqueous phase. The furfural was solubilized in the microemulsion interface.
The effect of the aqueous phase content on product distributions is illustrated in Table 4. With increasing aqueous phase content, the ratio of D : B products in the Tween 60 based O/W microemulsion is increased, whereas it was found that by increasing the water content, the ratio of D : B in the W/O microemulsion is decreased. These results suggest that the microstructure of W/O microemulsions plays an important role in the generation of ‘selective’ aroma compounds. One possible explanation for the remarkable formation rate enhancement and the distribution of different flavor products in both structured media is related to the compartmentalization (partitioning) of the reactants at the interface parallel to the reaction that is carried out in the aqueous phase. This effect was found to accelerate bimolecular reactions by acting to locally concentrate the reactants and providing a large contact between them. Similar effects have also been described by others.43–45
| Aqueous phase content (wt.%) | Ratio of A/B | Ratio of C/B | Ratio of D/B | |||
|---|---|---|---|---|---|---|
| (1 h) | (8 h) | (1 h) | (8 h) | (1 h) | (8 h) | |
| a The reaction was carried out at 65 °C in a Tween 60-based O/W microemulsion. Reaction products: A = furfurylthiol (FFT); B = 2-(2-furanyl)thiazolidine; C = 2-(2-furanyl)thiazoline; D = N-(2-mercaptovinyl)-2-(furanyl)thiazolidine.40 | ||||||
| 60 | 0.01 | 0.03 | 0.08 | 0.09 | 0.08 | 0.11 |
| 75 | 0.03 | 0.07 | 0.09 | 0.11 | 0.09 | 0.14 |
| 90 | 0.05 | 0.09 | 0.1 | 0.12 | 0.11 | 0.21 |
U-type microemulsions
The Maillard reaction can also be carried out in O/W microemulsions.38–40 In such systems, the reactants are basically at the outer interface but tend to penetrate into the O/W interface and can be strongly influenced by the hydrophilic surfactants. The key questions are: (1) is the reaction influenced by the interface or does it behave very much like it is being conducted in simple water phase? and (2) if the interface plays a role and affects the reaction rates, selectivity, and yields, are the components and parameters influencing the reaction acting in a pathway similar to those of the W/O microemulsions?Effect of the aqueous phase content
The reaction tested was a Maillard process between D-glucose and L-leucine. The reactions were carried out at different pHs, temperatures, surfactant/reagent ratios, and in water/propylene glycol solutions vs. microemulsion media. The influence of the amount of internal phase composition of 1 : 1 w/w ratio water/PG on the initial consumption rate of glucose (V0) in W/O, bicontinuous, and O/W microemulsions, was determined in a series of experiments along dilution line 64 (60 wt.% surfactant and 40 wt.% oil phase, the surfactant/oil/butanol weight ratio was kept constant) at 98°C and pH 12.0 (Fig. 14).40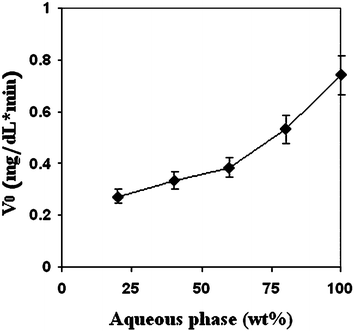 | ||
| Fig. 14 Initial reaction rate (V0) derived from the consumption of glucose as a function of increasing microemulsion dilution with aqueous phase. The reactions were carried out in Tween 60-based microemulsion systems containing aqueous phase: buffered water (pH = 12.0)/PG (1 : 1 w/w), oil phase R-(+)-limonene/butanol (1 : 1 w/w) along dilution line 64 at 98 °C. The glucose content (25 mM) is kept constant in all of the aqueous phase dilutions. | ||
In general, it was observed, as expected, that the initial reaction rate (V0) increased with the increase in water mobility and activity, i.e., the increase in the water content increases the initial reaction rate.
Since L-leucine and glucose are soluble in the aqueous phase, in principle, the reaction should occur solely in the aqueous phase. A pseudophase model that treats the microemulsion as a three-layer bulk system and ignores its actual micellar structure was utilized.46 However, in reality; the reaction was significantly affected by the microemulsion interface. Further more, Bales et al.47 claim in their research on mixed normal micelles as reaction media, that the localized viscosity, structure, and polarity is should also be considered as factors influencing microemulsion reactions.
Yaghmur et al.38 reacted L-cysteine and furfural in varied aqueous phases between 60 and 90 wt.% and found that the reaction occurred at the microemulsion interfacial layer between the oil and the water. As a result, when the O/W microemulsion served as a microreactor, an enhancement in the reaction rate was observed over reactions carried out in the aqueous phases (Fig. 15). The large surface area and the enhanced water mobility increased the accessibility of furfural to the interface and enhanced its local interfacial concentration, causing enhanced interfacial interaction between reagents, resulting in an increase in the initial reaction rates.
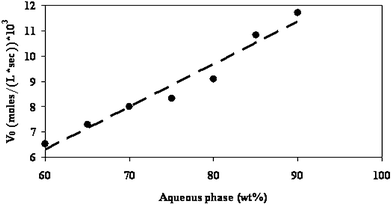 | ||
| Fig. 15 Initial velocity (rate) of the decomposition of furfural (V0) as a function of aqueous phase content in a microemulsion system containing buffered water (pH 5)/PG/(R+)-limonene/EtOH/Tween 60 along dilution line T64 (the aqueous phase contents vary from 60 to 90 wt.%). The reaction was carried out at 65 °C. | ||
In L-leucine-glucose systems, the reactions were carried out in a set of experiments so that in each experiment the reagent concentration remained constant, but the microemulsion composition changed. The amounts of water were progressively increased and the microemulsion internal structure changed from one experiment to the other, from W/O into O/W. We observed reaction rate enhancement at a given constant reagent concentration as a function of the increase in water content, resulting in enhanced activity. The rate enhancement (V0) is, as previously discussed, related to the increase in the water activity, which is reinforced by a decrease in the surfactant and alcohol content in the diluted microemulsions. Surfactants and alcohols bind water and decrease the mobility of the reactants that are dissolved in the aqueous phase, leading to a decrease in the initial reaction rate.48 Therefore, any decrease in the surfactant and alcohol content caused formation of less bound water, resulting in an increase in the initial reaction rate (V0).
Two different initial reaction rate slopes are seen in Fig. 14. Up to 60 wt.% aqueous phase the slope is moderate, but above that, the slope becomes sharper, i.e., the reaction becomes faster. At 60 wt.% water, there is a change in the microemulsion microstructure and transition from a bicontinuous microstructure to O/W microemulsion occurs. We therefore concluded that the change of the microemulsion microstructure influences the initial reaction rate.
Water/PG ratio
It was well-established that PG binds water and influences water activity, strongly affecting the initial reaction rate in any Maillard reactions.48The reactions were carried out in aqueous solutions at three ratios of water/PG (2 : 1, 1 : 1, and 1 : 2 by weight).40 The highest V0 values were obtained in pure water and the initial reaction rate decreased, as expected, with the increase in PG content (Fig. 16). The same trend was also observed in the reaction between furfural and L-cysteine. It was concluded that, in spite of its solubilization effect, increasing the PG proportion in the aqueous phase has a significant effect on decreasing V0. The highest V0 is observed37 for the dilution line with water/PG 3 : 1. The oil phase internal composition was kept constant (surfactant/R-(+)-limonene/butanol 3 : 1 : 1 w/w/w ratio) and the total aqueous phase constant in the O/W microemulsion was 60 wt.%. From Fig. 16, it can be deduced that enriching the aqueous phase with water (increasing the weight ratio of water/PG from 1 : 2 to 2 : 1) causes a sharp increase in the initial reaction rate. The reaction rates of all the reactions carried out in aqueous phase solutions were higher in water than in those of microemulsions.
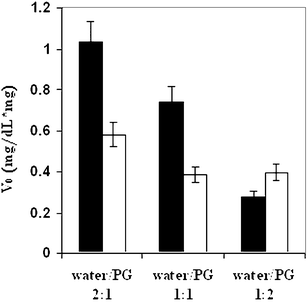 | ||
| Fig. 16 Initial reaction rate (V0) derived from the consumption of glucose as a function of aqueous phase composition reactions carried out in solutions (■) and in microemulsions (□). The reactions were carried out in Tween 60-based microemulsion systems containing 60 wt.% buffered water (pH = 12.0)/PG with different aqueous phase compositions: water/PG ratios of (1) 2 : 1 w/w, (2) 1 : 1 w/w and (3) 1 : 2 w/w, oil phase R-(+)-limonene/butanol (1 : 1 w/w), along dilution line 64, at 98 °C. | ||
PG decreases water activity both in aqueous solutions and in O/W microemulsions, resulting in a decrease in the reaction rate. However, the quantitative effect of PG in the microemulsion is different from that in aqueous solution. The changes (in Fig. 16) of V0 as a function of water/PG ratio are steep in reactions carried out in aqueous solutions and very moderate in reactions carried out in microemulsions. The moderate effect of PG is related to the presence of alcohol and surfactant that compete with PG on the water-binding (sharing) of the water with the PG, thus reducing the immobilization effect of the PG. One can benefit from the ‘competition’ on the water-binding (activity) to control the Maillard reaction rates better by carrying out the reaction in microemulsion rather than in aqueous solution, where the water activity is balanced by the combined effect of the surfactant and PG. It should be stressed here that, for cooked food systems, it means that the existence of sugars, and interface and emulsifiers may slow down the Maillard reaction (work in progress).
Conclusions
The formation of U-type microemulsions is facilitated by the incorporation of a blend of hydrophilic surfactants and cosolvents into the oil phase, forming reverse micelles which can be diluted with the aqueous phase so that a continuous and progressive transition from W/O to O/W microemulsions occurs.The unique dilutable microemulsion has a high capacity to solubilize lipophilic guest molecules (nutraceuticals, drugs) insoluble in water.
The solubilization capacity drops dramatically as the oil content decreases and the surfactant levels decrease, and yet, based on the oil content, the solubilizations are several-fold higher than in the oil phase and are easily dispersed as nanodroplets in the aqueous phase.
The transitions from one nanostructure to the other (W/O to bicontinuous to O/W) are easily detected by viscosity measurements and self-diffusion NMR. Moreover, the PGSE-NMR is a good indicative tool for the locus of the solubilized addenda within the droplet ingredients and the partitioning effect.
Maillard reactions can be carried out at the W/O as well as O/W interfaces and the reaction rates can be speeded up (W/O or O/W in the presence of short-chain water- immiscible alcohols) or can be slowed down in O/W interfaces.
Regioselectivity can also be achieved and new sets of products can be obtained from those reactions.
The nutraceuticals are not only easily dispersed in the water phase but also protected from environmental oxidation effects.
In conclusion, microemulsions show increasing promise as microreactors and microsinks for solubilization of nutraceuticals.
References
- T. Iwanaga, M. Suzuki and H. Kunieda, Langmuir, 1998, 14, 5775–5781 CrossRef CAS.
- K. Aramaki, U. Olsson, Y. Yamaguchi and H. Kunieda, Langmuir, 1999, 15, 6226–6232 CrossRef CAS.
- A. Martino and E. W. Kaler, J. Phys. Chem., 1990, 94, 1627–1631 CrossRef CAS.
- A. Martino and E. W. Kaler, Langmuir, 1995, 11, 779–784 CrossRef CAS.
- R. Strey, Colloid Polym. Sci., 1994, 272, 1005–1019 CrossRef CAS.
- R. Ivanova, B. Lindman and P. Alexandridis, Langmuir, 2000, 16, 3660–3675 CrossRef CAS.
- P. Alexandridis, R. Ivanova and B. Lindman, Langmuir, 2000, 16, 3676–3689 CrossRef CAS.
- R. Nagarajan and C.-C. Wang, J. Colloid Interface Sci., 1996, 178, 471–482 CrossRef CAS.
- R. Nagarajan and C.-C. Wang, Langmuir, 2000, 16, 5242–5251 CrossRef.
- A. Ray and G. Ne'methy, J. Phys. Chem., 1971, 75, 809–815 CrossRef.
- A. Martino and E. W. Kaler, Colloids Surf., A, 1995, 99, 91–99 CrossRef CAS.
- C. Mathew, Z. Saidi, J. Peyrelasse and C. Boned, Phys. Rev. A, 1991, 43, 873–882 CrossRef CAS.
- N. Garti, A. Yaghmur, M. E. Leser, V. Clement and H. J. Watzke, J. Agric. Food Chem., 2001, 49, 2552–2562 CrossRef CAS.
- A. Yaghmur, A. Aserin and N. Garti, Colloids Surf, A, 2002, 209, 71–81 CrossRef CAS.
- A. Spernath, A. Yaghmur, A. Aserin, R. E. Hoffman and N. Garti, J. Agric. Food Chem., 2002, 50, 6917–6922 CrossRef CAS.
- A. Spernath, A. Yaghmur, A. Aserin, R. E. Hoffman and N. Garti, J. Agric. Food Chem., 2003, 51, 2359–2364 CrossRef CAS.
- A. Yaghmur, A. Aserin, I. Tiunova and N. Garti, J. Therm. Anal. Cal., 2002, 69, 163–177 CrossRef CAS.
- A. Yaghmur, A. Aserin, B. Antalek and N. Garti, Langmuir, 2003, 19, 1063–1068 CrossRef CAS.
- S. Ezrahi, A. Aserin and N. Garti, in Handbook of Microemulsion Science and Technology, ed. P. Kumar and K. L. Mittal, Marcel Dekker, New York, 1999, p. 185 Search PubMed.
- O. Regev, S. Ezrahi, A. Aserin, N. Garti, E. Wachtel, E. W. Kaler, A. Khan and Y. Talmon, Langmuir, 1996, 12, 668–674 CrossRef CAS.
- M. Kahlweit, G. Busse, B. Faulhaber and J. Jen, J. Phys. Chem., 1996, 100, 14991–14994 CrossRef CAS.
- T. Hellweg, Curr. Opin. Colloid Interface Sci., 2002, 7, 50–56 Search PubMed.
- F. M. Menger, J. Am. Chem. Soc., 1973, 95, 286–288 CrossRef CAS.
- S. E. Friberg and S. I. Ahmed, J. Phys. Chem., 1971, 75, 2001–2004 CrossRef CAS.
- D. Han and J. S. Rhee, Biotechnol. Bioeng., 1986, 28, 1250–1255 CAS.
- G. W. Zhou, G. Z. Li, J. Xu and Q. Sheng, Colloids Surf. A, 2001, 194, 41–47 CrossRef CAS.
- K. Holmberg, in Handbook of Microemulsion Science and Technology, ed. P. Kumar, K. L. Mittal, Marcel Dekker, New York, 1999, p. 713 Search PubMed.
- A. S. Chatre, R. A. Joshi and B. D. Kulkarni, J. Colloid Interface Sci., 1993, 158, 183–187 CrossRef CAS.
- K. Holmberg and M. B. Stark, Colloids Surf., 1990, 47, 211–217 CrossRef CAS.
- K. Holmberg, Adv. Colloid Interface Sci., 1994, 51, 137–174 CrossRef CAS.
- J. M. Ames, Food Chem., 1998, 62, 431–439 CrossRef CAS.
- R. Scarpellino and R. J. Soukup, in Flavor Science, ed. E. T. Acree, and R. Teranishu, ACS, Washington, USA, 1993, p. 309–335 Search PubMed.
- J. H. Hodge, J. Agric. Food Chem., 1953, 1, 928–943 CrossRef CAS.
- R. E. Ostlund, C. A. Spilburg and W. F. Stenson, Am. J. Clin. Nutr., 1999, 70, 826–831 CAS.
- A. V. Rao and S. Agarwal, Nutr. Res., 1999, 19, 305–323 CrossRef CAS.
- A. Yaghmur, L. de Campo, A. Aserin, N. Garti and O. Glatter, Phys. Chem. Chem. Phys., 2004, 6, 1524–1533 RSC.
- M. Fanun, M. E. Leser, A. Aserin and N. Garti, Colloids Surf., A, 2001, 194, 175–187 CrossRef CAS.
- A. Yaghmur, A. Aserin and N. Garti, J Agric. Food Chem., 2002, 50, 2878–2883 CrossRef CAS.
- A. Yaghmur, A. Aserin, A. Abbas and N. Garti, Colloids Surf., A, 2005, 253, 223–234 CrossRef CAS.
- R. Lutz, A. Aserin and N. Garti, J. Disper. Sci. Technol., 2005, 26 Search PubMed , in press.
- X. Y. Xu, Y. Wang, A. I. Constantinou, M. Stacewicz-Sapuntzakis, P. E. Bowen and R. B. van Breemen, Lipids, 1999, 34, 1031–1036 CrossRef CAS.
- S. Vauthey, C. Milo, P. Frossard, N. Garti, M. E. Leser and H. J. Watzke, J. Agric. Food Chem., 2000, 48, 4808–4816 CrossRef CAS.
- C. A. Bunton and L. S. Romsted, in Handbook of Microemulsion Science and Technology, eds. P. Kumar and K. L. Mittal, Marcel Dekker, New York, 1999, p. 457 Search PubMed.
- S. Gutfelt, J. Kizling and K. Holmberg, Colloids Surf. A, 1997, 128, 265–271 CrossRef CAS.
- F. Currie, K. Holmberg and G. Westman, Colloids Surf. A, 2001, 182, 321–327 CrossRef CAS.
- L. Garcia-Rio, J. R. Leis and C. Reigosa, J. Phys. Chem. B, 1997, 101, 5514–5520 CrossRef CAS.
- B. L. Bales, R. Ranganathan and P. C. Griffiths, J. Phys. Chem. B, 2001, 105, 7465–7473 CrossRef CAS.
- K. Eichner and M. Karel, J. Agric. Food Chem., 1972, 20, 18–23.
Footnote |
| † The paper is based on an invited talk that was given at the ACIS in Cooge Beach, Australia, on February 13–18, 2005 |
| This journal is © The Royal Society of Chemistry 2005 |

