Denaturing gradient-based two-dimensional gene mutation scanning in a polymer microfluidic network
Jesse S.
Buch
a,
Frederick
Rosenberger
b,
W. Edward
Highsmith, Jr.
c,
Christopher
Kimball
d,
Don L.
DeVoe
bd and
Cheng S.
Lee
*ab
aDepartment of Chemistry and Biochemistry, University of Maryland, College Park, MD 20742, USA. E-mail: CL143@umail.umd.edu.; Tel: (301) 405-1020; Fax: (301) 314-9121
bCalibrant Biosystems, 7507 Standish Place, Rockville, MD 20855, USA
cMolecular Genetics Laboratory, Mayo Clinic, Rochester, MN 55905, USA
dDepartment of Mechanical Engineering and Institute for System Research, University of Maryland, College Park, MD 20742, USA
First published on 3rd March 2005
Abstract
An integrated two-dimensional (2-D) DNA separation platform, combining standard gel electrophoresis with temperature gradient gel electrophoresis (TGGE) on a polymer microfluidic chip, is reported. Rather than sequentially sampling DNA fragments eluted from standard gel electrophoresis, size-resolved fragments are simultaneously electrokinetically transferred into an array of orthogonal microchannels and screened for the presence of sequence heterogeneity by TGGE in a parallel and high throughput format. A bulk heater assembly is designed and employed to externally generate a temporal temperature gradient along an array of TGGE channels. Extensive finite element modeling is performed to determine the optimal geometries of the microfluidic network for minimizing analyte band dispersion caused by interconnected channels in the network. A pH-mediated on-chip analyte stacking strategy is employed prior to the parallel TGGE separations to further reduce additional band broadening acquired during the electrokinetic transfer of DNA fragments between the first and second separation dimensions. A comprehensive 2-D DNA separation is completed in less than 5 min for positive detection of single-nucleotide polymorphisms in multiplex PCR products that vary in size and sequence.
Introduction
Recent advances in functional genomics have fostered the vision of future health care tailored to specific individuals' needs, using detailed genetic information regarding disease predisposition, disease progression, and the response to preventive or therapeutic medication.1,2 Significant progress continues to be made toward the identification of new genes, detection of their sequence variations, and their relationship to specific disease states. As such discoveries lead to increasing numbers of diagnostic and prognostic assays for genetic-based diseases such as cancer, it presents a significant challenge to the processing capabilities of clinical laboratories worldwide. Consequently, accurate, high throughput, robust, and sensitive gene scanning tools for performing cost-effective mutation detection in large human disease genes are critically needed to meet this challenge.Currently, nucleotide sequencing remains the gold standard for accurately detecting and characterizing sequence heterogeneity in genes of interest. Despite significant improvements in sequencing technology over recent years,3 the high costs associated with sequencing have prevented it from finding universal adoption for genetic diagnostic and prognostic assays performed in clinical and hospital laboratories. In addition, sequencing regularly fails to detect heterozygous mutations as well as large insertions and deletions.
A large number of alternative and potentially more cost-effective gene screening techniques have been developed, including DNA hybridization microarrays,4 matrix-assisted laser desorption/ionization mass spectrometry,5,6 and enzymatic nucleotide recognition approaches based on flap endonuclease,7 5′-exonuclease,8–10 and single nucleotide primer extension.11,12 Neither mass spectrometry nor enzymatic techniques are readily amenable to high throughput platforms and have been primarily used to screen one single nucleotide polymorphism (SNP) sample per reaction and analysis. Despite its high parallelization for large-scale analysis, DNA hybridization lacks ample specificity because single-base mismatches resulting from substitutions can be difficult to distinguish solely on the basis of differences in melting temperature. Furthermore, additional kinds of SNPs including insertions and deletions are found to occur at a low frequency of approximately one SNP per 12![[thin space (1/6-em)]](https://www.rsc.org/images/entities/char_2009.gif) 000 base pairs13 and can go undetected using DNA microarrays.
000 base pairs13 and can go undetected using DNA microarrays.
Separation-based gene scanning technologies, such as heteroduplex analysis (HA) or conformation sensitive gel electrophoresis,14–18 single-strand conformation polymorphism (SSCP),19,20 denaturing gradient gel electrophoresis (DGGE),21–24 and denaturing high performance liquid chromatography (DHPLC),25,26 offer decidedly less expensive alternatives to nucleotide sequencing. While all four techniques exhibit good sensitivity and robustness, they are all limited in throughput due to their inability to process highly multiplexed polymerase chain reaction (PCR) samples.27 PCR multiplexing significantly increases the throughput of genomic sample preparation, while at the same time reducing the costs for reagents (polymerase and primers) and labor. Thus, for any gene scanning technology to fully maximize its throughput potential, it must be compatible with PCR multiplexing.
One avenue toward providing this desirable compatibility is the employment of integrated multidimensional separation strategies that offer enormous resolving power for the analysis of complex mixtures. Two-dimensional (2-D) DNA gel electrophoresis, pioneered by Fischer and Lerman,28 was utilized to resolve target DNA fragments on the basis of two independent criteria, namely size and sequence. Size-resolved DNA fragments obtained from a standard gel electrophoresis separation in the first dimension were interrogated for sequence variation in the second dimension using DGGE. By combining 2-D DNA gel electrophoresis with extensive PCR multiplexing, Vijg and co-workers have developed a 2-D gene scanning technique for detecting mutational variants in several large human disease genes.29–33
Despite the selectivity and sensitivity provided by 2-D DNA gel electrophoresis, this technique, performed in a traditional slab-gel platform, consists of a series of manually intensive, time-consuming tasks, which are susceptible to irreproducibility and inferior quantitative accuracy. One promising alternative lies in a microfluidics-based approach for providing increased automation and analysis speed, enhanced reproducibility, and reduced sample and reagent consumption. Initial research in this field has demonstrated integration of intricate separation networks within miniaturized platforms for enabling high-resolution analysis of complex peptide and protein mixtures.34–40
In this work, an intricate single-layer microfluidic network is fabricated in a rigid polycarbonate substrate for performing high throughput 2-D genetic mutation analyses. Extensive finite element modeling is performed to determine the optimal geometries of the microfluidic network for minimizing non-uniformities in the electric field and analyte band dispersion caused by the presence of interconnected channels in the network. Standard gel electrophoresis is utilized in the single first dimension channel to provide a size-based separation for model multiplex PCR products. Following the electrokinetic transfer of all size-resolved DNA fragments from the first dimension into discreet second dimension channels, temperature gradient gel electrophoresis (TGGE) is employed for executing parallel mutational analyses on the size-resolved species. TGGE, analogous to DGGE, reveals the presence of sequence heterogeneity in a given heteroduplex sample by introducing a thermal denaturing gradient that results in differences between the average electrophoretic mobilities of DNA sequence variants.22–24 A bulk heater assembly is designed and employed to externally generate the temporal temperature gradient along the second dimension channels. A pH-mediated on-channel sample stacking strategy41 is further investigated for enhancing the efficiency and resolving power of the microfluidics-based 2-D gene scanning technology.
Experimental section
Materials and reagents
Boric acid, KlenTaq® DV Ready Mix, fluorescein sodium salt (excitation: 490 nm; emission: 514 nm), and poly(vinylpyrrolidone) (PVP, MW 360,000) were obtained from Sigma (St. Louis, MO). Ethylene(diaminetetraacetic acid) (EDTA) and Tris(hydroxymethyl)aminomethane (Tris) were acquired from Bio-Rad (Hercules, CA). YOYO®-1 fluorescent intercalating dye (excitation: 491 nm; emission: 509 nm) and PCR primers were purchased from Molecular Probes (Eugene, OR) and Integrated DNA Technologies (Coralville, IA), respectively. All aqueous solutions were prepared using water purified by a Nanopure II system (Dubuque, IA) and further filtered with a 0.22 µm membrane (Costar, Cambridge, MA).DNA samples and PCR reactions
Three model ds-DNA fragments of varying size (136bp, 239bp, and 450bp) and containing single-nucleotide polymorphisms (SNPs) were prepared by amplifying DNA Toolbox plasmid templates15via PCR. Briefly, 4 plasmid constructs (40-A, 40-C, 40-G, and 40-T) containing 40%-GC content and differing in sequence at one site were amplified with the required primers to achieve the desired sequence and size range in fragments. As summarized in Table 1, the three fragments, 136, 239, and 450bp in size, were referred to as Mut100, Mut200, and Mut400, respectively.| Sample name | Length (bp) | Pseudo-mut template | Mutation type | Mutation position | Primer sequence (5′ → 3′) |
|---|---|---|---|---|---|
| a Primer has a 40bp GC-clamp attached at the 5′-end. Sequence of GC-clamp is as follows: 5′ CGCCCGCCGCGCCCCGCGCCCGTCCCGCCGCCCCCGCCCG 3′ | |||||
| Mut 100 | 136 | 40-G | A to G | 89 | For = aTCATTCTCGTTTTCTGAACTG |
| sub. | Rev = ATGTTTAGACTGGATAGCGT | ||||
| Mut 200 | 239 | 40-T | C to T | 89 | For = aTCATTCTCGTTTTCTGAACTG |
| sub. | Rev = TAAGAGCAACACTATCATAA | ||||
| Mut 400 | 450 | 40-G | C to G | 110 | For = GCAATCCGCTTTGCTTCTGA |
| sub. | Rev = aAGTCAGGACGTTGGGAAGAA | ||||
One primer in each set was synthesized with a 40bp GC-rich region at the 5′-end for the purpose of artificially introducing a 40-mer GC-clamp at one end of the amplified fragments. All amplifications consisted of a 50 µL reaction volume that included 2.5 mM MgCl2, 1X PCR buffer, 200 µM dNTPs, 1.0 U Taq polymerase, 40 ng of template DNA, and 40 pmol of each primer. Each reaction was executed for 40 cycles using a PE GeneAmp PCR System 9700 (Applied Biosystems, Foster City, CA). Heteroduplex formation was achieved by performing mixed-template PCR as equimolar volumes of each template were coamplified in a single PCR reaction to generate mismatches. The concluding elongation step in the PCR was followed by a final denaturation at 94 °C for 5 min before incubating at 68 °C for 30 min. The amplified DNA was then allowed to slowly cool to room temperature over 1 h. Following amplification and heteroduplex formation, the PCR products from each reaction were desalted and the individual PCR products were pooled to simulate an aliquot from a multiplex PCR reaction.
Device fabrication
A standard lithographically patterned silicon master template containing a positive representation of the desired channel network was used to fabricate the plastic microfluidic devices from blank polycarbonate substrates via thermal embossing. Briefly, each blank polycarbonate disk, 9.0 cm in diameter and cut from 1.5 mm thick polycarbonate sheet (Sheffield Plastic, Sheffield, MA) was aligned over the silicon template and the subsequent assembly was sandwiched between two glass plates. A hydraulic press with heated platens was then used to emboss the polycarbonate substrate with an applied force of 300 psi at 160 °C for 5 min. A separate polycarbonate substrate, machined to provide channel access holes, was aligned with the embossed substrate to serve as a cover piece. The assembly was sandwiched between two glass plates and the previously embossed open channels are sealed by thermally annealing the substrates under 900 psi at 140 °C for 10 min. Finally, fluid reservoirs machined from 1.3 cm-thick polycarbonate sheet were fixed to the annealed substrates with epoxy to complete the device.As illustrated in Fig. 1, a single first dimension separation channel (7.0 cm in length, 100 µm in width, and 30 µm in depth) connecting reservoirs 3 and 4 was intersected by a cross injection channel (1.0 cm in length, 40 µm in width, and 30 µm in depth). The top side of the first dimension channel was intersected toward the outlet end by an array of eleven orthogonal second dimension fluid access channels (0.5 cm in length, 40 µm in width, and 30 µm in depth) connecting with second dimension inlet reservoirs 5. The bottom side of the first dimension channel was further intersected by an array of ten orthogonal second dimension separation channels (7.0 cm in length, 40 µm in width, and 30 µm in depth) connecting with second dimension outlet reservoirs 6. Variation in channel width and depth across a single device and between multiple devices upon thermal annealing was present at 4.7%.
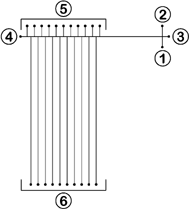 | ||
| Fig. 1 Design of 2-D polymer microfluidic network for gene mutation scanning. Individual and pooled reservoirs are labeled as: 1, sample; 2, waste; 3, first dimension-inlet; 4, first dimension-outlet; 5, second dimension-inlets; 6, second dimension-outlets. | ||
Temporal temperature control setup
As described previously,42 an aluminum heating plate with dimensions of 5.0 cm × 5.0 cm × 0.3 cm was utilized to establish an externally generated temporal temperature gradient. As illustrated in Fig. 2, a 10 W silicone rubber heater from Watlow (St. Louis, MO) was mounted on the aluminum plate along with a type-J thermocouple. The heating plate was positioned on the device so that it covered from 1.0 cm to 6.0 cm along the length of the second dimension separation channels. Even contact between the top surface of the microfluidic device and heater was achieved by mechanically fixing the heater assembly to the microfluidic device with a clamping fixture. A Watlow Series 96 single-loop auto-tuning controller was used to ramp the temperature at the desired range and rate during the separations. | ||
| Fig. 2 Illustration of the temporal temperature control setup. | ||
Finite element modeling
The electric field profile at the interface between the channels of the first and second separation dimensions was modeled using ANSYS 6.1 software (Ansys, Canonsburg, PA). Additionally, the dispersion of analyte bands during the first dimension separation and the electrokinetic transfer step was analyzed using FemLab 2.3 software (Comsol, Burlington, MA). All constants used to define the boundary conditions for the simulations such as the conductivity of the electrophoresis medium and the electrophoretic mobility of the DNA fragments were determined experimentally. The diffusion coefficient of DNA fragments was taken from the literature.432-D microfluidic gene scanning
The DNA was labeled with YOYO®-1 fluorescent intercalating dye prior to analysis. The microchannels were filled with 4.5% PVP (viscosity = 27 cP44) in 1X TBE buffer (89 mM Tris, 89 mM boric acid, 2 mM EDTA) as the polymer matrix. Briefly, a sample plug in the injection channel was introduced into the first dimension channel using the pinched-valve injection method.45 Upon resolution of the sample components by size, the voltage sources controlling the first dimension separation were disconnected, halting the electrokinetic migration of analyte bands. Immediately, the voltage sources controlling the second dimension separation were initiated, and the bands were electrokinetically transferred into discreet second dimension separation channels. Parallel TGGE analyses were then performed on each size-resolved species as the temperature in the second dimension separation channels was ramped over the desired range.A custom-designed laser-induced fluorescence detection system, as described previously,42 was utilized to monitor 2-D gene scanning separations with the 488 nm-line of an argon-ion laser. Briefly, a laser-line generator lens (Edmund Industrial Optics, Barrington, NJ) was used to expand the incident laser beam horizontally prior to focusing the beam vertically with a 15 cm focal length cylindrical lens. The orientation of the optically generated laser line was redirected vertically toward the detection window on the polycarbonate device where it spanned the second dimension channel array on the substrate. The fluorescence was monitored individually in each channel by a 16-bit cooled CCD camera (Andor Technology, South Windsor, CT) employing a 50 mm macro Nikon camera lens to focus the light onto the CCD sensor. A holographic notch filter was located in front of the CCD chip to filter out laser scattering.
pH-mediated analyte stacking following transfer to second dimension
Size-resolved DNA fragment bands were stacked following transfer to the second dimension channels by utilizing the base-mediated on-column sample concentration approach.41 Following the first dimension separation, DNA fragments were electrokinetically transferred into discreet second dimension channels for 10 s before being halted by turning off the applied voltages. To induce stacking of transferred fragments, hydroxide ions were electrokinetically injected from solution reservoirs into each channel of the second dimension array for 10 s. The parallel TGGE analyses were then carried out in the same manner as described above.Results and discussion
The promise shown by microfluidics in performing complex operations has propelled substantial research efforts toward realizing multidimensional separations in a single integrated system. Through initial demonstrations of multidimensional peptide and protein separations,34–40 these attainments further uphold the potential of microfluidic technologies in providing several unique advantages over bench-top instrumentation. These benefits include rapid and high throughput separations, improved reproducibility, ultralow sample consumption, high sensitivity, and fully automated and integrated operation.Most of the microfluidics-based multidimensional protein/peptide separations, however, are performed serially. Although powerful in their own right, serial multidimensional separation approaches suffer from noteworthy limitations. Foremost, serial multidimensional separation strategies lack the ability to simultaneously sample all components resolved in the first dimension for parallel analysis in the second dimension, thus limiting the achievable throughput.34,35,37,38,40 Furthermore, the speed of the second dimension separation must be orders of magnitude faster than that of the first dimension in order to sample the entire volume of the first dimension contents at a high enough density. Recently, parallel multidimensional separation strategies have been developed and demonstrated for high throughput 2-D protein separations using either a 6-layer poly(dimethylsiloxane) system36 or a single-layer microfluidic network fabricated in a rigid polycarbonate substrate.39
Finite element modeling of microfluidic network
When performing parallel and high throughput 2-D gene mutation analyses in a plastic microfluidic network (Fig. 1), the presence of numerous T-junctions within the first dimension separation channel introduces discontinuous sidewalls along the length of the channel. Although several research groups have studied electric field profiles at channel junctions for optimizing injection methods on microfluidic devices,45–47 there has been no discussion on the effect of such junctions on analyte dispersion in a 2-D microfluidic network. In such a case, the discontinuous sidewalls produce a non-uniform electric field distribution when the electric field lines encounter regions of reduced confinement at the T-junctions. This non-uniformity contributes to analyte band broadening that results from differential electrophoretic velocities and path lengths experienced by DNA fragments as they migrate through the first dimension separation channel.The electric field profile at a T-junction was modeled using ANSYS 6.1 software. The variation in path length traveled by analyte molecules is proportional to the depth of leakage by the electric field lines into the second dimension side channel. The field leakage depth is determined by estimating the distance into the side channel at which the magnitude of the electric field in the side channel equals 1% of the electric field in the uniform part of the first dimension separation channel. As shown in Fig. 3, the depth of field leakage can be minimized by decreasing the width of the side channels with respect to the main separation channel. Contour plots of the field profiles in these models involving T-junctions of varying width ratios provide visual affirmation of this dependence (Fig. 4).
 | ||
| Fig. 3 Effect of width ratio of side (second dimension) to main (first dimension) channel on the depth of electric field leakage into the side channel of a T-junction. | ||
 | ||
| Fig. 4 Contour plots of the electric field profiles for a T-junction with various width ratios: (A) 0.1, (B) 0.5, (C) 1.0, and (D) 1.5. | ||
Aside from diminishing the variation in path length, the ability to lessen the distortion of field lines at the T-junction further reduces band dispersion by minimizing differential electrophoretic velocities experienced by the homogenous analyte molecules in the band. Both simulated and measured analyte band dispersions were determined for a T-junction with various width ratios. The results summarized in Fig. 5 again demonstrated that the relative and additional broadening of a DNA band as it passed through a T-junction was directly dependent on the width ratio of side (second dimension) to main (first dimension) channel.
 | ||
| Fig. 5 Simulated (O) and measured (Δ) analyte band dispersion caused by the presence of a T-junction with various width ratios. Experiments were only performed for width ratios of 0.2, 0.4, and 1.0. | ||
Even though the simulated and measured analyte dispersions were in good qualitative agreement, the modeling work, however, underestimated the extent of band broadening considerably. For a T-junction with a width ratio of 0.4, the measured, relative dispersion was around 13.6% in comparison with a predicted dispersion of 7.0%. This discrepancy was mostly contributed by the simulations as they were performed using simplified, planar 2-D channels with a specified width, but no depth. The channels, in reality, have a three dimensional geometry with a trapezoidal cross-section. This added geometric dimension contributes additional distortion of the electric field in the T-junction that is unaccounted for by the current modeling work.
The relative dispersion caused by T-junctions can be reduced closer to the theoretically predicted values by eliminating silicon as the template material and utilizing alternative template fabrication processes, such as LIGA, in its place. The use of an electroplating process48 results in templates with significantly longer lifetimes, even when using higher temperature embossing conditions. More importantly, the templates are produced with vertical microchannel walls, rather than the sloped 54.7° sidewalls formed by bulk etching of single crystal silicon. This allows greater precision in channel dimensions, and further reduces variations in electric field distribution for the minimization of analyte dispersion at a T-junction.
2-D microfluidics-based gene mutation scanning
Similar to conventional 2-D DNA gel electrophoresis,28 our microfluidics-based approach seeks to take advantage of the immense resolving power of multidimensional separation strategies for maximizing the overall throughput of mutation screening analyses. In this work, a model multiplex PCR reaction product mixture consisting of three mutant DNA fragments (Table 1) was employed to study the capability of 2-D microfluidic gene scanning for analyzing the size and sequence variations in the Mut100, Mut200, and Mut400 heteroduplex samples.In lieu of manually placing or removing electrodes in each individual reservoir, the use of high voltage relays49 allowed for a higher level of system automation by enabling electrical biases to be selectively applied to, or removed from, reservoirs as needed during the sample injection, size-based separation, and parallel TGGE analyses. Relays were inserted in series between the voltage source and the electrode addressing each reservoir, providing a means for toggling individual reservoirs as desired between electrically biased and electrically floating states. Following sample injection, the first-dimension size-based separation was run for 90 s by applying an electric field strength of 200 V cm−1 between reservoirs 3 and 4 (Fig. 1). The relays for reservoirs 5 and 6 provided an open electrical circuit to the second dimension during the sample injection and first-dimension separation.
Immediately following the first-dimension separation, relays for reservoirs 1–4 were opened so they were electrically floating with respect to the circuit in the microfluidic network. An electric-field strength of 200 V cm−1 was then applied across the array of second dimension channels connecting reservoirs 5 and 6 for inducing the electrokinetic-based analyte transfer and subsequent parallel TGGE separations. As shown in Fig. 1, the placement of the second dimension fluid access (upper) channels and the second dimension separation (lower) channels was staggered with respect to each other to facilitate the electrokinetic transfer of size-resolved DNA fragments. This configuration allowed for the entire contents of the first dimension channel between the two outermost second dimension channels of the upper array to be transferred into the second dimension channels of the lower array in a single step.39 TGGE analyses were performed with an externally generated temporal thermal gradient by ramping the temperature from 72 to 75 °C over three min.
The extent of band broadening during the transfer step was largely dependent upon the electric field distribution within the intersection region, in combination with variations in total path length traveled by DNAs at different locations within the intersection. As discussed above, the minimization of analyte band broadening caused by the presence of the T-junctions during the first dimension separation called for the application of the smallest width ratio of side (second dimension) channel to main (first dimension) channel in a 2-D microfluidic network (Fig. 5). However, the degree of analyte dispersion as the result of field variation between the main and side channels during the electrokinetic transfer increased with decreasing width ratio from a value of 0.5 due to the use of a staggered configuration for the second dimension array. For the optimization of 2-D DNA separations, a microfluidic network with a width ratio of 0.4 was therefore selected in this study.
Comprehensive 2-D separations for mixtures containing Mut100, Mut200, and Mut400 heteroduplexes (Fig. 6B) were compared with the results obtained from their corresponding reference homoduplexes (Fig. 6A). The DNA mixtures were separated in the first dimension by size, followed by transferring size-resolved DNA fragments from the first dimension into channels 6–8 in the second dimension. These heteroduplexes were further analyzed for their sequence variations using parallel TGGE separations in the second dimension. Although lacking optimal resolution under one temporal temperature gradient, positive detection of SNPs in all three model heteroduplexes was achieved in less than 5 min using a microfluidics-based 2-D DNA separation platform.
 | ||
| Fig. 6 Electropherograms for comprehensive 2-D DNA separations of (A) homoduplex control and (B) heteroduplex mixtures containing Mut100, Mut200, and Mut400 fragments. Here, t=0 indicates the point at which the second dimension separation was initiated. | ||
pH-mediated DNA stacking following transfer to second separation dimension
Due to additional band broadening contributed by the presence of T-junctions in the first dimension separation and the electrokinetic transfer process, an analyte stacking strategy prior to the parallel TGGE separations was investigated for enhancing the overall efficiency and resolving power of the 2-D genetic mutation analyses. This stacking approach is based on the electrokinetic injection of hydroxide ions (Fig. 7) as demonstrated by Xiong and coworkers41 for achieving on-column concentration of DNA fragments. As hydroxide ions were injected into the array of second dimension separation channels, a neutralization reaction occurred between hydroxide ions and the cationic buffer component of Tris ions. This reaction resulted in a dynamic, sweeping zone of lower conductivity that induced a field-effect stacking of DNA fragments at the front of this low conductivity zone. | ||
| Fig. 7 Schematic of the steps involved in 2-D DNA separation protocol involving the pH-mediated on-chip sample stacking process: (A) first dimension gel electrophoresis, (B) electrokinetic transfer of size-resolved fragment to second dimension, (C) post-transfer stacking of fragment band, (D) second dimension TGGE. | ||
As illustrated in Fig. 7, the electric potential was placed in the reservoirs containing sodium hydroxide for 10 s to effectively stack the transferred DNA bands. The applied potential was then returned to the buffer reservoirs for commencing the parallel TGGE separations. A temporal thermal gradient was externally generated by ramping the temperature from 69 to 72 °C over 3 min. The lower temperature range was required due to the use of lower ionic strength buffer in this case. By reducing the size of the injected bandwidth in the second dimension, significant enhancement in sequence-dependent resolving power was evident for the results summarized in Fig. 8. The stacking process was highly reproducible with the extent to which a sample was stacked dependent on its inherent electrophoretic mobility (i.e. size). Samples with higher mobilities experience a greater extent of stacking as the band is able to retain the interface of the titration reaction for a longer period of time. In the samples used in this study, the stacking factor ranged from a 1.5× to a 2× reduction in bandwidth for the Mut400 and Mut100 samples, respectively.
 | ||
| Fig. 8 Electropherograms for comprehensive 2-D DNA separation of heteroduplex mixtures containing Mut100, Mut200, and Mut400 fragments using pH-mediated sample stacking following transfer to second separation dimension. | ||
Sensitivity of 2-D microfluidics-based gene mutation scanning
Because in many cases mutant DNA may be present in low quantities within a local population of which the majority is wild-type DNA, it is imperative that any mutation scanning technique developed for clinical applications be highly sensitive. In cancer, for example, the primary tumor site can contain a normal stromal cell fraction as high as 70%. Thus, for heterozygous mutations in which the mutation is present in only one allele, the concentration of mutant DNA can be as low as 15% of the total DNA found in the sample of interest.50 The sensitivity of the 2-D microfluidic platform for the detection of mutant DNA present at a low frequency within a wild-type background was evaluated by mixing mutant and wild-type samples in different ratios. Fig. 9 shows the electropherograms for the comprehensive 2-D DNA separation of a heteroduplex mixture containing Mut100 and Mut200 fragments present in a background of corresponding wild-type fragments at a concentration ratio of 5%. This concentration of mutant DNA in the presence of wild-type background represents the current detection limit of the 2-D microfluidics-based gene mutation scanning as a loss of signal was observed from the heteroduplex peaks for mutant concentrations below 5%. The sensitivity of the device can be further enhanced with the use of an alternative polymer substrate that exhibits lower background fluorescence at the selected detection wavelength. | ||
| Fig. 9 Electropherograms illustrating sensitivity of the 2-D microfluidic platform by demonstrating comprehensive 2-D DNA separation of a heteroduplex mixture containing Mut100 and Mut200 fragments present in a background of corresponding wild-type fragments at a concentration ratio of 5%. | ||
Conclusion
Despite the selectivity and sensitivity provided by 2-D DNA gel electrophoresis, this technique as practiced today is a collection of manually intensive and time-consuming tasks, prone to irreproducibility and poor quantitative accuracy. To increase the throughput in a cost-effective manner, the obvious strategies are automation and miniaturization. A single-layer 2-D microfluidic network is therefore fabricated in a rigid polycarbonate substrate with the promise for increasing the throughput of genetic mutation screening.In this work, the capability of the microfluidics-based 2-D DNA separation platform is initially demonstrated through the analysis of simulated multiplex PCR products of varying size and sequence. Size variants are segregated using standard gel electrophoresis in the first dimension. Following the first dimension separation, the size-resolved DNA fragments are subsequently transferred to discrete second dimension channels where parallel, sequence-based TGGE separations are performed to interrogate each size variant for sequence heterogeneity using a temporal temperature gradient. A comprehensive 2-D DNA separation for positive detection of all SNPs in model heteroduplexes is achieved in less than 5 min.
Extensive finite element modeling is employed for the optimization in the design of 2-D microfluidic network. The minimization of width ratio of side (second dimension) to main (first dimension) channel is crucial in counteracting the analyte band dispersion caused by discontinuous sidewalls in the main channel. Furthermore, a pH-mediated analyte band stacking strategy is employed prior to parallel TGGE separations for improving the overall efficiency and resolution of the 2-D genetic mutation analyses.
For diagnostic systems such as the one presented in this study, it is critical to eliminate the occurrence of false positives and negatives, especially if they are to be used with any confidence in a clinical setting. Of concern for this technology is the generation of false positives during the process of transferring size-resolved bands from the first dimension separation channel to the second dimension array when analyzing highly complex samples. The obvious case where this can occur is when two bands reside in the same section of the first dimension channel at the conclusion of the size separation. In this case more than one band is transferred into a single second dimension channel creating the potential to falsely identify one or both of those PCR products as containing sequence heterogeneity. The palpable solution for handling this issue is to find a way to boost the resolving power of the analysis. Here, the resolving power can be greatly enhanced by utilizing microfluidic networks containing a higher density of second dimension channels for increasing the number of size-resolved fractions. Although a higher density of discontinuous sidewalls in the main channel would contribute additional band broadening during the size separation, this can be counteracted effectively with further optimization in the design of the 2-D microfluidic network, including modification of the T-junction geometry. By modifying the T-junction geometry, preliminary results of finite element modeling indicate that a 10-fold further reduction in band dispersion is possible (data not shown) in addition to what can be achieved by controlling the width ratio (Fig. 4) of side channel to main channel alone.
In moving to a higher density of second dimension channels, it is clear that there will be an increased probability for a single band to be split and fractioned into two separate second dimension channels during the transfer process. In such a case, since the split bands possess the same electrophoretic mobility, they are likely to maintain nearly identical migration times in the adjacent second dimension channels during the sequence separation. As a result this issue can be managed by developing analysis software that has the capability to recognize bands in adjacent channels possessing nearly identical migration times and peak profiles and identify the signals as originating from the same PCR product.
Additionally, the use of a two-colored fluorescence detection scheme and internal DNA size standards (labeled differentially from the PCR products) can be incorporated to optimize reproducibility. Because slight variations can result between devices as a result of the fabrication process, it is necessary to account for consequential variability in the 2-D electropherograms, especially for complex multiplex PCR samples. Differentially labeled DNA internal size standards will provide markers that can be used to normalize the electropherograms between runs and between devices.
In future work, the fabrication of a microfluidic network containing a higher density of second dimension channels will be implemented with the optimized t-junction geometry. A second dimension microchannel array of higher density will enable this technique to screen highly complex mixtures of gene fragments amplified in a multiplexed format, such as MLH1 and MSH2 (MutS protein homolog 2) among others, in a clinical setting. Ultimately, the potential of parallel 2-D microfluidics to rival and even supercede conventional mutation screening methods with a more automated, portable, rapid, reproducible, and sensitive genomic technology is validated.
Acknowledgements
The authors thank Dr. Caren Chang from the Department of Cell Biology and Molecular Genetics, University of Maryland for providing assistance with the PCR conducted in this study. Support for this work by the National Cancer Institute through Grant CA092819 is also gratefully acknowledged.References
- J. M. Meyer and G. S. Ginsburg, Curr. Opin. Chem. Biol., 2002, 6, 434–438 CrossRef CAS.
- J. A. Johnson and W. E. Evans, Trends Mol. Med., 2002, 8, 300–305 Search PubMed.
- B. M. Paegel, C. A. Emrich, G. J. Wedemayer, J. R. Scherer and R. A. Mathies, Proc. Natl. Acad. Sci. USA, 2002, 99, 574–579 CrossRef CAS.
- D. J. Cutler, M. E. Zwick, M. M. Carrasquillo, C. T. Yohn, K. P. Tobin, C. Kashuk, D. J. Mathews, N. A. Shah, E. E. Eichler, J. A. Warrington and A. Chakravarti, Genome Res., 2001, 11, 1913–1925 CAS.
- J. Alper, Science, 1998, 279, 2044–2045 CrossRef CAS.
- J. Stoerker, J. D. Mayo, C. N. Tetzlaff, D. A. Sarracino, I. Schwope and C. Richert, Nature Biotech., 2000, 18, 1213–1216 CrossRef CAS.
- C. A. Mein, B. J. Barratt, M. G. Dunn, T. Siegmund, A. N. Smith, L. Esposito, S. Nutland, H. E. Stevens, A. J. Wilson, M. S. Phillips, N. Jarvis, S. Law, M. de Arruda and J. A. Todd, Genome Res., 2000, 10, 330–343 CrossRef CAS.
- S. Tyagi, D. P. Bratu and F. R. Kramer, Nature Biotech., 1998, 16, 49–53 CrossRef CAS.
- A. J. Schafer and J. R. Hawkins, Nature Biotech., 1998, 16, 33–39 CrossRef CAS.
- K. J. Livak, Genet. Anal., 1999, 14, 143–149 CrossRef CAS.
- J. M. Shumaker, A. Metspalu and C. T. Caskey, Hum. Mutat., 1996, 7, 346–354 CrossRef CAS.
- T. Pastinen, A. Kurg, A. Metspalu, L. Peltonen and A. C. Syvanen, Genome Res., 1997, 7, 606–614 CAS.
- D. G. Wang, J. B. Fan, C. J. Siao, A. Berno, P. Young, R. Sapolsky, G. Ghandour, N. Perkins, E. Winchester, J. Spencer, L. Kruglyak, L. Stein, L. Hsie, T. Topaloglou, E. Hubbell, E. Robinson, M. Mittmann, M. S. Morris, N. Shen, D. Kilburn, J. Rioux, C. Nusbaum, S. Rozen, T. J. Hudson, R. Lipshutz, M. Chee and E. S. Lander, Science, 1998, 280, 1077–1082 CrossRef CAS.
- A. J. Nataraj, I. Olivos-Glander, N. Kusukawa and W. E. Highsmith, Electrophoresis, 1999, 20, 1177–1185 CrossRef CAS.
- W. E. Highsmith, Q. Jin, A. J. Nataraj, J. M. O'Connor, V. D. Burland, W. R. Baubonis, F. P. Curtis, N. Kusukawa and M. M. Garner, Electrophoresis, 1999, 20, 1186–1194 CrossRef CAS.
- H. Tian, L. C. Brody and J. P. Landers, Genome Res., 2000, 10, 1403–1413 CrossRef CAS.
- G. A. Thomas, D. L. Williams and S. A. Soper, Clin. Chem., 2001, 47, 1195–1203 CAS.
- I. V. Kourkine, C. N. Hestekin, B. A. Buchholz and A. E. Barron, Anal. Chem., 2002, 74, 2565–2572 CrossRef CAS.
- K. Hebenbrock, P. M. Williams and B. L. Karger, Electrophoresis, 1995, 16, 1429–1436 CAS.
- H. Tian, A. Jaquins-Gerstl, N. Munro, M. Trucco, L. C. Brody and J. P. Landers, Genomics, 2000, 63, 25–34 CrossRef CAS.
- C. Gelfi, S. C. Righetti, F. Zunino, G. Della Torre, M. A. Pierotti and P. G. Righetti, Electrophoresis, 1997, 18, 2921–2927 CAS.
- J. Schell, M. Wulfert and D. Riesner, Electrophoresis, 1999, 20, 2864–2869 CrossRef CAS.
- Q. Gao and E. S. Yeung, Anal. Chem., 2000, 72, 2499–2506 CrossRef CAS.
- L. Zhu, H. K. Lee, B. Lin and E. S. Yeung, Electrophoresis, 2001, 22, 3683–3687 CrossRef CAS.
- L. A. Ellis, C. F. Taylor and G. R. Taylor, Hum. Mutat., 2000, 15, 556–564 CrossRef CAS.
- E. Holinski-Feder, Y. Muller-Koch, W. Friedl, G. Moeslein, G. Keller, J. Plaschke, W. Ballhausen, M. Gross, K. Baldwin-Jedele, M. Jungck, E. Mangold, H. Vogelsang, H. K. Schackert, P. Lohsea, J. Murken and T. Meitinger, J. Biochem. Biophys. Methods, 2001, 47, 21–32 CrossRef CAS.
- D. F. Barker, Hum. Mut., 2000, 16, 334–344 Search PubMed.
- S. G. Fischer and L. S. Lerman, Cell, 1979, 16, 191–200 CrossRef CAS.
- C. Eng and J. Vijg, Nature Biotech., 1997, 15, 422–426 CrossRef CAS.
- N. J. van Orsouw, X. Zhang, J. Y. Wei, D. R. Johns and J. Vijg, Genomics, 1998, 52, 27–36 CrossRef CAS.
- N. J. van Orsouw, R. K. Dhanda, R. D. Rines, W. M. Smith, I. Sigalas, C. Eng and J. Vijg, Nucleic Acids Res., 1998, 10, 2398–2406 CrossRef.
- J. Vijg and N. J. van Orsouw, Electrophoresis, 1999, 20, 1239–1249 CrossRef CAS.
- M. Bounpheng, S. McGrath, D. Macias, N. van Orsouw, Y. Suh, D. Rines and J. Vijg, J. Med. Genet., 2003, 40, e33–e35 Search PubMed.
- R. D. Rocklin, R. S. Ramsey and J. M. Ramsey, Anal. Chem., 2000, 72, 5244–5249 CrossRef CAS.
- N. Gottschlich, S. C. Jacobson, C. T. Culbertson and J. M. Ramsey, Anal. Chem., 2001, 73, 2669–2674 CrossRef CAS.
- X. Chen, H. Wu, C. Mao and G. M. Whitesides, Anal. Chem., 2002, 74, 1772–1778 CrossRef CAS.
- A. E. Herr, J. I. Molho, K. A. Drouvalakis, J. C. Mikkelsen, P. J. Utz, J. G. Santiago and T. W. Kenny, Anal. Chem., 2003, 75, 1180–1187 CrossRef CAS.
- J. D. Ramsey, S. C. Jacobson, C. T. Culbertson and J. M. Ramsey, Anal. Chem., 2003, 75, 3758–3764 CrossRef CAS.
- Y. Li, J. S. Buch, F. Rosenberger, D. L. DeVoe and C. S. Lee, Anal. Chem., 2004, 76, 742–748 CrossRef CAS.
- Y.-C. Wang, M. H. Choi and J. Han, Anal. Chem., 2004, 76, 4426–4431 CrossRef CAS.
- Y. Xiong, S.-R. Park and H. Swerdlow, Anal. Chem., 1998, 70, 3605–3611 CrossRef CAS.
- J. S. Buch, C. Kimball, F. Rosenberger, W. E. Highsmith, D. L. DeVoe and C. S. Lee, Anal. Chem., 2004, 76, 874–881 CrossRef CAS.
- A. E. Nkodo and B. Tinland, Electrophoresis, 2002, 23, 2755–2765 CrossRef CAS.
- Q. Gao and E. S. Yeung, Anal. Chem., 1998, 70, 1382–1388 CrossRef CAS.
- S. V. Ermakov, S. C. Jacobson and J. M. Ramsey, Anal. Chem., 2000, 72, 3512–3517 CrossRef CAS.
- L.-M. Fu, R.-J. Yang, G.-B. Lee and H.-H. Liu, Anal. Chem., 2002, 74, 5084–5091 CrossRef CAS.
- L.-M. Fu and C.-H. Lin, Anal. Chem., 2003, 75, 5790–5796 CrossRef CAS.
- S. A. Soper, S. M. Ford, S. Qi, R. L. McCarley, K. Kelly and M. C. Murphy, Anal. Chem., 2000, 72, 643A–651A CAS.
- S. C. Jacobson, S. V. Ermakov and J. M. Ramsey, Anal. Chem., 1999, 71, 3273–3276 CrossRef CAS.
- N. P. Gerry, N. E. Witowski, J. Day, R. P. Hammer, G. Barany and F. J. Barany, Mol. Biol., 1999, 292, 251–262 CrossRef CAS.
| This journal is © The Royal Society of Chemistry 2005 |