Apoptotic cell death dynamics of HL60 cells studied using a microfluidic cell trap device
Ana
Valero
a,
Francisco
Merino
a,
Floor
Wolbers
ab,
Regina
Luttge
a,
Istvan
Vermes
b,
Helene
Andersson
ac and
Albert
van den Berg
*a
aBIOS, the Lab-on-a-chip Group, MESA+ Institute for Nanotechnology, University of Twente, PO Box 217, 7500 AE, Enschede, The Netherlands. E-mail: a.vandenberg@ewi.utwente.nl; Fax: +31534892287; Tel: +31534892691
bDepartment of Clinical Chemistry, Medisch SpectrumTwente, Hospital Group, Enschede, The Netherlands
cRoyal Institute of Technology, Microsystem Technology, 100 44 Stockholm, Sweden
First published on 6th December 2004
Abstract
This paper presents the design, fabrication and first results of a microfluidic cell trap device for analysis of apoptosis. The microfluidic silicon-glass chip enables the immobilization of cells and real-time monitoring of the apoptotic process. Induction of apoptosis, either electric field mediated or chemically induced with tumour necrosis factor (TNF-α), in combination with cycloheximide (CHX), was addressed. Exposure of cells to the appropriate fluorescent dyes, FLICA and PI, allows one to discriminate between viable, apoptotic and necrotic cells. The results showed that the onset of apoptosis and the transitions during the course of the cell death cascade were followed in chemically induced apoptotic HL60 cells. For the case of electric field mediated cell death, the distinction between apoptotic and necrotic stage was not clear. This paper presents the first results to analyse programmed cell death dynamics using this apoptosis chip and a first step towards an integrated apoptosis chip for high-throughput drug screening on a single cellular level.
Introduction
There are many ways to die, but nature only knows two: programmed cell death (apoptosis) and accidental cell death (necrosis). The term apoptosis defines a genetically encoded cell death program, which is morphologically, biochemically and molecularly distinct from necrosis.1,2 Apoptosis is a kinetic event.3 The entire duration of apoptosis, from onset to total disintegration of the cell is relatively short and of variable length in comparison to duration of cell cycle time. The various inducers of apoptosis start the process by activation of intracellular cysteine-aspartic acid proteases (caspases).4,5 The process of their activation is considered to be the key event of apoptosis.Apoptosis is studied both as a target for drug discovery and as a cellular process. Suppression or enhancement of apoptosis is known to cause or contribute to many diseases such as cancer neurodegenerative diseases and AIDS.1 Apoptosis occurs during the period of embryogenesis and goes on during post-embryonic life, thus controlling cell numbers and organ size in a dynamic balance between cell proliferation and cell death. Apoptosis is a very complex biological process to study. For example, the duration of apoptosis is short, involves single cells with morphological changes only after the “point of no return”, ending in phagocytosis without reaction in the neighbour cell.1
At present there are about 300 different apoptosis-related kits and techniques that are developed for apoptosis detection and quantification.6 However, all of these techniques have a number of limitations, the most important of which is that cells must be stained, fixed or destroyed for analysis, meaning that intact cells cannot be analysed today.1,2 There are no methods available for studying apoptosis of single cells. In addition, cell preparation for analysis is time consuming (at least 15–30 min) and therefore real-time monitoring of the cell death cascade is not available or it can only be reconstructed from flow cytometry measurements of cell samples stained at different stages of the apoptotic process. Further, conventional bioanalytical techniques need highly sophisticated equipments and technicians to perform these measurements which are very labour-consuming and expensive. Hence, there is a real need for simple chip technology to study apoptosis in real-time on single cell level with high-throughput that will provide valuable additional and complementary information to existing conventional methods to analyse the process of apoptosis.7–10
Recent advances in microfluidic Lab-on-a-Chip techniques have increased the potential of high-throughput biochemical assays on individual mammalian cells. Of particular interest is the ability to parallelize up-front assay protocols and still be able to examine and treat every individual cell in the assay separately retrieving single-cell event information.11–13
Studying apoptosis on chip is a completely new approach which has almost not been explored at all. Until today, only three reports on apoptosis analysis on chips were presented.14–16 In all three reports either cell labeling, cell lysis or very advanced optical system are required. Hence, none of the drawbacks for the conventional techniques were circumvented.
In this paper real-time monitoring of individual cells is addressed presenting the geometrical design, chip fabrication and first results of apoptosis studies in a new microfluidic assay format. The cross-flow devices introduced in this study offer to broaden the tools to characterize single cells in a format that allows integration of high-throughput techniques with unique assay functionality, for example, to identify the apoptotic cascade of HL60 cells.
Integration techniques such as known from microelectronics allow placing electrodes close to a single cell either to stimulate the cell or reading the cell impedance, which can give a measure for the cell status.17,18 High-throughput is achieved if electrodes and cells are arranged in an array (parallel) fashion. The device as introduced here presents an intermediate step towards this class of operations by first positioning cells in pre-defined locations of the chip leading to a one dimensional array of cells under investigation. In this stage of development optical detection is performed to compare the results to classical methods.3 Numbering-up of devices and two dimensional arrayed cell investigation can increase the throughput of observed events. Translating the optical information in cell impedance spectra can help to further optimize automated operation on a large number of cells without the need for complex optical and robotic equipment.
The aim of this work is to eventually be able to measure apoptotic cell death dynamics on a chip in real-time on single cell level. A new microfluidic chip has been developed in which the apoptotic process can be optically followed. Electric field mediated and chemically induced cell death has been attempted. Exposure of cells to a fluorochrome-labeled inhibitor of caspases (FLICA) labels cells after caspase activation and arrest further progress of the apoptotic cascade.3,19 Loss of membrane integrity (late apoptosis and necrosis) was observed by exposing cells to propidium iodide (PI).
Experimental
Instrumentation
An experimental system was designed and built which allows observation of the temporal evolution of fluorescent and light microscopy changes in HL60 cells following apoptosis and electroporation applications. The chip was mounted on to an X–Y–Z translation stage in an inverted microscope (Leica DM IRM, Leica Microsystems, Wetzlar, GmbH, Germany). The microscope system is equipped with a mercury lamp, 20×, 40×, 50× objectives, and the fluorescence filter set (BP 450–490, LP 515). In addition, a computer-controlled CCD camera (Colorview 8) is mounted in the microscope for image recording.For the electroosmotic flow (EOF) control a computer-controlled high-voltage power supply (CU 411, IBIS technologies BV, Hengelo, The Netherlands) with four independently controllable positive voltage outputs was used. Gold wires immersed in the reservoirs of a chip holder were used for making the electrical connection to the high-voltage supply unit with the fluid in the chip.
Design and fabrication of the cell trap device
The microfluidic cell trapping device consists of two channels which join together in a crossway (Fig. 1a). The cell trapping microstructures are located in the vicinity of this crossway acting as a filter, i.e. fluid can flow through the trap whereas the cells will block them at least partially. Feature sizes somewhat smaller than the cells that we want to trap, are required. For this purpose, narrow openings which consist in vertical sidewalls are designed across the channel (see Fig. 2). Several different geometries of the mechanical trap were designed. The trapping microstructures differ from each other in the shape, size, number of trapping sites as well as the number of exits (narrow openings between traps). The diversity of designs should allow defining which trapping microstructure configuration is the most suitable for analysing apoptosis on chip. Fig. 1b and 1c show the photographs of the two different trapping layouts used for the experiments in this paper. The mechanical trap shown in Fig. 1b (layout 1) contains traps that differ in size. The diameters of the trapping sites vary from 8 µm to 12 µm from top to bottom in this figure. In addition, narrow openings of 3 µm diameter are located between the trapping sites. This layout has been designed as a test structure to determine the most suitable size of the trap. The second layout shown in Fig. 1c (layout 2) shows a mechanical trap with identical trap diameters (10 µm) and no exit channels are present between them. The 10 µm diameter of the traps was chosen because this is approximately the size of HL60 cells used for the experiments. Fig. 2 shows a SEM picture of the trapping sites (close-up) designed in layout 1. For both layouts, the dimensions of the channels are 15 µm deep, 200 µm wide and 12 mm long, fabricated with the process that is described in the paragraph below.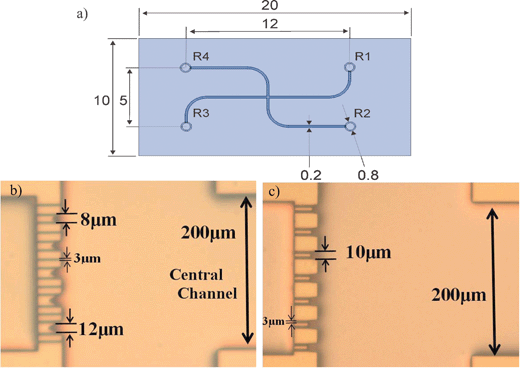 | ||
| Fig. 1 (a) Drawing of the microfluidic chip with dimensions in mm. Photographs of the trapping sites, (b) layout 1 and (c) layout 2, in the microfluidic chip design. | ||
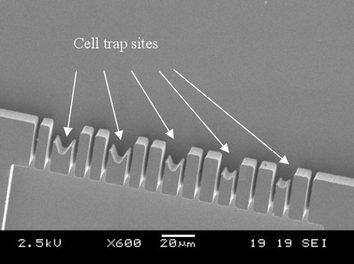 | ||
| Fig. 2 SEM picture of the trapping sites (close-up) for layout 1. | ||
The devices are made of a silicon/glass sandwich. The schematic of the fabrication process is shown in Fig. 3. In the silicon substrate the microfluidic channels and trapping sites are etched by reactive ion etching using the Bosch process (a–d). Access holes from the back side of the silicon wafer are powderblasted (e). After this step the silicon wafer is thermally oxidized at 1100 °C (g). A glass wafer is anodically bonded to the silicon wafer (h) which allows the visualization of the channels and the trapping process as well as optical detection of the fluorescence signal.
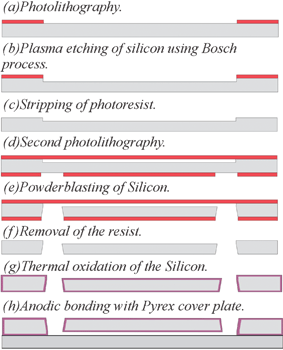 | ||
| Fig. 3 Schematic of the fabrication process. | ||
HL60 cells
Human promyelocytic leukemic HL60 cells were obtained from the German Collection of Microorganisms (Braunschweig, Germany). HL60 cells were cultured in RPMI-1640 medium supplemented with 10% heat-inactivated and filter-sterilized Fetal Calf Serum, 100 IU ml−1 penicillin, 100 mg ml−1 streptomycin, 2 mM L-Glutamine and 250 µg ml−1 fungizone (RPMI+ medium). RPMI-1640 medium was obtained from BioWhittaker (Verviers, Belgium). Supplements and antibiotics were all obtained from Life Technologies (Grand Island, NY, USA). Cell cultures were maintained in a 5% CO2 humidified atmosphere at 37 °C.Sample treatment
Different reagents were needed depending on the purpose of the experiment. Therefore, cell treatment differs for each experiment. To validate the estimations obtained with our simulations, HL60 cells suspended in RPMI+ medium (0.5 × 10⁶ cells ml−1) were mixed with propidium iodide (PI) (Sigma, St. Louis, MO, USA) to obtain a final concentration of 4 µM, at room temperature and isolated from light one hour before the experiment took place. PI is a fluorescent nucleic acid dye that cannot penetrate a viable cell membrane and is thus used extensively as a tracer for surface membrane integrity in living cells. If the cell membrane looses its integrity (late apoptosis and necrosis), PI rapidly enters the cell and readily binds to DNA in the nucleus, developing light to dark red fluorescence. The fluorescence intensity varies with the quantity of PI bound to the DNA providing quantitative information as PI saturates dead and dying cells.To be able to discriminate between apoptosis and necrosis, the cell treatment was as follows; 125 µl of HL60 cells (0.5 × 10⁶ cells ml−1) were treated with 15 µL of PI (1.5 µM final concentration) and 10 µL of the inhibitor FLICA (20 mM final concentration; FLICA is a mixture of 5 mM FAM-VAD-FMK and 15 mM z-VAD-FMK) obtained from Intergen Co. (Purchase, NY, USA). FLICA blocks the activation of caspases and arrests further progress of the apoptotic cascade and prevents cellular desintegration. In the last case, to study the effect of the apoptotic inducer TNF-α, 99.5 µl of HL60 cells (0.5 × 10⁶ cells ml−1) were treated with 15 µL TNF-α/10.5 µL CHX (3 nM/50 µM final concentrations) (Sigma, St. Louis, MO, USA), 15 µL of PI (1.5 µM) and 10 µL of the inhibitor FLICA (20 mM). Immediately after the cell sample preparation, 100 µl of this sample solution was introduced manually in the inlet reservoir of the central channel (see Fig. 1a, inlet R1)
Procedures
Before starting experiments, the chip was conditioned by rinsing with 100 mM NaOH. In this way all the silanol groups of the wall become activated and we attain the same surface charge at each experiment. Afterwards, NaOH is first replaced by flowing DI water and then by RPMI+ medium that was used as the electrolyte for the electroosmotic flow (EOF) control. 100 µl of the cell sample treated was introduced manually in the inlet reservoir (R1) of the central channel (see Fig. 1a). The same volume of RPMI+ medium was introduced in each of the rest reservoirs (R2, R3, and R4). A four point voltages scheme at all reservoirs is used to drive the cells towards the trap (see paragraph cell handling).Cell handling on microfluidic cell-trap chip
The integrated trapping structure in a flow-through chip represents a way of handling single cells. Cells were here transported within the microfluidic channels by means of electroosmotic flow (EOF). EOF control experiments were carried out in both layouts in order to perform single cell handling and positioning.The voltage scheme used for driving the cells from the central channel towards the trapping sites was set at the sample compartment (R1) to 100 V, at the reservoir behind the trap (R3) to 0 V and at the other two reservoirs to 50 V (see Fig. 1a). These settings were maintained until the cells were getting close to the trapping sites. At this moment, the electrical resistance in the trapping site is increased due to the presence of the cells and in order to continue addressing the coming cells towards the trap the voltage in the reservoirs 2 and 4 was increased to a value of 80 V.
At first, by using the cell trap device with layout 1 (Fig. 1b), we observed that cells get trapped also at the small side channels located between the traps. Therefore for the next series of experiments the mechanical trap with layout 2 (Fig. 1c) was used, where all the traps have the same size.
Results and discussion
Simulation and determination of system parameters
Using equivalent electrical circuit design for the electrolyte-filled sections of the microfluidic network, an estimation of the potential drop across the trap feature can be made as shown in Fig. 4. Conductivity of the medium (1.363 S m−1), dimensions of the channels and traps/geometry and voltage scheme used during the EOF experiments were the input values for the program. It is assumed that cells sit perfectly at the traps and seal them nicely giving a high electrical resistance, Mega ohm sealing. At a driving voltage scheme indicated in the previous section (V1 = 100 V, V2 = 50 V, V3 = 0 V and V4 = 50 V) and for the case where all the traps are free, the voltage drop across the trap (1 V) exceeds already the transmembrane potential and cell membrane permeabilization can occur.15,16 If the number of traps blocked increases the total voltage drop over the trap becomes higher.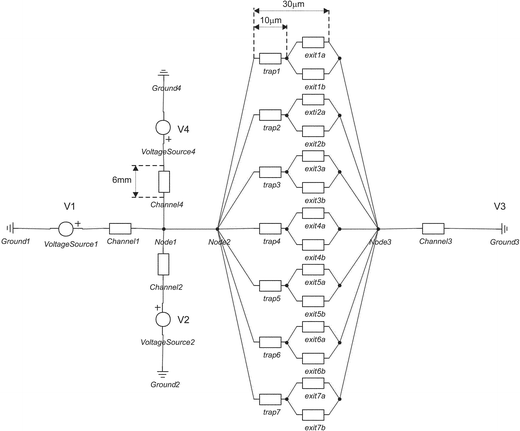 | ||
| Fig. 4 Equivalent electrical circuit of the cell trapping device (layout 2) using 20-Sim (Control Lab Products B. V., Enschede). | ||
Apoptotic and necrotic cell death dynamics studies on chip. Morphological assessment of cell death by fluorescence microscopy
(1) Electric field mediated cell death
We performed the following assessment in order to check whether the potential drop over the trap will be powerful enough to create cell death (either via apoptosis or necrosis) due to cell membrane permeabilization. At the beginning of the experiment, the cell sample was viewed under the mercury lamp and no PI uptake was observed. However, at the time the cells were sitting in the trap, red fluorescence was shown, meaning that the cell membrane has lost its integrity by the applied electric field. To determine if the loss in cell membrane integrity has been caused by the applied electric field or by mechanical lysis through the microchannels the following experiment was carried out. In this case, cells were driven towards the trapping sites by means of pressure driven flow (PDF). Once the cells were located in the traps no PI uptake was observed. At this point, by switching on the EOF voltage scheme mentioned above in the cell handling section, we observed the uptake of PI by the red fluorescence of the cells sitting in the traps (data not shown). Therefore, we can conclude that cell membrane disruption is caused by the applied electric field and not due to mechanical lysis.In Fig. 5 the result of the EOF driven cell trapping is shown. Fig. 5a shows the fluorescence image of the first cells trapped when the voltage scheme is on; cells inside of the trap took up PI immediately after docking. Fig. 5b shows the light microscopy image of the cells 10 s after the electroosmotic flow was stopped and Fig. 5c is the fluorescence image of Fig. 5b. Comparing Fig. 5b and 5c, we can conclude that the cells inside of the trap show the red fluorescence but the cells in the vicinity of the trap do not, and they can be further investigated (as done in subsection 3). Observation of the cells located in other places apart from the trap, e.g. channels, did not show red fluorescence, therefore we can conclude that the presence of the EOF in the channels did not affect the cell viability as shown in Fig. 5d and 5e. With this assessment we were able to show the electropermeabilization effect of the applied electric field used for the microfluidic control over the cells being located in the trap. Likewise, the experiment confirms the validity of our simulations. On the other hand, with the performed experiment it is not possible to discriminate whether the cells are dead (necrotic cell) or in the process of dying (late apoptotic cell), because in both cell states the cell membrane has lost its integrity, thus showing red fluorescence. In the next step an apoptotic indicator (FLICA) will be added to the cell sample in order to find out whether cells die through apoptosis or necrosis when an electric field is applied.
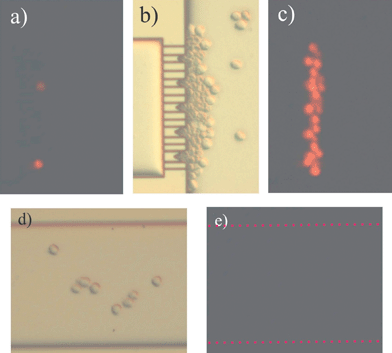 | ||
| Fig. 5 PI uptake in HL60 cells sitting at the trap due to the high electric field lines density. (a) Fluorescence image at the time the HL60 cells arrive at the trap. (b) Light microscopy image of the cells 10 s after EOF control was stopped. (c) Fluorescence image from image (b). (d) Light microscopy image of the central channel (R1). (e) Fluorescence image from image (d). | ||
(2) Discrimination between apoptotic and necrotic cells
In the previous experiment we confirmed that cell death was electric field mediated in HL60 cells sitting at the trap. In order to determine whether apoptotic or necrotic processes occurred an apoptosis indicator, FLICA, was used. When cells enter apoptosis, intracellular FLICA binds to activated caspases and blocks their action arresting further progress of the apoptotic cascade and preventing cellular desintegration.In Fig. 6a it is observed that during the EOF control cells moved towards the trap in the direction of the EOF, while FLICA, being a negative charged molecule moved by means of its electrophoretic mobility. The trapped cells showed red fluorescence, in agreement with the previous experiment. Once the EOF was stopped, FLICA diffused towards the trap where cells were located (see Fig. 6b). At this point, the cells first showing red fluorescence now show red (PI) and green (FLICA) fluorescence (FLICA+/PI+, see Fig. 6c). This bicolor fluorescence pattern is characteristic of cells being at the late apoptotic state. These results could suggest that apoptotic cell death was induced by the electric field applied. In the case that the electric field mediated cell membrane permeabilization is reversible, meaning that the cell membrane reseals after the EOF voltage is off, the presence of the green fluorescencent label (FLICA+) will determine if the process of apoptosis is activated by the applied electric field, because FLICA only binds to activated caspaspes within the cell. At this point of the experiment, the reversible or irreversible electropermeabilization of the cell membrane remains uncertain and the green fluorescence label can be either by diffusion through a disrupted cell membrane or by caspase activation. However, impedance measurements could allow us to know if resealing of the cell membrane has occurred.
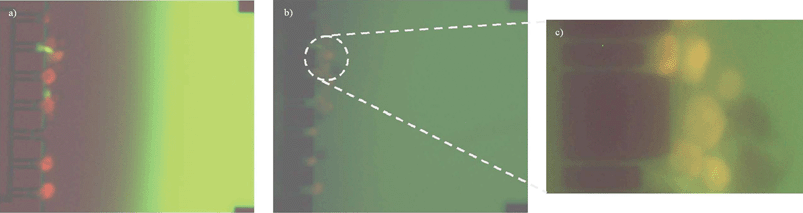 | ||
| Fig. 6 Cell discrimination by fluorescence. (a) EOF control on; cells sitting at the trap get permeable and PI is uptaken. FLICA moves by means of its electrophoretic mobility. (b) EOF control off; FLICA diffuses and enters in contact with the cells being located at the trap, (c) zoom in from Fig. 6b. Cells sitting in the traps show the green (FLICA+) and red (PI+) fluorescence. A second row of cells that have not received the influence of the electric field do not show any fluorescence label; no apoptosis has been induced, viable cells (FLICA−/PI−). | ||
(3) Apoptotic cell death dynamics on a chip
To ensure that apoptotic cell death is induced, HL60 cells were incubated with a mixture of TNF-α and CHX. Apoptotic cell death dynamics were studied in real-time on a chip (using layout 2) at single cell level. Time point zero is considered the moment that the cell sample (consisting of HL60 cells, FLICA, PI and TNF-α/CHX) was introduced in the chip reservoir R1.As described in literature, inducing apoptosis and labeling cells with FLICA and PI makes it possible to identify four subpopulations with flow cytometry: (i) Viable or non-apoptotic cells show neither FLICA nor PI fluorescence. (ii) In the initial phase of apoptosis, the caspases become activated and FLICA binds to these activated caspases while the plasma membrane is still able to exclude PI. In the initial phase of apoptosis, HL60 cells are FLICA+/PI−, early apoptotic. (iii) Subsequently, HL60 cells lose their plasma membrane integrity and their ability to exclude PI. These late apoptotic cells are FLICA+/PI+. (iv) Finally, HL60 cells lose the ability to bind FLICA, because the caspases are either inhibited or degraded, and become FLICA−/PI+. This phase is called the ‘necrotic stage’ of apoptosis. In the continuous presence of FLICA, this latter phase (FLICA−/PI+) is normally not visible, due to the fact that FLICA arrests the apoptotic pathway in the late apoptotic phase.
Fig. 7 shows the bivariate distributions of green and red fluorescence intensity from TNF-α/CHX-treated cells exposed to FLICA and PI in the microfluidic cell trap device. HL60 cells, in the continuous presence of FLICA, transit from the viable stage to the early apoptotic stage and then to the late apoptotic stage (see black dotted circles in Fig. 7, lower and upper cell).
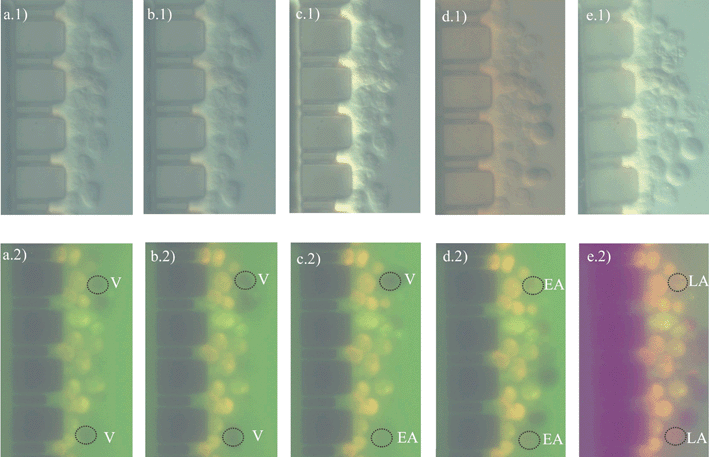 | ||
| Fig. 7 Optical images of cell death dynamics. Light (1) and fluorescence (2) microscopy images of HL60 cells sitting at the trap over time. (a) 1 h, (b) 2 h, (c) 4 h, (d) 6 h, (e) 24 h. V: Viable cell; EA: Early apoptotic; LA: Late apoptotic. | ||
At completion of the experiment, analysis of the fluorescence images from Fig. 7 was performed. For each series of fluorescent images, areas of interest were defined manually for each cell (named upper and lower cell) upon their positions over time. Image areas of approximately of 92 × 93 pixels2 containing one cell only, were estimated from the white light image. The average green and red scale intensity of each area of interest was then automatically calculated for each image. This was calculated, for the two cells of interest, three times and an average value ± std dev. is given. Consequently, the temporal development of FLICA and PI fluorescence in individual cells across time could be graphed as mean fluorescence intensity (in arbitrary units) versus time, as shown in Fig. 8. An increase in FLICA fluorescence (between 4 and 6 h) determines that the apoptotic process has been activated.
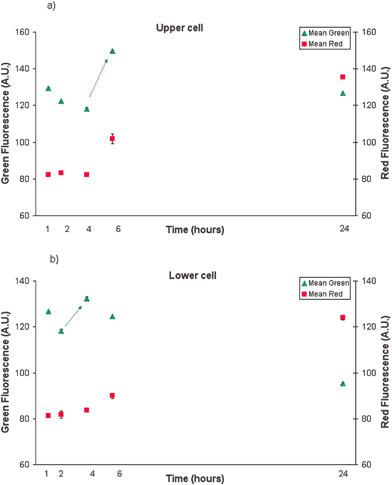 | ||
| Fig. 8 TNF/CHX induced apoptotic cell death dynamics. Green (FLICA) and red (PI) fluorescence intensity of upper (a) and lower (b) HL60 cell in time (trend is indicated by the arrow.) | ||
Conclusions
Here we present for the first time that it is possible to follow the steps in apoptotic cell death cascade in real time within our newly developed microfluidic cell trapping device. Localization of cells in the trap allows light and fluorescent imaging on several cells on a single cell basis simultaneously within the field of view. Therefore, the cellular changes appearing when inducing apoptosis can be visualized by both light microscopy and through the bivariate distributions of green (FLICA) and red (PI) fluorescence. HL60 cells incubated with TNFα/CHX transit from viable to early apoptotic and eventually to late apoptotic in the continuous presence of FLICA, during the course of the cell death cascade.It is known in literature that electric fields induce apoptosis in HL60 cells.22 However, with the used biochemical assay we were not able to compare the effect of the two inducers (TNF-α/CHX and electric field) because uncertainty remains in electric field mediated cell death.
In the near future impedance measurements will be performed to ensure that electric field mediated apoptosis has occurred. This will make it possible to compare the effects of different inducers on the apoptosic process. In addition, coupling a spectrometer to the microscope will allow quantitative measurements in fluorescent intensity from the different apoptotic stages of the cells in more detail.
Nowadays there are many assays present to detect cell death, however measuring apoptosis in a microfluidic cell trap device offers many advantages over the present conventional (flow cytometry) methods. Besides the benefits to measure apoptosis on a single cell level and in real time, it is now also possible to follow the intracellular changes within a cell. Conventional apoptotic methods use cell suspensions as a representation of the total cell culture (tissue), not knowing how the different cells react. However, in this device it is possible to investigate the reaction of one cell to a certain inducer and also investigate how cells react with each other in time. Further, fewer cells are needed, which is of special interest when primary cells (directly prepared from fresh tissue or fluids from an organism) are used.11 Moreover, this device offers possibilities to investigate dose-response relations within the same cell and between cells in real time. Thus, adapting the present conventional techniques to chip technology will offer many benefits and will obtain new insights into the apoptotic cascade.
Acknowledgements
We are grateful to Agrotechnology and Food Innovations, Wageningen University and Research Center as well as Technology Foundation STW, applied science division of NWO and the technology program of the Ministry of Economic Affairs for financial support of this project. We would like to acknowledge N. Demierre for the design of the device, J. W. van Nieuwkasteele for the realization of the chips, E. X. Vrouwe and R. E. Oosterbroek for helpful discussions.References
- I. Vermes and C. Haanen, Adv. Clin. Chem., 1994, 31, 177 Search PubMed.
- I. Vermes, C. Haanen and C. Reutelingsoerger, J. Immunol. Methods, 2000, 243, 167 CrossRef CAS.
- F. Wolbers, P. Buijtenhuijs, C. Haanen and I. Vermes, Apoptosis, 2004, 9, 385 Search PubMed.
- N. A. Thornberry and Y. Lazebnik, Science, 1998, 281, 1312 CrossRef CAS.
- M. O. Hengartner, Nature, 2000, 407, 770 CrossRef CAS.
- H. Andersson and A. van den Berg, Lab on a chips for Cellomics, Kluwer academic publishers, 2004 Search PubMed.
- H. Andersson and A. van den Berg, Sens. Actuators B, 2003, 92, 315 CrossRef.
- H. Andersson and A. van den Berg, Curr. Opin. Biotechnol., 2004, 15, 44 CrossRef CAS.
- H. Lu, L. Y. Koo, W. M. Wang, D. A. Lauffenburger, L. G. Griffith and K. F. Jensen, Anal. Chem., 2004, 76, 5257 CrossRef CAS.
- H. Lu, S. Gaudet, M. A. Schmidt and F. Jensen Klavs, Anal. Chem., 2004, 76, 5705 CrossRef CAS.
- A. Tixier-Mita, J. Jun, S. Ostrovidov, M. Chiral, M. Frenea, B. Le Pioflue and H. Fujita, Proceedings of MicroTotal Analysis System, 2004, 180 Search PubMed.
- S. A. Sundberg, Curr. Opin. Biotechnol., 2000, 11, 47 CrossRef CAS.
- N. J. Dovichi and D. Pinkel, Curr. Opin. Biotechnol., 2003, 14, 3 CrossRef CAS.
- S. D. Chan, G. luedke, M. Valer, C. Buhlmann and T. Preckel, Cytometry, 2003, 55A, 119 CrossRef CAS.
- E. Tamaki, K. Sato, M. Tokeshi, K. Sato, M. Aihara and T. Kitamori, Anal. Chem., 2002, 74, 1560 CrossRef CAS.
- K. Kleparnik and M. Horky, Electrophoresis, 2003, 24, 3778 CrossRef CAS.
- Y. Huang, N. S. Sekhon, J. Borninski, N. Chen and B. Rubinsky, Sens. Actuators, 2003, 105, 31 Search PubMed.
- S. Gawad, L. Schild and P. Renaud, Lab Chip, 2001, 1, 76 RSC.
- P. Smolewski, J. Grabarek, B. W. Lee, G. L. Johnson and Z. Darzynkiewicz, Cytometry, 2002, 47, 143 CrossRef CAS.
- J. C. Weaver, J. Cell Biochem., 2002, 51, 426.
- J. L. Rae and R. A. Levis, Eur. J. Physiol., 2002, 443, 664 Search PubMed.
- J. Piñero, M. Lopez-Baena, T. Ortiz and F. Cortes, Apoptosis, 1997, 2, 330 Search PubMed.
| This journal is © The Royal Society of Chemistry 2005 |