Old Masters' lead white pigments: investigations of paintings from the 16th to the 17th century using high precision lead isotope abundance ratios
G.
Fortunato
a,
A.
Ritter
a and
D.
Fabian
b
aSwiss Federal Laboratories for Materials Testing and Research (EMPA), Lerchenfeldstrasse 5, CH-9014 St. Gallen, Switzerland
bFabian & Samuels, Conservators of Fine Art, Grundstrasse 83, CH-8712 Stäfa, Switzerland
First published on 15th April 2005
Abstract
White lead (2PbCO3·Pb(OH)2), a common component in 17c. artists' painting materials, was singled out to investigate the potential of lead isotope abundance ratios in the field of authentication and origin assignment. Paintings by Peter Paul Rubens, Anthony van Dyck and other Old Masters of the Northern and Southern schools were chosen for this study. An interdisciplinary approach was chosen using both analytical instrumental methods, art technological and art historical knowledge. Minute samples taken from paintings from selected art collections worldwide were investigated using mass spectrometry, scanning electron microscopy (SEM) and energy-dispersive X-ray spectroscopy (EDX). The high precision lead isotope abundance ratios were measured by multiple collector inductively coupled plasma mass spectrometry (MC-ICP-MS). The determination of the calcium matrix influence with respect to possible bias effects to the isotope ratios gave clear decision support, to whether a result lies within the stated combined measurement uncertainty of the result, to eliminate time-consuming matrix separations. The scatter plots of the measured isotope abundance ratios for the painting pigments from P. P. Rubens, A. van Dyck and other Flemish painters exhibit a very narrow distribution forming a cluster. The range of the measured ratio 206Pb/204Pb amounts to 0.55% and for the ratio 207Pb/204Pb to 0.2%. The comparison of the data to cis-alpine (Italian) sample pigments from paintings from the same time period reveals a clear distinction between the two fields. With respect to the lead isotope data originating from the ores it is assumed that the pigment isotope ratio distribution can be explained by very distinct origin of raw materials. Presumably, no mixing of different lead ores from Europe took place. The comparison of the measured white lead isotope ratio values (Flemish paintings) and the data from ore samples led to the unexpected conclusion that local ores were not used for the pigment production but British or German sources.
1. Introduction
The pigment lead white, a basic lead carbonate, has been produced and used since ancient times as a main component in white paint. Its prominent characteristics are the excellent light fastness and its rapid drying capabilities when used in combination with an oil such as linseed or walnut oil. Because of its toxicity it had generally been replaced by zinc and titanium pigments in the 19th and 20th centuries, respectively.Natural lead consists of four isotopes, 204Pb, 206Pb, 207Pb and 208Pb. The last three isotopes derive partly from the radioactive decay of the nuclides of uranium (238U and 235U) and thorium (232Th). 204Pb, however, is not radiogenic and therefore its concentration is constant in time. The use of lead isotope ratios for authentication and provenance investigations depends on a two-fold coincidence: (i) Geologically, lead is one of the few chemical elements which varies markedly in its isotopic composition. The parameters on which the isotopic composition primarily depend are the age, the U/Pb and Th/Pb amount content ratios of the rock units from which fluids extracted lead to form ore deposits.1 (ii) Historically, lead was among the first metals extracted from ores by man, and because it is abundant in nature and relatively inexpensive, lead is found on a great many archaeological sites. The principle of the lead isotope ratio technique for the determination of the origin of the samples and the paintings, respectively, is the comparison of the data acquired from the analysis of lead white pigments and the geological lead ore samples.
Geochemical properties (trace element content, isotope abundance ratios) have been used as a tool to establish the provenance of artifacts.2–9 Relying on trace elements alone may have several drawbacks since an artifact is rarely made up of a chemically homogenous material. The chemical composition of a sample taken from an artifact can furthermore be influenced by the impurities due to the addition of fluxes in the smelting process or fractionation of main and trace elements during the cooling process.10 Constraints on the use of lead isotope data for provenancing are given by the potential blending of the raw products, which might originate from different sources. Furthermore, a full separation of the origin for lead isotope ratio ore field data is not given in any case, so an artifact can not be traced to one specific origin. Due to the variability of the isotope ratios of a given ore field a further contribution of uncertainty has to be considered.11 The lead isotope ratios are not noticeably altered by processing lead ores to refined products. This is a basic condition when using lead isotope abundance ratios for provenance studies, and therefore the comparability of results for different artifacts is guaranteed.
Lead white was produced since antiquity by placing thin lead shavings over a vessel of sourest vinegar, which distils on to and drops down from the lead. The portion of the latter which falls into the vinegar is dried, powdered and sifted. It is then moistened again with vinegar, made into tablets and dried in the summer sun.12 Little changed in the method of production over the centuries. Venice was the major center of production and had a reputation of producing the best quality of lead white, until by the eighteenth century the process was overtaken by the Dutch.13
The two major Flemish artists of the Northern Baroque era were chosen for this research. Peter Paul Rubens and Anthony van Dyck were equally well travelled artists working both sides of the Alps. Both had extended travels to Italy, Spain and England among other countries. Paintings which were created in Antwerp—one of the most important ports and art centres in Europe at that time—are compared to ones painted in Italy.
The goal of the described work is the set-up of a lead isotope ratio database for paintings from the 16th and the 17th centuries for use as a tool to help determine questions of authentication of works of art. Comparison of the results with the database should yield characteristics of lead white, its use as a pigment and its occurrence. With a growing database it will be possible to see characteristic differences in the pigment. Comparison with pigments of various origins will be made possible. Also, subsequent alterations to a work of art such as later retouchings or additions can be established and singled out due to the different nature of the pigment. In combination with geological lead isotope ratio data from ore fields the question of a proper provenance assignment of lead white as a pigment is examined. Furthermore, historical sources are used to substantiate the presented results yielding an excellent tool to study the use, the production and trade issues of the pigment lead white during that time. This work affiliates to provenance studies from archaeological investigations.
2. Materials and methods
2.1 Sampling, sample preparation
Microgram quantities of pigment (50–200 µg) were sampled from the paintings using a scalpel. In some cases the sampling was done under a stereo light microscope. Samples were mostly taken from the edges of paintings or from highlights where small damages already existed.After determination of the sample weight the morphology, the inorganic matrix and the build-up structure, 4 mL of a 1 : 1 diluted sub-boiled nitric acid (67% HNO3, puriss. pa, Fluka, CH) was used to perform the decomposition. The samples and solutions were kept under clean room conditions (class 100) during manipulation to avoid any contamination.
For the lead isotope abundance ratio determinations the samples were diluted using sub-boiled 2% nitric acid (puriss. pa, Fluka, CH) achieving a lead amount content of approximately 200 µg kg−1.
2.2 Chemical analysis
All weighing operations were performed in a class E2 environment (according to the “Organisation Internationale de Metrologie Legale” OIML) with stabilised air temperature and relative air humidity as well as monitored air pressure. All weighing was carried out on a micro-analytical balance (UMT5 Mettler-Toledo, Greifensee, Switzerland). The balance was regularly checked by the use of class E2 reference weights traced back to the Swiss National Metrology References.Scanning electron microscope (SEM) images were performed by an Amray ECO-SEM 3200 C (Amray, USA) using a BSE detector (back scattering electrons) operating in a low pressure vacuum mode (150 mTorr) and 20 keV accelerating voltage.
The X-ray spectrum acquisition for elemental analysis was performed at 20 keV by an EDX Oxford LINK ISIS 300 (Oxford Instruments, England). The spectra were acquired in a single mode and in a 2D mode (element mapping).
All measurements of the different isotope abundance ratios were performed using the VG AXIOM MC-ICP-MS (Thermo-Elemental, Winsford, Cheshire, England). The instrument was operated in an air temperature (17 °C, ±1 °C) stabilised clean hood (class 100) laboratory. Before the high precision isotope amount ratio measurements were started, the instrument was stabilised for about 1.5 h under normal working conditions until the temperature sensor within the mass spectrometer indicated constant values of ±0.2 °C. The air temperature in the room was monitored during the measurements to detect any unacceptable deviation from the target value of 17 °C ±1 °C. The relatively low temperature allows slightly better vacuum conditions in the detector and therefore improves sensitivity of the detection. The MC-ICP-MS operating conditions are presented in Table 1. No dead time correction was necessary as a linear response was due to the Faraday cup detectors. The mass 202Hg was monitored during the measurements to correct for isotopic interference on mass 204Pb. However, this influence was negligible.
| RF-power | 1250 W | ||
| Plasma gas flow | 14.0 L min−1 Ar | ||
| Auxiliary gas flow | 0.58 L min−1 Ar | ||
| Nebulizer gas flow | 1.0 L min−1 Ar | ||
| Sampling cone material | Pt | ||
| Mass resolving power (10% valley) m/Δm | 410 | ||
| Dwell time | 50 ms | ||
| Points per replicate | 40 | ||
| Mass assignment to | Hg | 202 | L4 |
| Faraday cup detectors | Tl | 203 | L2 |
| Pb | 204 | L1 | |
| Tl | 205 | Ax | |
| Pb | 206 | H1 | |
| Pb | 207 | H2 | |
| Pb | 208 | H3 | |
| Aerosol drying unit | CETAC Aridus | ||
| Nebulizer type | TH1 concentric | ||
| Typical sample uptake rate | 100 μL min−1 | ||
| Air temperature in clean hood for instrument | (17 ± 1) °C | ||
The solutions to be analysed were taken up by free aspiration using a TH1 nebuliser (CETAC, Omaha, USA). The sample uptake rate of the nebuliser was about 100 µL min−1. The wet aerosol was dried by an Aridus (CETAC, Omaha, USA) aerosol desolvating system using approximately 3 L min−1 argon and 20 mL min−1 nitrogen (temperature 160 °C). The system was cleaned for 2 min before every run by aspirating a 2% HNO3 solution. The dry aerosol was fed to the torch assembly kept at a voltage of 5000 V. A gain calibration of the multiple collector system was performed once a week. Faraday cup multiple collector detector positions were optimised while a mixture of 200 µg kg−1 Pb (SRM 981, NIST) and 50 µg kg−1 Tl (SRM 997, NIST) was introduced. Day-to-day variations of the relative multiple collector detector positions were in the order of 0.1 mm at maximum.
Isotope abundance ratios of Pb in the digested white lead samples were determined using a standard–sample–standard method: a mixture of 200 µg kg−1 Pb (SRM 981) and 50 µg kg−1 Tl (SRM 997)—mixture of sample No1 and 50 µg kg−1 Tl (SRM 997)—mixture of sample No1 and 50 µg kg−1 Tl (SRM 997)–200 µg kg−1 Pb (SRM 981) and 50 µg kg−1 Tl (SRM 997)—mixture of sample No2 and 50 µg kg−1 Tl (SRM 997)–200 µg kg−1 Pb (SRM 981) and 50 µg kg−1 Tl (SRM 997). The SRM 997 thallium isotopic standard was added volumetrically to the samples. Between each measurement the wash sequence with 2% HNO3 solution lasted for 2 min.
The mass discrimination correction was performed using the values of natural thallium (internal calibration) and an exponential model equation14, giving overlap of the corrected isotope abundance ratio value for the SRM 981 (NIST, USA) certificate and published values.15–20
3. Results
The EDX determinations reveal for most of the samples lead as the main inorganic component, emphasizing the exclusive use of white lead as a white pigment during the 16th and 17th centuries, as would be expected (Fig. 1). Calcium is also regularly found, and in some samples traces of silicon, tin, barium and iron could be identified (Table 2). Calcium carbonate is a main ingredient of Northern ground layers which would explain the frequency of its appearance. Southern grounds are typically made of gypsum (calcium sulfate). There is also some reference to lead white pigments being adulterated with calcium carbonate to cut cost.13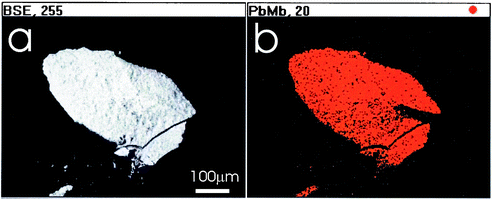 | ||
| Fig. 1 SEM (a) and EDX (b) micrographs for a typical lead white sample (Pb Mβ-emission is displayed, besides carbon and oxygen no other elements are detected). | ||
| Artist, name of painting | Source | Acronym | Date | Main inorganic component | |
|---|---|---|---|---|---|
| a Exact date not known | |||||
| P. P. Rubens | The Consecration of Decius Mus | Collections of the Prince of Liechtenstein (FL) | R1 | 1617 | Pb |
| The Conversion of St Paul | Collections of the Prince of Liechtenstein (FL) | R3 | 1602 (?) | Pb | |
| The Finding of the Infant Erichtonius | Collections of the Prince of Liechtenstein (FL) | R4 | 1615 | Pb | |
| The Assumption of the Virgin | Collections of the Prince of Liechtenstein (FL) | G80 | 1635 | Pb, Ca | |
| Clara Serena | Collections of the Prince of Liechtenstein (FL) | G105 | 1616 | Pb, Na | |
| Descent from the Cross | Institut Royal du Patrimoine Artistigue (Be) | IRPA 2 | 1612–4 | Pb | |
| Purgatory | Institut Royal du Patrimoine Artistigue (Be) | IRPA 3 | ?a | Pb | |
| Descent from the Cross | Institut Royal du Patrimoine Artistigue (Be) | IRPA 6 | ? | Pb | |
| Descent from the Cross | Institut Royal du Patrimoine Artistigue (Be) | IRPA 7 | ? | Pb | |
| Golghota | Institut Royal du Patrimoine Artistigue (Be) | IRPA 10 | ? | Pb | |
| Resurrection of Christ | Institut Royal du Patrimoine Artistigue (Be) | IRPA 14 | ? | Pb | |
| Resurrection of Christ | Institut Royal du Patrimoine Artistigue (Be) | IRPA 15 | ? | Pb, Ca, Fe | |
| Resurrection of Christ | Institut Royal du Patrimoine Artistigue (Be) | IRPA 16 | ? | Pb | |
| St Augustin | Gallery Stucker (CH) | 160/1 | 1620 | Pb | |
| Three Angels Playing Musical Instruments | Collections of the Prince of Liechtenstein (FL) | G 136 | ? | Ca, Pb | |
| The Virgin Adorned with Flowers | Collections of the Prince of Liechtenstein (FL) | G 116_1 | 1609–10 | Ca, Pb | |
| The Lamentation | Collections of the Prince of Liechtenstein (FL) | G 62_1 | ? | Pb, Ca | |
| The Lamentation | Collections of the Prince of Liechtenstein (FL) | G 62_2 | ? | Ca, Pb, Si | |
| Portrait of Helena Fourment | Mauritshuis (NL) | MH0251-42 | ? | Pb | |
| Peace and War | National Gallery (GB) | NG 46 | 1629/30 | Pb | |
| Adoration | National Gallery (GB) | A 126 3009/1 | ? | Pb | |
| Adoration | National Gallery (GB) | A 126 3009/2 | ? | Pb | |
| A. v. Dyck | Portrait of an Young Man | Collections of the Prince of Liechtenstein (FL) | G 66 | 1620 | Ba, Zn, Ca, Fe, |
| Maria Theresias de Tassis | Collections of the Prince of Liechtenstein (FL) | G58 | 1629 | Pb, Ca, Si | |
| Portrait of an Elderly Man | Collections of the Prince of Liechtenstein (FL) | G 95_1 | 1618 | Pb, Ca, Sn, Si, Fe | |
| Portrait of an Elderly Man | Collections of the Prince of Liechtenstein (FL) | G 95_2 | ? | Pb, Si, Ca, Sn, Br | |
| Portrait of an Young Woman | Collections of the Prince of Liechtenstein (FL) | G 68_1 | 1620 | Pb, Ca, Sn | |
| Portrait of an Young Woman | Collections of the Prince of Liechtenstein (FL) | G63 | ? | Ca, Pb | |
| The Balbi Children | National Gallery (GB) | NG 6502 | 1625 | Pb | |
| Golgotha | Institut Royal du Patrimoine Artistigue (Be) | IRPA 9 | 1630 | Pb | |
| Rembrandt | Susanna and the Elders | Mauritshuis (NL) | 147-2D | ? | Pb |
| Susanna and the Elders | Mauritshuis (NL) | 147-2E | ? | Pb | |
| Minerva in her Study | Mauritshuis (NL) | 626-G | ? | Pb | |
| Minerva in her Study | Mauritshuis (NL) | 626-G2 | ? | Pb | |
| Still Life With Bittern and Girl | Mauritshuis (NL) | B164/1 | ? | Pb | |
| J. P. Breughel | The Element Air | Gallery Koller (CH) | K3015/2 | ? | Pb, Si, Ca |
| The Sermon of Johannes | Gallery Koller (CH) | 3010/1 | ? | Pb | |
| Allegory of War | Gallery Koller (CH) | 3031 | ? | Pb | |
| A. Brueghel | Still Life | Art Museum Zurich (CH) | 1631_97 | 1675 | Pb |
The lead isotope abundance ratio values measured for the pigments from P. P. Rubens and A. van Dyck exhibit precisions (2s) for 206Pb/204Pb, 207Pb/204Pb and 208Pb/204Pb in the range of 0.01–0.05% (Table 3). Exceptions can be found for the IRPA samples (Institut Royal du Patrimoine Artistique IRPA, Brussels), where partially only low lead amount contents were present in the samples. The precisions of the lead isotope abundance ratios for the in-between measured reference solutions (SRM 981) lie in the same ranges as for the samples. The precision and accuracy of the lead isotope abundance ratios for the certified reference material SRM 981 have been compared to published literature values (Table 4), giving overlap of the measurement uncertainties involved. The stability of the measurement values acquired over a one year period lies within a range of about 100 to 400 ppm, depending on the lead isotope ratio. This matter of fact allows it to obtain small measurement uncertainties for the lead isotope ratios, enabling the interpretation of small variations of values.
| Acronym | Isotopic-index20 | Mean | RSD (1s) | Mean | RSD (1s) | Mean | RSD (1s) |
|---|---|---|---|---|---|---|---|
| 208Pb/204Pb | 206Pb/204Pb | 207Pb/204Pb | |||||
| % | % | % | |||||
| R1 | 18.30 | 38.425 | 0.01 | 18.460 | 0.01 | 15.635 | 0.01 |
| R3 | 18.30 | 38.431 | 0.01 | 18.466 | 0.01 | 15.634 | 0.01 |
| R4 | 18.30 | 38.425 | 0.01 | 18.461 | 0.01 | 15.634 | 0.01 |
| G80 | 18.30 | 38.423 | 0.02 | 18.462 | 0.01 | 15.633 | 0.01 |
| G105 | 18.30 | 38.417 | 0.01 | 18.458 | 0.01 | 15.633 | 0.01 |
| IRPA 2 | 18.31 | 38.417 | 0.02 | 18.463 | 0.02 | 15.626 | 0.02 |
| IRPA 3 | 18.31 | 38.418 | 0.01 | 18.461 | 0.01 | 15.630 | 0.01 |
| IRPA 6 | 18.33 | 38.407 | 0.01 | 18.469 | 0.01 | 15.630 | 0.08 |
| IRPA 7 | 18.28 | 38.399 | 0.03 | 18.430 | 0.03 | 15.620 | 0.03 |
| IRPA 10 | 18.31 | 38.410 | 0.01 | 18.460 | 0.01 | 15.629 | 0.05 |
| IRPA 14 | 18.32 | 38.406 | 0.01 | 18.462 | 0.01 | 15.628 | 0.04 |
| IRPA 15 | 18.31 | 38.416 | 0.06 | 18.460 | 0.06 | 15.631 | 0.06 |
| IRPA 16 | 18.31 | 38.427 | 0.01 | 18.581 | 0.03 | 15.720 | 0.14 |
| 160/1 | 18.29 | 38.411 | 0.01 | 18.444 | 0.001 | 15.627 | 0.001 |
| G 136 | 18.18 | 38.372 | 0.03 | 18.352 | 0.03 | 15.618 | 0.03 |
| G 116_1 | 18.30 | 38.427 | 0.01 | 18.464 | 0.01 | 15.633 | 0.01 |
| G 62_1 | 18.26 | 38.381 | 0.01 | 18.418 | 0.01 | 15.628 | 0.01 |
| G 62_2 | 18.29 | 38.429 | 0.01 | 18.453 | 0.01 | 15.631 | 0.01 |
| MH0251-42 | 18.29 | 38.411 | 0.01 | 18.442 | 0.01 | 15.624 | 0.01 |
| NG 46 | 18.30 | 38.416 | 0.01 | 18.458 | 0.02 | 15.631 | 0.01 |
| A 126 3009/1 | 18.31 | 38.400 | 0.001 | 18.453 | 0.001 | 15.626 | 0.001 |
| A 126 3009/2 | 18.31 | 38.390 | 0.01 | 18.451 | 0.01 | 15.625 | 0.01 |
| G 66 | 18.23 | 38.284 | 0.02 | 18.347 | 0.02 | 15.582 | 0.04 |
| G58 | 18.30 | 38.425 | 0.02 | 18.465 | 0.02 | 15.632 | 0.02 |
| G 95_1 | 18.30 | 38.420 | 0.01 | 18.459 | 0.01 | 15.631 | 0.01 |
| G 95_2 | 18.30 | 38.418 | 0.01 | 18.460 | 0.01 | 15.630 | 0.01 |
| G 68_1 | 18.30 | 38.428 | 0.01 | 18.462 | 0.01 | 15.634 | 0.01 |
| G63 | 18.31 | 38.419 | 0.01 | 18.468 | 0.01 | 15.630 | 0.01 |
| NG 6502 | 18.31 | 38.416 | 0.01 | 18.463 | 0.01 | 15.629 | 0.01 |
| IRPA 9 | 18.30 | 38.423 | 0.02 | 18.460 | 0.02 | 15.628 | 0.02 |
| 147-2D | 18.32 | 38.434 | 0.01 | 18.475 | 0.01 | 15.637 | 0.01 |
| 147-2E | 18.29 | 38.407 | 0.01 | 18.444 | 0.01 | 15.623 | 0.01 |
| 626-G | 18.45 | 37.279 | 0.02 | 17.479 | 0.02 | 15.568 | 0.02 |
| 626-G2 | 18.31 | 38.427 | 0.01 | 18.464 | 0.01 | 15.633 | 0.01 |
| B164/1 | 18.29 | 38.405 | 0.01 | 18.475 | 0.01 | 15.626 | 0.01 |
| K3015/2 | 18.30 | 38.454 | 0.01 | 18.461 | 0.01 | 15.624 | 0.01 |
| 1631-97 | 18.20 | 38.495 | 0.01 | 18.421 | 0.01 | 15.657 | 0.01 |
| 3010/1 | 18.31 | 38.396 | 0.02 | 18.454 | 0.02 | 15.622 | 0.02 |
| 3031 | 18.30 | 38.402 | 0.003 | 18.447 | 0.001 | 15.621 | 0.001 |
The effects of co-dissolved elements such as Ca as the main admixture to the lead white pigments was investigated using synthetic mixed Ca and Pb solutions in different content ratios. Its influence towards the lead isotope abundance ratios reveals a maximum dissolved Ca content of 1 mg kg−1 with respect to 200 µg kg−1 Pb so as to guarantee no or only small bias effects when using exponential law correction of the raw isotope ratio results (Fig. 2). This restriction enables the circumvention of the time and cost consuming chemical separation of the matrix from the lead ions. For higher Ca content a changing mass discrimination behavior of the ions in the Ar plasma has to be considered. The comparison of the Ca influence for 206Pb/204Pb and 207Pb/206Pb reveals a more distinct influence to the latter isotope abundance ratio. Hence, the bias effect is superposed for the isotope ratio 206Pb/204Pb due to the relatively low count rates on mass 204Pb causing worse precisions and thus higher measurement uncertainty for the isotope ratio discussed.
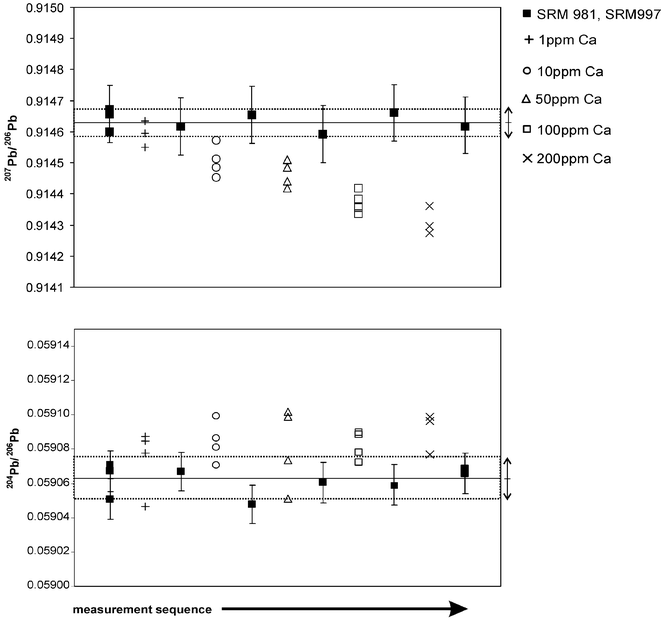 | ||
| Fig. 2 Influence of Ca admixture to 200 µg kg−1 Pb with respect to the isotope abundance ratio results, bars denotes the combined standard measurement uncertainty (coverage factor k = 2), the arrows indicate the mean isotope ratio values for the matrix free references including its standard deviation (based on 2s). | ||
The measurement uncertainties deduced from the repeatability of independently measured lead isotope ratios, the precision of the Tl isotope abundance ratios and the blank values reveals a strong influence from the first factor.21 The influencing factor from the certified Tl isotope reference certificate has not been incorporated. A typical contribution from the repeatability to the combined measurement uncertainty is found in the range of 90%. The relative values for the combined measurement uncertainties amounts to 207Pb/206Pb to 0.02%, for 206Pb/204Pb to 0.03% (coverage factor k = 2). To fulfil the requirements of ISO 17025 (e.g., stated measurement uncertainties, no bias effect or use of corrected results) only samples with Ca/Pb content ratios lower than 5 have been accounted for in this study. The decision making process for fulfilment of the above mentioned necessity was performed using the EDX data.
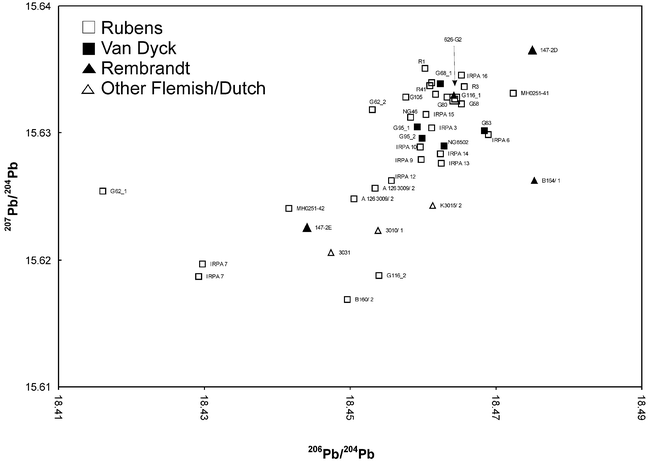
The range of the measured lead isotope abundance values for the “Antwerp” pigments (Flemish and Dutch paintings) lies, compared to modern white lead values, in a narrow field forming a cluster ranging from 18.4–18.5 for the isotope abundance ratio 206Pb/204Pb and from 15.61–15.64 for the isotope abundance ratio 207Pb/204Pb (Fig. 3). The pigments used by van Dyck and Rubens are very similar indeed.
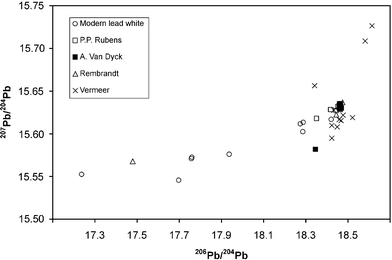 | ||
| Fig. 3 Lead isotope abundance ratio values for different white lead pigments (the isotopic values from Vermeer's paintings are from Keisch et al.23). | ||
The comparison of the “Flemish” and “Dutch” isotope ratios with values from proved Italian paintings gives a clear distinction of the lead isotope ratio areas and thus the provenance (Fig. 4). The values for the paintings from e.g., L. Giordano, A. Allori, D. Tintoretto, E. Procaccino, G. B. Caracciolo and other well known Italian artists working in the same time period are located in a close range. Two distinct areas can be distinguished.
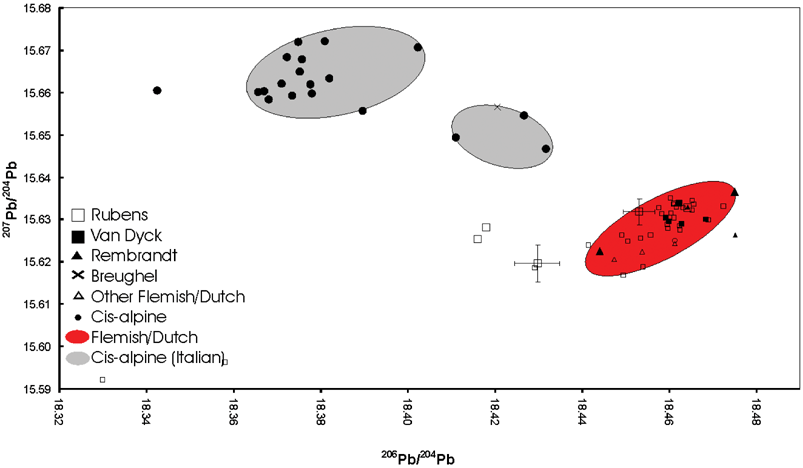 | ||
| Fig. 4 Lead isotope abundance ratio values for cis- and trans-alpine samples, bars denote typical combined measurement uncertainties (coverage factor k = 2). | ||
 | ||
| Fig. 5 Lead isotope abundance ratio values for “Flemish/Dutch” pigment samples. | ||
In the case of the samples from Rembrandt (626-G2) a value from one sampling site of the painting lies within the values found for P. P. Rubens and A. van Dyck, for another sample from a different sampling site (626-G) a value from a modern lead white is found. The latter originates from a location which could be identified as proved overpaint from a later intervention of Rembrandt's painting. Other exceptions affect samples from the paintings by A. van Dyck “Portrait of a Young Man” (G66) where the main inorganic elements found are barium, zinc and calcium indicating a modern lead white. Hence the sample originates also from a later intervention. The prominent outlier for the sample from P. P. Rubens “Three Angels Playing Musical Instruments” (G136) can be attributed to the low lead amount content revealed by the EDX measurements. This presumes that the lead isotope ratios measured are not from pure lead or from lead white but from lead traces within the calcium carbonate. For P. P. Rubens “Lamentation” (G62) no clear answer regarding the difference of the isotope abundance ratios towards the “cluster forming” values can be given as yet, but the white lead is apparently originating from a different source. As the database grows more answers will be found.
“The Conversion of Saint Paul” (R3) had been attributed to Otto van Veen, Rubens' teacher, until Müller Hofstede attributed it to Rubens in 1964.22 The composition is based on a print by Enea Vico of 1545 executed after a Conversion of S. Paolo by Salviati, a larger work measuring (86 × 147 cm) which is in the Palazzo Doria in Rome. Müller Hofstede dates the painting to Rubens' stylistic phase just before his journey to Spain in about 1602. The picture was possibly sent from Mantua or Rome to Antwerp.22
However, when looking at the results from samples taken from the “Conversion”, correlation to lead white found in paintings by Rubens and van Dyck from the Antwerp period, can be seen. Excluding the possibility that the painting was executed with Italian lead white, intriguing questions arise. Was it possibly done earlier, i.e. before Rubens' voyage to Italy (1600–1608)? Or is it possible that the artist brought along his own pigments? Or thirdly, assuming Müller Hofstede's dates are correct and the painting was painted in Italy, could the materials Rubens bought in Italy have come from the North? In this case we have another clue: the panel was painted on oak, a wood type used preferably by Northerners (Italian painters used mainly poplar or lime). Of course, since the panel measures 72.2 × 103 cm it would not have been too large to bring it along from Antwerp as well.
The values presented agree with the lead isotope ratios measured for paintings by the Dutch artist Johannes Vermeer.23 In contrast to our investigated pigment samples from P. P. Rubens paintings, however a wider distribution behavior is shown. The compared isotope abundance ratio values were measured by Thermal Ionisation Mass Spectrometer (TIMS) using single collector ion detection. Therefore, we suggest that the lower precision of these time-dependent measurements led to the wider distribution of the lead isotope ratio values for Vermeer's pigments. Keisch et al.23 introduced a so called “Lead Isotope Ratio Index LIRI” in order to obtain a better visualization and clustering of the isotope abundance ratios. The “lead isotope ratio index” can be calculated using the values from the three ratios 206Pb/204Pb, 207Pb/206Pb and 208Pb/206Pb according the empirical equation:
| LIRI = 35.385 + 0.4729 · (206Pb/204Pb) − 0.5519 · (206Pb/204Pb) · (207Pb/206Pb) − 8.2561 · (208Pb/206Pb) |
The calculated indices give a practical first hint whether a sample value lies within a specific cluster of isotope ratios or not (Table 3). Furthermore it allows a more practical presentation of isotopic values against time. The comparison of the indices from the Vermeer's and the Rubens/van Dyck paintings gives overlap of the lead isotope ratio indices within a range of ±0.1 for a large number of pigments. Nevertheless, when compiling lead ore data with the values measured in different kinds of objects, only true measured ratios should be used as a direct comparison becomes possible. The necessity of comparison of measured values, to obtain a provenance argument, leads to another important analytical issue: the traceability. It is of eminent importance, that the measured values at least are traced back to a certified or agreed reference material. Unfortunately, this is not given in any case.
The distribution of lead isotope ratio values for lead ores, the starting material for the lead white production, originating from the northern (Britain, Wales, Ireland, Scotland), the middle and some of the southern parts of Europe (Belgium, Germany, Poland, Alps, Tuscany, Sardinia) reveals a complicated pattern of distributions (Fig. 6).24–32 Some of the mining areas can be divided quite clearly, others such as the lead ore values from Britain and the Harz area have an overlap and cannot be separated using lead isotope ratios only. Maximum known isotope ratio distributions for an ore field can exceed the range of ±0.1%. As long as only some data concerning the distribution and its function are known, one has to be aware of possible overlaps due to the facts described.33,34 Therefore, lead isotope ratio data can only be used as an indication of origin and not as full proof in many cases.
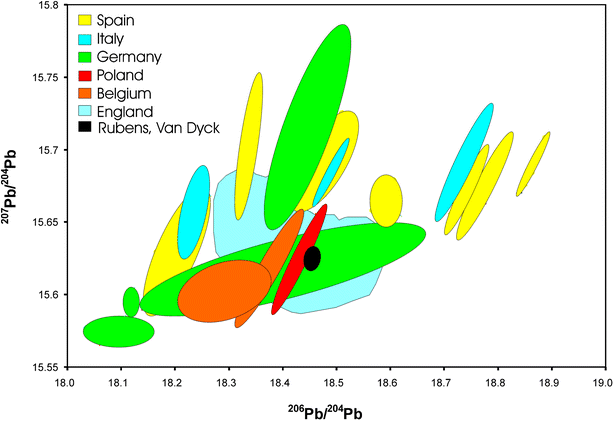 | ||
| Fig. 6 Lead isotope abundance ratio values for lead ores from Europe, including values from lead white pigments | ||
The combination of lead ore and pigment isotope ratio data gives an indication of lead origin from the German (Harz mountains) or from British (e.g., Nidderdale, Derbyshire, etc.) mines. Both of the areas are known to have been exploited since ancient times35–37 and an overlap of the data from pigment (cluster forming paintings) and lead ores is visible (Fig. 6). Jan Pieter Brueghel's “Element of Water” (K3015/2) is outside or at the borderline of the cluster as well as Rembrandt's “Susanna” of 1636 (147-2D, 147-2E). Although Brueghel (1628– after 1662) was Flemish he also worked in Italy, as did many of his compatriots. The Dutch artist Rembrandt van Rijn, on the other hand, never travelled to the South. This raises the interesting combination of possibilities: Dutch artists working in the Netherlands; Flemish artists working in Italy, etc. Our results have already produced remarkably consistent patterns, indicating a need for further investigation.
Analysis of the first block of data gained from Rubens and van Dyck paintings dating from the Antwerp periods show results that lie within close parameters. Surprisingly, these results do not overlap with the hitherto published lead isotope ratio data taken from ores originating from Flemish lead mines. The analysis rather suggests the use of English or German ores to manufacture the lead white pigment. It is not quite clear yet why for the production of the white pigment heavy and costly ores or lead ingots were imported or if the pigment itself was imported. The revolt of the Netherlands (1568–1648) could have had an influence of the trade and distribution of the pigment. The Pacification of Ghent of 1576 was a treaty unifying all the provinces without regard of religious or national differences with the aim to drive out the Spaniards. In the Union of Utrecht and the Proclamation of Independence (from Spain) of 1581, the capture of Antwerp in the year 1584 and the defeat of Phillip II Great Armada by the English show the very complex history of Antwerp. The Twelve Year's Truce of 1609 established again its factual independence and the Treaty of Westphalia of 1648 reorganized the independence of the Area.38 How the victory of the English influenced the trade between the two areas is under current investigation of the project, of which the analytical side has already given some interesting results.
4. Conclusions
The lead isotope ratio results hitherto have produced clusters of relevant data for both P. P. Rubens, A. van Dyck and other Flemish artists. These clusters coincide with the documented evidence. Paintings that have been attributed to the Antwerp period for both artists exhibit similar lead isotope ratio results.Data outside the clusters can be possibly attributed to samples originating from other geographic areas such as Italy (Jan Pieter Brueghel). If a later date of the painting yields a reading outside the cluster (Brueghel) it has to be further investigated.
Lead isotope ratio data from ores originating from known mining areas may be suitable to distinguish amongst the provenance of samples from different regions. Due to overlaps of the lead isotope data (Harz, Britain) further components such as trace element contents, the isotopic composition of other selected elements and if available historical written sources have to be added to get a better separation of the values and a clearer provenance statement. Using lead isotope abundance data a tool for authentication issues and the determination of the history of the works of art (overpaints) can be helpful for the interpretation. Different parameters may influence the results and have to be introduced for the provenance assessment: Measurement uncertainties of lead isotope ratios, bias effects of published data due to the absence of traceable values and the variations of the lead isotope ratios from a specific ore field.
We have shown that the method of using lead isotope abundance ratio data for the authentication of a work of art in combination with its history can be a powerful tool to help interpretation in the works historical context. The results to date show great promise. Accuracy, however, depends amongst other parameters on a vast database consisting of samples taken from many paintings. We have shown that the method is workable. It is now important to build up a white lead database and to further examine the lead ore isotope ratio values in a more detailed way.
Acknowledgements
We would like to thank the following people and institutions for their help and support: HSH Prince Hans Adam II von und zu Liechtenstein, Vaduz; Ruth Weiss-Klebel, Conservator, Bregenz, Jørgen Wadum, Chief Conservator and Petria Noble Senior Paintings Conservator Royal Cabinet of Paintings Mauritshuis, The Hague; Jana Sanyova, Insitute Royal du Patrimoin Artistique (IRPA), Brussels; Dr Lucas Gloor, Director of the Bührle Collection, Zurich; Paul Pfister, Paintings Conservator, Kunsthaus Zurich; Stephan Gratwohl, Director, Galerie Stuker, Zurich; Cyril Koller, Head of Department, Galerie Koller, Zurich; Joan Samuels Paintings Conservator, Stäfa Karin Rank, Head of the Geowissenschaftliche Sammlung, TU Bergakademie Freiberg; Dr Ronny Roessler, Director, Natural History Museum, Chemnitz; Dr Samuel Wunderli, EMPA, St Gallen.The Swiss National Science Foundation for providing research funds.
References
-
G. Faure, Principles of Isotope Geology, 2nd edn., Wiley, New York, 1986 Search PubMed
.
-
N. H. Gale and Z. A. Stos-Gale, in Modern Analytical Methods in Art and Archeometry, ed. E. Ciliberto and G. Spoto, John Wiley & Sons, Chichester, 2000, vol. 155, p. 503 Search PubMed
- K. Wedepohl and A. Baumann, Mineralium Deposita, 1997, 32, 292 Search PubMed
- K. J. R. Rosman, W. Chisholm, S. Hong, J. P. Candelone and C. F. Boutron, Environ. Sci. Technol., 1997, 31, 3413 CrossRef CAS
- G. De Wannemacker, F. Vanhaecke, L. Moens, A. Van Mele and H. Thoen, J. Anal. At. Spectrom., 2000, 15, 323 RSC
- I. De Readt, K. Janssens, J. Veeckman, L. Vincze, B. Vekemans and T. E. Jeffries, J. Anal. At. Spectrom., 2001, 16, 1012 RSC
- E. Niederschlag, E. Pernicka, T. Seifert and M. Bartelheim, Archaeometry, 2003, 45, 61 CrossRef CAS
- S. A. Junk and E. Pernicka, Archaeometry, 2003, 45, 313 CrossRef CAS
- G. Fortunato, K. Mumic, S. Wunderli, L. Pillonel, J. O. Bosset and G. Gremaud, J. Anal. At. Spectrom., 2004, 19, 227 RSC
- W. Snoek, I. R. Plimer and S. Reeves, J. Geochem. Expl., 1999, 66, 421 Search PubMed
-
B. L. Gulson, Lead Isotopes in Mineral Exploration, Elsevier, Amsterdam, 1986 Search PubMed
- R. M. Clay, Country Life, 1950, 23, 1903 Search PubMed
-
D. J. Rowe, Lead Manufacturing in Britain, Croom Helm, London, 1983 Search PubMed
-
I. T. Platzner, K. Habfast, A. J. Waldner and A. Goetz, Modern Isotope Ratio Measurement, John Wiley & Sons, Chichester, 1997 Search PubMed
- E. J. Catanzaro, T. J. Murphy, W. R. Shields and E. L. Garner, J. Res., 1968, 72A, 261 Search PubMed
- T. Hirata, Analyst, 1996, 121, 1407 RSC
- I. Platzner, S. Ehrlich and L. Halicz, Fresenius’ J. Anal. Chem., 2001, 370, 624 CrossRef CAS
- M. Rehkämper and A. N. Halliday, Int. J. Mass Spectrom., 1998, 181, 123 CrossRef CAS
- M. F. Thirlwall, Chem. Geol., 2002, 184, 255 CrossRef CAS
-
W. Todt, R. A. Cliff, A. Hanser and A. W. Hoffmann, in Earth Processes: Reading the Isotopic Code, Geophysical Monograph, ed. A. R. Basu and S. R. Hart, American Geophysical Union, Washington, D. C., 1996, vol. 95, p. 429 Search PubMed
- G. Fortunato and S. Wunderli, Anal. Bioanal. Chem., 2003, 377, 111 CrossRef CAS
- J. Müller Hofstede, Burlington Mag., 1964, 95 Search PubMed
- B. Keisch and R. C. Callahan, Archaeometry, 1976, 2, 181 CrossRef
- R. Haggerty, B. M. Rohl, P. D. Budd and N. H. Gale, Geol. Mag., 1996, 133, 611 CrossRef CAS
- M. Niggli, Eidg. Tech. Hochschule (Zürich), 1988 Search PubMed
- B. M. Rohl, Archaeomtery, 1996, 38, 165 Search PubMed
- D. Large and R. Schaeffer, Mineralium Deposita, 1983, 18, 235 Search PubMed
- L. Dejonghe, Ore Geol. Rev., 1998, 12, 329 CrossRef
- R. Gottschalk and A. Baumann, Eur. J. Mineral., 2001, 13, 197 CrossRef CAS
- Z. Stos-Gale, N.
H. Gale, J. Houghton and R. Speakman, Archaeometry, 1995, 37, 407 CrossRef CAS
- K. R. Ludwig, R. Vollmer, B. Turi, K. R. Simmons and G. Perna, Eur. J. Mineral., 1989, 1, 657 CAS
- M. Boni and V. Koeppel, Mineralium Deposita, 1985, 20, 185–193 Search PubMed
- M. J. Baxter, J. Archeol. Sci., 1999, 26, 117 Search PubMed
- C. L. Reedy and T. J. Reedy, Mater. Res. Soc. Symp. Proc., 1988, 123, 65 CAS
-
A. Jockenhovel, in Vierteljahrschrift für Sozial- und Wirtschaftgeschichte, ed. H. Pohl, , R. Gömmel, F. W. Henning, K. H. Kaufhold, F. Schönert-Röhlk, and W. Zorn, Franz Steiner Verlag, Stuttgart, 1996, vol. 121 Search PubMed
-
R. Shepherd, Ancient Mining, Elsevier Applied Science, London, 1993 Search PubMed
-
I. Blanchard, in Zeitschrift für Unternehmensgeschichte, ed. H. Pohl, Franz Steiner Verlag, Stuttgart, 1995, vol. 85 Search PubMed
-
W. H. Hanger, in An Encyclopedia of World History, Harrap/Gallery Press, London, 1978 Search PubMed
| This journal is © The Royal Society of Chemistry 2005 |