DOI:
10.1039/B416831C
(Paper)
Analyst, 2005,
130, 831-837
Voltammetric detection of cadmium ions at glutathione-modified gold electrodes
Received 5th November 2004, Accepted 18th March 2005
First published on 11th April 2005
Abstract
An electrochemical sensor for the detection of cadmium ions is described using immobilized glutathione as a selective ligand. First, a self-assembled monolayer of 3-mercaptopropionic acid (MPA) was formed on a gold electrode. The carboxyl terminus then allowed attachment of glutathione (GSH)
via carbodiimide coupling to give the MPA–GSH modified electrode. A cadmium ion forms a complex with glutathione via the free sulfhydryl group and also to the carboxyl groups. The complexed ion is reduced by linear and Osteryoung square wave voltammetry with a detection limit of 5 nM. The effect of the kinetics of accumulation of cadmium on the measured current was investigated and modeled. Increasing the temperature of accumulation and electrochemical analysis caused an increase in the voltammetric peak of approximately 4% per °C around room temperature. The modified electrode could be regenerated, being stable for more than 16 repeated uses and more than two weeks if used once a day. Some interference from Pb2+ and Cu2+ was observed but the effects of Zn2+, Ni2+, Cr3+ and Ba2+ were insignificant.
Introduction
The presence of heavy metals in the environment is of worldwide concern because of their toxicity to organisms. Cadmium is one of these toxic pollutants, arising from industrial wastes, phosphate fertilizers, smelting and fuel combustion.1 In humans, long-term exposure can cause kidney dysfunction as a result of intake from contaminated food and water. The World Health Organization (WHO) guideline level for cadmium in drinking water is 0.003 mg L−1
(27 nM) with levels found generally below 0.002 mg L−1.2 The ability to monitor low levels of cadmium using a cheap, fast and reliable method is desirable. Devices based on chemically modified electrodes based on self-assembled monolayers (SAMs) of thiols on gold have great scope for meeting these requirements.3,4 SAMs provide molecular level control over the choice of sensing interface such that the electrode can be tuned in terms of sensitivity, selectivity and reproducibility. SAMs with amide functionalities which mimic the binding of metals in biological organisms provide a simple choice for the design of these electrodes.5–13 This idea was employed by Liu et al.7 for the determination of sub-ppb levels of copper (II) using cysteine monolayers and more recently by our research group using Gly–Gly–His attached to a thiol SAM for even lower levels of copper (II).8,9 The purpose of this paper is to extend our approach of fabricating metal ion sensors to cadmium using glutathione (which has the sequence γ-Glu–Cys–Gly) as the peptide recognition element. The binding of Cd2+ by GSH has been reported previously using cyclic voltammetry on mercury electrodes in combination with multivariate analysis which showed that both Cd(GSH)2 and Cd2(GSH)2 were formed.14–16 Glutathione can also be self-assembled onto gold electrodes using the thiol side chain on the cysteine to anchor the peptide to the electrode. This approach has been used to either give Li+ biosensors which exploit ion-gating17,18 or by complexation as part of a copper sensor.12,13 There are two main drawbacks of using the thiol side-chain of cysteine for electrode modification. Firstly, the protocol is not generic as not all peptides contain cysteine. Secondly, the thiol side chain is involved in the complexation of many metals and therefore a major binding mode is lost. A generic strategy for modifying electrodes, which did not have these drawbacks, involves attachment of an amino acid or peptide to a SAM of 3-mercaptopropionic acid on a gold surface. The carboxyl terminus allows attachment of the amino group of any peptide sequence, and the analysis is effected by stripping voltammetry that exploits the electrochemistry of the complexed metal. In the case of glutathione the immobilization strategy allows the thiol of the cysteine to remain available for the complexation with metal ions, an option unavailable to previous studies using gold electrodes where the thiol is involved in the electrode modification.Glutathione is a well-known biologically-active peptide which plays key physiological roles. Its coordination chemistry to cadmium has been studied extensively15,16,19–23 since the affinity of thiol groups for heavy metals is important in toxicology. It has as many as eight potential binding sites: two carboxyls, one sulfhydryl, one amino and two pairs of carbonyl and amide donors. Carbon-13 NMR studies have shown that one cadmium ion complexes to two glutathione molecules.20 Cadmium also binds to some extent to the peptide linkage between the cysteinyl and glycyl residues as evidenced by the chemical shifts of the cysteinyl carbon resonances, the extent of binding being a function of pH. It has been suggested at pH > 6.5, an increase in binding to the glutamyl carboxyl and amino group occurs. There is also a weak indication of binding to the glycyl carboxyl group. Studies at various pH ranges have found up to seven stoichiometric forms with the thiolate donor coordinated to Cd2+ at a pH as low as 3.5.
In this paper we demonstrate the ability of glutathione attached to a SAM to form a complex with cadmium and thus act as the basis of a sensor. The analytical performance of the sensor is evaluated along with the influence of a variety of experimental parameters which may affect the complexation of Cd2+. Furthermore we have developed an analytical model to simulate the dynamic binding of the metal which allows calibration across a range of concentrations and identification of the optimal accumulation conditions.
Experimental
Materials
Glutathione (reduced form, >98% purity) and N-hydroxysuccinimide (NHS) were purchased from Sigma (Sydney, Australia). 3-Mercaptopropionic acid (MPA), 1-propanethiol, 1-ethyl-3-(3-dimethylaminopropyl) carbodiimide hydrochloride (EDC), 2-(N-morpholino)-ethanesulfonic acid (MES), barium (II) nitrate, zinc (II) nitrate and HClO4 were from Aldrich (Sydney, Australia). Sodium hydroxide, sodium chloride, sulfuric acid, nitric acid, ammonium acetate, ethanol, copper (II) sulfate, lead (II) nitrate and chromium (III) nitrate were obtained from Ajax (Sydney, Australia). Cadmium (II) nitrate was purchased from Fluka (Sydney, Australia). Nickel (II) nitrate was obtained from Prolabo (Paris, France).All solutions were prepared with Milli-Q water (18 MΩ cm, Millipore, Sydney). Buffer solutions used in this work were 50 mM ammonium acetate (pH 7.0) and 0.1 M MES (pH 6.8). The pH was adjusted with either NaOH or HNO3 solutions. Stock metal solutions (0.1 M) were prepared in Milli-Q water and dilute metal solutions in ammonium acetate. All glassware was rinsed with 6 M HNO3 followed by Milli-Q water before use to avoid metal contamination.
Preparation of modified electrodes
Gold electrodes were prepared by sealing polycrystalline gold wire (>99.99% gold, Aldrich) in 4 mm diameter glass tubes with EPON Resin 825 and EPI-CURE curing agent 3271 from Shell (Sydney, Australia). The cut end of the wire was polished with 1.0 µm alumina, followed by 0.3 and 0.05 µm alumina slurry on microcloth pads (Buehler, Lake Bluff, IL, USA). After removal of trace alumina from the surface, by rinsing with Milli-Q water and brief cleaning in an ultrasonic bath, the electrodes were further cleaned by cycling between −300 mV and +1500 mV in 50 mM H2SO4 at a scan rate of 150 mV s−1 until a reproducible scan was obtained. The electrochemical area of the electrode was determined from the reduction of gold oxide by the method of Hoogvliet et al. using a conversion factor of 482 µC cm−2.24Modification of the electrode with MPA–GSH was performed as outlined in Scheme 1. First, the electrode was incubated overnight in a 10 mM solution of MPA in 75% ethanol, 25% water. Following rinsing with absolute ethanol the carboxyl terminus was activated by immersing the gold electrode in a stirred solution of 20 mM EDC and 4 mM NHS in 100 mM MES (pH 6.8) for 1 h. After thorough rinsing with 25 mM MES buffer, the modified electrode was reacted overnight with glutathione (50 mg mL−1) in MES buffer at 4 °C to form the MPA–GSH modified electrode.
 |
| | Scheme 1 Schematic of the preparation of MPA–GSH modified gold electrodes. MPA was self-assembled on a clean gold electrode from a 10 mM, 75% ethanol : 25% water solution overnight, followed by activation of the carboxyl terminus using EDC and NHS. The resultant succinimide ester monolayers were reacted overnight in a solution of GSH. | |
Measurement procedure
All measurements were made in a water-jacketed cell at 25 °C after equilibration for at least 1 h. Cadmium ions were accumulated at the MPA–GSH modified electrode at open circuit potential by immersing the electrode into 10 mL of a stirred aqueous solution of cadmium (II) nitrate in 50 mM ammonium acetate (pH 7.0) for 10 min. The electrode was removed, rinsed with cadmium-free ammonium acetate and transferred to a cell with electrolyte of 50 mM ammonium acetate (pH 7.0) and 50 mM NaCl for electrochemical measurements by cyclic voltammetry (CV) and Osteryoung square wave voltammetry (OSWV). After the measurement bound cadmium was eliminated from the electrode at +500 mV for 30 s in 0.1 M HClO4.The metal ion concentration of a solution was determined using an ELAN 6100 ICP-MS (from Perkin Elmer, Boston, MA, USA). All concentrations stated are the concentrations measured by ICP-MS, except in the interference studies where nominal concentrations of added interferents are stated.
Electrochemical measurements
All electrochemical measurements were performed with an Autolab PGSTAT 12 potentiostat (Eco Chemie, Netherlands). CV, OSWV and time base experiments were carried out with a conventional three-electrode system, comprising a bare or modified working electrode, a platinum flag auxiliary electrode and a Ag|AgCl|3.0 M NaCl reference electrode (from Bioanalytical Systems Inc., Lafayette, IN, USA). All potentials are reported versus this reference at 25 °C unless otherwise stated. The solution was degassed with argon for approximately 15 min prior to data acquisition and was blanketed under an argon atmosphere during the entire experimental period. Cyclic voltammetry was conducted at a range of sweep rates (10–1000 mV s−1) between +400 mV and −400 mV. In OSWV, the pulse amplitude was 25 mV with a step of 4 mV and frequency of 25 Hz. OSW voltammograms were measured between +400 mV and −400 mV. Time base experiments were carried out at +500 mV for 15 s.Calibration model
It will be demonstrated that an adsorption time of 10 min does not allow equilibration of complexation of cadmium ions from solutions of concentrations below 100 nM. Thus although the relation between OSWV peak height and concentration of cadmium follows a Langmuir-like curve, it is governed by a more complex scheme that must involve the kinetics of adsorption. However a model can be developed, which should be applicable to similar scenarios.Results and discussion
Electrochemical behaviour of Cd2+ at MPA–GSH modified electrodes
The cyclic voltammogram of an electrode modified with MPA–GSH measured in 50 mM ammonium acetate buffer solution containing 50 mM NaCl is shown in Fig. 1(a)(i). In the absence of Cd2+ in the accumulation solution, the electrode is inactive between −400 and +400 mV. After accumulation of Cd2+
(98 nM) for 10 min distinct peaks of the redox chemistry of Cd2+/Cd0 were observed with Ea=
−220 mV, Ec=
−300 mV (Fig. 1(a)(ii)). This demonstrates the ability of MPA–GSH modified electrodes to determine low concentrations of cadmium ions. The reduction of complexed Cd2+ results in the underpotential deposition (UPD) of Cd onto the gold surface. UPD is the deposition of a metal on a foreign substrate at potentials more positive than the standard redox process which for Cd2+/Cd0 is −620 mV. UPD of cadmium on short-chained SAMs has also been observed previously by Yoneyama and co-workers at −150 mV under acidic conditions.25,26 The electrochemistry is reversible and the current is reasonably stable, showing little decrease in the cadmium current after repetitive cycling (see Fig. 1(a)(ii)). However, there is a shift in the baseline with each successive cycle. The stability of the cadmium electrochemistry is somewhat surprising since one would expect that plating of cadmium onto gold and its subsequent stripping would affect the SAM structure. However, Yoneyama and co-workers have demonstrated that UPD of Cu on SAMs of 3-propanethiol can occur and be oxidatively stripped with no loss of SAM molecules.27 Even more surprising is that this process actually stabilizes the SAM as revealed by the absence of a reductive desorption peak of the SAM when swept to −1200 mV in KOH. That the cadmium electrochemistry resulted from a surface (non-diffusive) process was confirmed by the linearity of a plot of cathodic peak current against scan rate (Fig. 1 inset). For quantification purposes, OSWV measurements were carried out for the reduction of Cd2+ after accumulating in 98 nM Cd2+ for 10 min. A peak current density of 4.3 µA cm−2 was measured (Fig. 1(b)). |
| | Fig. 1 Voltammograms of MPA–GSH modified electrodes for the detection of Cd2+ ions measured in 50 mM ammonium acetate (pH 7.0) and 50 mM NaCl. (a) Cyclic voltammograms of MPA–GSH modified electrodes (i) before accumulation of metal ions and (ii) after accumulation in 98 nM Cu2+ for 10 min. Multiple cycles in the cadmium voltammogram illustrate stable electrochemistry. Scan rate: 0.1 V s−1. Inset: Plot of the CV cathodic peak current against scan rate for the MPA–GSH–cadmium complex on gold. (b) Cathodic Osteryoung square wave voltammograms of MPA–GSH modified gold electrodes (i) before accumulation of metal ions and (ii) after accumulation in 98 nM Cd2+ for 10 min. | |
Influence of temperature
As both binding between the peptide and the metal, and transport to the electrode are influenced by temperature, this was studied by varying the temperature of the accumulation and measurement solution between 15 °C and 30 °C. The cathodic OSWV peak currents are shown in Fig. 2 for accumulation of 98 nM Cd2+ for 10 min. Over this small range of temperatures the current increases approximately linearly with temperature with a slope of 0.15 µA cm−2
°C−1 which is about 4% of the measured current per degree. In a device, precalibrated temperature compensation would be possible, reducing the influence of temperature to less than 1%.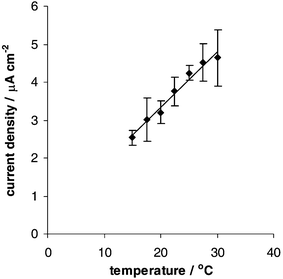 |
| | Fig. 2 OSWV cathodic peak current densities of MPA–GSH modified electrodes after accumulation in 98 nM Cd2+ as a function of the measurement and accumulation temperature. Experimental conditions as given for Fig. 1. | |
Influence of accumulation time
The effect of accumulation time on the response of MPA–GSH modified electrodes was evaluated at three different concentrations (18, 98 and 418 nM Cd2+ respectively). As shown in Fig. 3, the OSWV cathodic current increases with accumulation time. At higher concentrations, the current reaches a plateau at shorter accumulation times. The figure illustrates that to use the sensor with equilibrium binding of the metal would be prohibitively long for any practical application. As a consequence we elected to use the sensor in kinetic mode which necessitates control over the temperature, mass transport and time of accumulation. To ensure maximum differentiation between concentrations an accumulation time of 10 min was chosen. This accumulation time gave a wider dynamic range than longer times, even though the longer accumulation time gave higher currents. The solid lines are fits to a kinetics model which accounts for the non-equilibrium binding event. |
| | Fig. 3 OSWV cathodic peak current densities of MPA–GSH modified electrodes after accumulation in Cd2+ as a function of the accumulation time. Electrodes were incubated in (i) 418 nM, (ii) 98 nM and (iii) 18 nM cadmium nitrate in 50 mM ammonium acetate at 25 °C. Solid curves are fits to eqns. (6) and (7). Error bars are the 95% confidence interval determined from the within groups mean square of an ANOVA of 25 duplicate results. | |
Theoretical treatment of OSWV peak currents
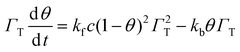
The shape of a typical calibration curve of peak current against concentration of Cd2+ in the accumulation solution appears Langmuir-like, and as the current may be taken as proportional to the coverage of bound Cd2+, a model of a fixed number of surface sites in equilibrium with Cd2+ in solution would lead to the typical equation| |  | (1) |
where Ka is the affinity constant of the 1 ∶ 2 cadmium–GSH complex,20θ is the fraction of GSH bound to cadmium, c is the concentration of Cd2+ in solution and ΓT is the surface concentration of sites. However it is apparent from Fig. 3 that equilibrium is not reached during accumulation times used here (10 min) for concentrations of cadmium less than 100 nM. To model the range of concentrations, the kinetics of accumulation must be solved.Consider the accumulation process:
| |  | (2) |
The rate of accumulation of complex, is
| |  | (3) |
therefore
| |  | (4) |
this is of the form d
θ/d
t
=
Aθ2
+
Bθ
+
C, with
A
=
C
=
kfcΓT, B =
−(2
kfcΓT
+
kb), which has a solution
| |  | (5) |
which for real
q
(
i.e. a positive discriminant)
=

. Rearranging for
θ| |  | (6) |
The peak current density,
I is
Note that as
t
→
∞
| |  | (8) |
where
K
=
kf/
kb .
Eqn. (8) is the result that is obtained from an equilibrium model of adsorption (
eqn. (1)). Note also that in the expression for
θ the term
kfΓT is not independent.
The data in Figs. 3 and 5 have been fitted (using Solver in Microsoft Excel) to common values of kfΓT
= 0.00147 ± 0.00023 (pmol cm−3)−1 min−1, kb
= 0.0546 ± 0.0028 min−1, and individual values of const in eqn. (7). 95% confidence intervals are quoted that have been calculated by the procedure given by de Levie.28
Interference studies
The selectivity of the MPA–GSH modified electrodes for Cd2+ was examined in the presence of a variety of metals found in natural samples: Cu2+, Zn2+, Ni2+, Pb2+, Cr3+ and Ba2+. A two level Plackett–Burman experimental design29 was constructed which allowed an estimation of the so-called main effects of the factors (the concentrations of metal ion interferents), as shown in Table 1. The main effect is the average change in response variable (here current density) as the factor is changed from its low value (designated by the contrast coefficient −1) to its high value (contrast coefficient +1). Each solution contained 230 nM Cd2+ plus either a low concentration (−1, nominal 50 nM) or high concentration (+1, nominal 500 nM) of each interferent. Thus the experimental design approach for assessing the effect of interferences is rather different from the traditional approach of monitoring the current from the metal ion of interest in the presence of increasing concentrations of a single interfering ion. In the experimental design the electrodes are exposed to a cocktail of all the metal ions. The advantages of this approach are fewer experiments are performed with greater precision of the estimates of the effects, and the possibility of estimating measurement variance. At the pH of the buffer, and in the presence of trace concentrations of phosphate, the concentrations may be different to the nominal concentrations and therefore the solutions were analyzed by ICP-MS to give actual concentrations (see Table 2).
Table 1 Two level Plackett–Burman experimental design for interference studies of cadmium complexation to MPA–GSH. Experimental conditions as described for the caption in Fig. 4, and concentrations of ions corresponding to contrast coefficients +1 and −1 are given in Table 2
| Run | Cu2+ | Zn2+ | Ni2+ | Pb2+ | Cr3+ | Ba2+ | Dummy |
|---|
| 1 | −1 | −1 | −1 | +1 | +1 | +1 | −1 |
| 2 | +1 | −1 | −1 | −1 | −1 | +1 | +1 |
| 3 | −1 | +1 | −1 | −1 | +1 | −1 | +1 |
| 4 | +1 | +1 | −1 | +1 | −1 | −1 | −1 |
| 5 | −1 | −1 | +1 | +1 | −1 | −1 | +1 |
| 6 | +1 | −1 | +1 | −1 | +1 | −1 | −1 |
| 7 | −1 | +1 | +1 | −1 | −1 | +1 | −1 |
| 8 | +1 | +1 | +1 | +1 | +1 | +1 | +1 |
Table 2 Concentrations of high and low levels of interfering ions used in the experimental design measured by ICP-MS
| | Low (−) | High (+) |
|---|
| Concentration/nM | Concentration/nM |
|---|
| Cu2+ | 9.4 | 110 |
| Zn2+ | 7.6 | 95 |
| Ni2+ | 7.4 | 120 |
| Pb2+ | 9.2 | 77 |
| Cr3+ | 29 | 370 |
| Ba2+ | 35 | 340 |
As the Plackett–Burman design can only be applied to (4n
− 1) factors (n
= 1, 2 etc.), a 7-variable, 8-experiment design was used with six interferent factors and a dummy factor. The dummy factor (one in which nothing is changed) allows an estimate of the measurement variance. To determine the effect of a factor, the responses multiplied by their contrast coefficients are summed, and then divided by half the number of runs. The significance of an effect can be inferred from a Rankit plot (or normal distribution plot) which is constructed by plotting the expected normal z-score of the rank of a particular effect against the value of the effect. If the data have only random errors that are normally distributed then the effects should lie on a straight line through zero. As shown in Fig. 4 the effects of Ni2+, Zn2+, Cr3+, Ba2+
(and the dummy) on the determination of cadmium by MPA–GSH fall on such a straight line and may be considered not to be significant. The dummy effect is close to zero as expected and is a good indication of the validity of the measurements. The interfering metals are Cu2+ which has a negative effect of 2.4 µA cm−2 upon changing from its low to high concentration, and Pb2+ which has a positive effect of 2.8 µA cm−2. In the absence of interfering metals the OSWV cathodic response is 5.6 µA cm−2. The results for copper are not surprising considering mixed monolayers of GSH and MPA have been used by Zeng and co-workers to detect copper.12 An advantage of using peptide modified electrodes for detecting metal ions is the two levels of selectivity offered. The first is the different affinity of metals for a peptide and the second is the redox potential of a bound metal ion. Copper represents the type of interfering species which competes with cadmium for binding sites on MPA–GSH leading to a decrease in current. However, if the metal has a redox potential close to the target metal this may enhance the signal as in the case for lead. It has been shown by Kane-Maguire and co-workers21 using proton NMR that Pb2+ coordinates to glutathione mainly via the sulfhydryl group with some binding to the glycyl carboxyl group. This was also confirmed by carbon-13 NMR studies by Fuhr and Rabenstein.20 In the same paper, it was stated that zinc can also bind to glutathione in a similar way to cadmium. However we have observed here that Zn2+ has no significant effect.
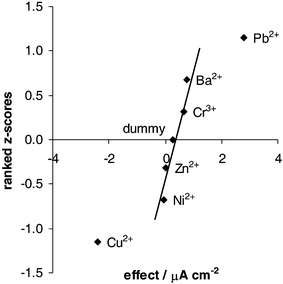 |
| | Fig. 4 Rankit plot of the effects of interferents from a Plackett–Burman 8-factor experimental design. | |
Stability and regeneration of electrodes
As part of the evaluation of the performance of MPA–GSH modified electrodes, the stability after regeneration by HClO4 was investigated. The cathodic OSWV current was measured in a series of accumulation (98 nM Cd2+ for 10 min)–regeneration cycles. The currents were fitted to a linear regression model: I/I0
= 1 +
bλ where λ is the accumulation/regeneration cycle, and I0 the OSWV current of a freshly prepared electrode. The parameter b, which is the fractional degradation in the current per cycle was determined for the range 1 to 3, 4, … 20 cycles. The slope became significantly different from zero (α
= 0.05, established by a t test of the standard error of b) after 16 cycles with a value of −0.021 µA cm−2 cycle−1. In a similar experiment to determine the storage life, an electrode was used once a day for two weeks and stored in ammonium acetate buffer at 4 °C when not in use. Over this time the current was unchanged within the repeatability of the measurements.Dependence of OSWV peak current on Cd2+ concentration
Osteryoung square wave voltammetry was employed in preference to cyclic voltammetry for analysis as square wave techniques afford better sensitivity. A calibration plot of OSWV peak cathodic current against concentration of Cd2+ is given in Fig. 5. The sensor displays excellent dynamic range (two orders of magnitude) with the lowest Cd2+ concentration measured from the OSWV peak cathodic current being 5 nM. The electrode performance compared with other Cd2+ selective electrodes is reasonable considering our detection limit is well below the WHO guideline value for drinking water (27 nM).2 Amperometric biosensors developed by Hu and co-workers30,31 using 1-(pyridylazo)-2-naphthol modified glassy carbon electrodes have reported detection limits of 0.05 nM. Although the detection limit is low, Hu and co-workers also encountered interferences by Cu2+ and Pb2+. In other work, Kremleva et al. developed an amperometric cysteine desulfhydrolase biosensor which could measure Cd2+ down to 10 nM.32 One advantage of our sensor, however, is the simplicity of its design: self-assembly of a carboxylated SAM followed by covalent attachment of the peptide ligand. Turyan and Mandler33 used a self-assembled monolayer of ω-mercaptocarboxylic acids on gold electrodes directly for cathodic stripping measurements with remarkably low levels of 4 pM Cd2+. Such low detection limits were not achievable in our hands and Turyan and Mandler reported the electrode did suffer from some interference from Fe3+ and Cr3+. Spectrophotometric methods for Cd2+ have also been evaluated using a chromogenic crown ether with a detection limit of ∼50 nM.34 The advantage of the peptide approach for detecting metal ions is different peptides with different selectivity for metals could be used to account for interference problems. This is a possibility which is more easily achieved than with the other metal ion selective electrodes because the approach to coupling the peptide to the electrodes is generic and the synthesis of peptide ligands is relatively simple. |
| | Fig. 5 Calibration curve of the cathodic OSWV peak current density at MPA–GSH modified electrodes with concentration of Cd2+ in the accumulation solution. Error bars are ±1 standard deviation of the currents of four electrodes prepared on different days. Experimental conditions as given for Fig. 1. The solid curve is a fit to eqns. (6) and (7), as described in the text. | |
Conclusions
Using a generic approach developed by our group the tripeptide glutathione has been attached to a carboxyl terminated thiol SAM on a gold electrode. The free sulfhydryl side chain of glutathione is available to complex cadmium ions, which then may be electrochemically reduced. Voltammetry of the redox couple allows determination of cadmium ion concentration. The detection limit of Cd2+ at a MPA–GSH modified electrode after 10 min accumulation was 5 nM. This is less than drinking water standards. However, even lower detection limits may be achievable if the accumulation time is increased since for concentrations below 100 nM equilibrium has not yet been reached after 10 min accumulation. A kinetic model is reported that allows calibration of the voltammetric current even when the complex does not achieve equilibrium. Of significance to the potential use as a sensor, MPA–GSH modified electrodes have good long term stability if the electrodes are used once per day (more than 14 days), and may be regenerated at least 16 times in continuous use.References
- M. Mejare and L. Bulow, Trends Biotechnol., 2001, 19, 67 CrossRef CAS.
- Australian Water Drinking Guidelines, Inorganic Chemicals: Cadmium, Fact Sheet No. 44, NHMRC and Agriculture and Resource Management Council of Australia and New Zealand, 1996 Search PubMed.
- S. Flink, F. C. J. M. v. Veggel and D. N. Reinhoudt, Adv. Mater., 2000, 12, 1315 CrossRef CAS.
- J. J. Gooding, F. Mearns, W. Yang and J. Liu, Electroanalysis, 2003, 15, 81 CrossRef CAS.
- D. W. M. Arrigan and L. L. Bihan, Analyst, 1999, 124, 1645 RSC.
- J. J. Gooding, D. B. Hibbert and W. Yang, Sensors, 2001, 1, 75 Search PubMed.
- A. C. Liu, D. C. Chen, C. C. Lin, H. H. Chou and C. H. Chen, Anal. Chem., 1999, 71, 1549 CrossRef CAS.
- W. Yang, E. Chow, G. D. Willett, D. B. Hibbert and J. J. Gooding, Analyst, 2003, 128, 712 RSC.
- W. Yang, D. Jaramillo, J. J. Gooding, D. B. Hibbert, R. Zhang, G. D. Willett and K. J. Fisher, Chem. Commun., 2001, 19, 1982 RSC.
- W. Yang, J. J. Gooding and D. B. Hibbert, Analyst, 2001, 126, 1573 RSC.
- W. Yang, J. J. Gooding and D. B. Hibbert, J. Electroanal. Chem., 2001, 516, 10 CrossRef CAS.
- B. Zeng, X. Ding and F. Zhao, Electroanalysis, 2002, 14, 651 CrossRef CAS.
- C. Fang and X. Y. Zhou, Electroanalysis, 2003, 15, 1632 CrossRef CAS.
- J. Mendieta, M. S. Diaz-Cruz, R. Tauler and M. Esteban, Anal. Biochem., 1996, 240, 134 CrossRef CAS.
- M. S. Diaz-Cruz, F. Mendieta, R. Tauler and M. Esteban, J. Inorg. Biochem., 1997, 66, 29 CrossRef CAS.
- M. S. Diaz-Cruz, J. Mendieta, R. Tauler and M. Esteban, Anal. Chem., 1999, 71, 4629 CrossRef CAS.
- K. Takehara, M. Aihara and N. Ueda, Electroanalysis, 1994, 6, 1083 CAS.
- K. Takehara, Y. Ide, M. Aihara and E. Obuchi, Bioelectrochem. Bioenerg., 1992, 29, 103 CrossRef CAS.
- A. Krezel and W. Bal, Acta Biochim. Pol., 1999, 46, 567 CAS.
- B. J. Fuhr and D. L. Rabenstein, J. Am. Chem. Soc., 1973, 95, 6944 CrossRef CAS.
- L. A. P. Kane-Maguire and P. J. Riley, J. Coord. Chem., 1993, 28, 105 CrossRef CAS.
- W. Kadima and D. L. Rabenstein, J. Inorg. Biochem., 1990, 38, 277 CrossRef CAS.
- S. Fujiwara, G. Formicka-Kozlowska and H. Kozlowski, Bull. Chem. Soc. Jpn., 1977, 50, 3131 CAS.
- J. C. Hoogvliet, M. Dijksma, B. Kamp and W. P. van Bennekom, Anal. Chem., 2000, 72, 2016 CrossRef CAS.
- D. Oyamatsu, S. Kuwabata and H. Yoneyama, J. Electroanal. Chem., 1999, 473, 59 CrossRef CAS.
- D. Oyamatsu, M. Nishizawa, S. Kuwabata and H. Yoneyama, Langmuir, 1998, 14, 3298 CrossRef CAS.
- M. Nishizawa, T. Sunagawa and H. Yoneyama, Langmuir, 1997, 13, 5215 CrossRef CAS.
- R. de Levie, How to use Excel® in Analytical Chemistry, Cambridge
University Press, Cambridge, 2001 Search PubMed.
- R. L. Plackett and J. P. Burman, Biometrika, 1946, 33, 305 Search PubMed.
- S. Hu, K. Wu, H. Yi and D. Cui, Proc. SPIE Int. Soc. Opt. Eng., 2001, 4414, 197 Search PubMed.
- S. Hu, H. Wu, H. Yi, X. Dai and D. Cui, Fresenius’ J. Anal. Chem., 2001, 370, 101 CrossRef CAS.
- N. V. Kremleva, E. P. Medyantseva, G. K. Budnikov and Y. I. Bormotova, Zh. Anal. Khim., 1999, 54, 151 CAS.
- I. Turyan and D. Mandler, Anal. Chem., 1994, 66, 58 CrossRef CAS.
- B. Vaidya, M. D. Porter, M. D. Utterback and R. A. Bartsch, Anal. Chem., 1997, 69, 2688 CrossRef CAS.
|
| This journal is © The Royal Society of Chemistry 2005 |
Click here to see how this site uses Cookies. View our privacy policy here.