Determination of levothyroxine and its degradation products in pharmaceutical tablets by HPLC-UV-ICP-MS
Sasi S.
Kannamkumarath
a,
Rodolfo G.
Wuilloud
a,
Apryll
Stalcup
a,
Joseph A.
Caruso
*a,
Himanshu
Patel
b and
Adel
Sakr
b
aDepartment of Chemistry, University of Cincinnati, Cincinnati, OH 45221-0172, USA. E-mail: joseph.caruso@uc.edu
bCollege of Pharmacy, University of Cincinnati, Cincinnati, OH 45219, USA
First published on 9th October 2003
Abstract
A new analytical methodology using high-performance liquid chromatography (HPLC) coupled to inductively coupled plasma mass spectrometry (ICP-MS) was applied to study the presence of possible degradation products in levothyroxine tablets. The analytical methodology takes advantage of the element-specific and highly-sensitive I detection provided by ICP-MS and is applied to the speciation of: 3,3′,5,5′-tetraiodothyronine (T4); 3,3′,5-triiodothyronine (T3); 3,5-diiodothyronine (T2); 3,3′,5,5′-tetraiodothyroacetic acid (TTAA4); 3,3′,5-triiodothyroacetic acid (TTAA3); and 3,5-diiodothyroacetic acid (TTAA2). Chromatographic conditions were optimized by using UV absorption at 225 nm and ICP-MS detection of 127I. Complete chromatographic resolution of the levothyroxine degradation products within 25 min was obtained using 22% (v/v) acetonitrile at pH 2.3, adjusted with 0.08% (v/v) trifluoroacetic acid. The introduction of the mobile phase containing acetonitrile was performed by post column on-line dilution (1∶3.3) of the chromatographic eluent with a 2% (v/v) nitric acid solution using a PTFE tee. The separations with either detector were good with little detector effect on the resolution. The peak broadening caused by on-line dilution was insignificant. The detection limits obtained with UV detection ranged from 28.9 to 34.5 µg l−1, whereas those obtained with the plasma detector were about 175–375 times better (lower). Finally, the analytical methodology was applied to the determination of possible iodine species originated by degradation of T4 in synthetic and commercial levothyroxine sodium tablets.
Introduction
Iodine is an essential trace element to animals and humans. It is utilized by the thyroid gland for the biosynthesis of the thyroid hormones 3,3′,5,5′-tetraiodothyronine (T4) and 3,3′,5-triiodothyronine (T3).1–3 On the other hand, an excess of iodine can produce goiter and hypothyroidism as well as hyperthyroidism.1–3 Therefore, an exact control of the ingestion of iodine through foods, drugs and water is mandatory in order to avoid adverse effects on the thyroid functioning of individuals.Synthetic levothyroxine sodium is used primarily in the treatment of hypothyroidism and as a thyroid stimulating hormone (TSH) suppressant, in the treatment or prevention of various types of euthyroid goiters.4 Regarding its chemical stability, levothyroxine sodium is sensitive to light, temperature, moisture, pH and oxidation.5–7 Moreover, the kinetics of degradation of levothyroxine sodium in solution and in solid state has been studied in a previous report.5 It was found that levothyroxine sodium degradation in solution is pH-dependent, showing less degradation at high pH. The proposed degradation pathway in solution was deiodination, whereas in the solid state degradation was predominantly by deamination. In fact, it has been shown that in addition to T4 and T3, 3,5-diiodothyronine (T2), 3,3′,5,5′-tetraiodothyroacetic acid (TTAA4), 3,3′,5-triiodothyroacetic acid (TTAA3) and 3,5-diiodothyroacetic acid (TTAA2) (see Fig. 1) can be found in samples as a consequence of levothyroxine degradation.6,8 Since the first synthetic levothyroxine sodium product was introduced in the United States in 1955 by Flint, under the brand name Synthyroid®, frequent recalls have been initiated from the discovery of tablets being sub-potent before the labeled expiration date, or because of lack of assurance that the product could maintain potency until the expiration date.9 This lack of stability and inconsistent potency has the potential to cause serious health consequences to patients requiring levothyroxine sodium. Moreover, ingestion of drugs other than levothyroxine sodium could have serious consequences due to a different biological activity of these compounds.5,6,8 Therefore, adequate analytical methodologies are required in order to assure the quality of the commercial levothyroxine sodium pharmaceutical tablets and to investigate degradation pathways.
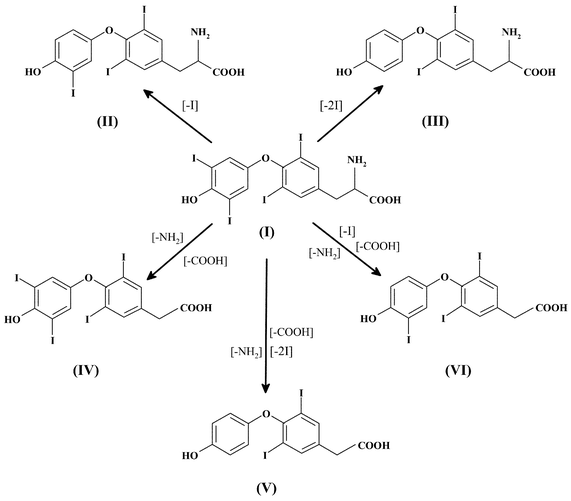 | ||
| Fig. 1 Possible degradation products resulting from levothyroxine decomposition. (I) 3,3′,5,5′-Tetraiodothyronine (T4); (II) 3,3′,5-triiodothyronine (T3); (III) 3,5-diiodothyronine (T2); (IV) 3,3′,5,5′-tetraiodothyroacetic acid (TTAA4); (V) 3,3′,5-triiodothyroacetic acid (TTAA3); (VI) 3,5-diiodothyroacetic acid (TTAA2). | ||
Among the different analytical methodologies developed for the determination of iodine species, high-performance liquid chromatography coupled to inductively coupled plasma mass spectrometry (HPLC-ICP-MS)10–19 has been the most applied hyphenated technique. Some other methodologies include the coupling of capillary electrophoresis (CE)20,21 or gas chromatography (GC) to ICP-MS to separate and determine iodine species.22,23 More specifically, at the present time, most of the analytical methodologies developed for the determination of levothyroxine degradation products involve the coupling of HPLC to different detectors, such as electrochemistry and molecular mass spectrometry (MS).6 While the separation and determination of degradation products were possible at high concentration levels, determination of these products at low levels is required and could not be accomplished by using these detectors. ICP-MS detection is an excellent alternative for determining iodine at low concentration levels15,20,24,25 and as an element specific detector it can simplify the determination of iodine species originated by deiodination reactions of levothyroxine. Moreover, the sensitivity of ICP-MS could be proportionally increased with the number of iodine atoms in the compounds to analyze. Therefore, the use of ICP-MS for the determination of compounds such as levothyroxine and its degradation products could be advantageous. However, the application of ICP-MS for the study and determination of levothyroxine degradation products in pharmaceutical products has not yet been reported.
In this study, an analytical methodology involving the use of HPLC coupled to ICP-MS is proposed as an efficient and sensitive technique for simultaneous separation and detection of levothyroxine degradation products species. The iodine species, inorganic iodine, T4, T3, TTAA4, TTAA3, and TTAA2, were determined in commercial and prepared levothyroxine sodium tablets exposed to accelerated degradation conditions. Chromatographic and detection conditions were studied and optimized in order to obtain the best analytical performance. In addition, the effect of different commonly used excipients was studied relative to the stability of levothyroxine in tablets.
Experimental
Instrumentation
ICP-MS detection was performed by using a PerkinElmer SCIEX Elan 6000 (Ontario, Canada) with a Gem Tip cross-flow nebulizer (PerkinElmer) and Ryton spray chamber (PerkinElmer). The nebulizer gas flow and ion lens setting were optimized using on-board computer algorithms with the Elan 6000 software. The ion lens voltage was 14.8 V. The outlet of the HPLC column was connected to the liquid sample inlet of the nebulizer using 0.025 mm id PEEK tubing of 30 cm in length.The chromatographic system was an Agilent 1100 HPLC (Agilent Technologies, Palo Alto, CA, USA) equipped with: a binary HPLC pump, an autosampler, a vacuum degasser system, a thermostated column compartment and a diode array detector. The use of both detectors on-line permitted monitoring the species by UV and by ICP-MS. The chromatographic column was a Cyano-Spherisorb (2.0 mm id × 250 mm length, 5 µm particle size) column (Waters Corporation, Milford, Massachusetts, USA) at a mobile phase flow rate of 0.3 ml min−1. This type of column appears highly efficient for the separation of levothyroxine and related compounds as has been demonstrated in a previous work.26 An on-line dilution of the chromatographic eluent coming from the UV detector was performed to decrease the concentration of organic solvent introduced into the plasma. Dilution was accomplished as follows: the chromatographic eluent was introduced using one side arm of a PTFE tee piece at a flow of 0.3 ml min−1 and a 2% (v/v) nitric acid solution flow (0.7 ml min−1) was introduced using the other side arm providing a 1 ∶ 3.3 dilution. Chromatographic and ICP-MS instrumental and operating conditions are shown in Table 1.
| ICP-MS parameters— | |
| Forward power | 1250 W |
| Plasma gas flow rate | 15.0 l min−1 |
| Auxiliary gas flow rate | 0.87 l min−1 |
| Carrier gas flow rate | 0.85 l min−1 |
| Sampling and skimmer cones | Nickel |
| Dwell time | 0.1 s |
| Isotopes monitored | 127I |
| Make-up solution | 2% (v/v) HNO3; 0.7 ml min−1 |
| HPLC parameters— | |
| Column | Cyano-Spherisorb narrow bore column, 2.0 mm id × 250 mm length, 5 µm particle size |
| Mobile phase | 22% (v/v) acetonitrile; 0.08% (v/v) trifluoroacetic acid |
| pH | 2.3 adjusted with trifluoroacetic acid |
| Mobile phase flow rate | 0.3 ml min−1 |
| Injected sample volume | 20 µl |
| UV detection (λ) | 225 nm |
Reagents
Individual standard solutions of 3,3′,5,5′-tetraiodothyronine, 3,3′,5-triiodothyronine, 3,5-diiodothyronine, 3,3′,5,5′-tetraiodothyroacetic acid, 3,3′,5-triiodothyroacetic acid and 3,5-diiodothyroacetic acid (Sigma Chemical Co., St. Louis, MO, USA) were prepared by dissolution of the chemicals in methanol (Fisher Scientific, Chicago, IL, USA). The final concentration of these solutions was 200 mg l−1. Calibration standards at lower concentrations were prepared by serial dilution with ultrapure water.All water was deionized (18 MΩ cm) and prepared by passing through a NanoPure treatment system (Barnstead, Boston, MA, USA). Commercial chemicals were of analytical reagent grade and were used without further purification. All reagents were of analytical reagent grade and iodine was not detected in the working range.
Tablet preparation was performed by using the following materials and preparation is described following this list of materials: levothyroxine sodium pentahydrate (Acros Organics, Fair Lawn, NJ, USA), dibasic calcium phosphate (Emcompress®, Penwest, Patterson, NY, USA), lactose anhydrous (Quest International, Norwich, NY, USA), Atlas® mannitol (ICI Americas, Inc., Wilmington, DE, USA), microcrystalline cellulose (MCC) (Emcocel® 90 M, Penwest, Patterson NY, USA) and Starch® 1500 (Colorcon, West Point, PA, USA), magnesium stearate (Mallinckrodt Chemical Inc., St. Louis MO, USA), aluminum lake blue #2 (Colorcon, West Point, PA, USA), Povidone (Kollidon 30 (PVP), BASF, Ludwigshafen, Germany), hydroxypropyl methylcellulose (HPMC, Methocel® K100LV, Dow Chemical Co., Midland, MI, USA), croscarmellose sodium (AcDiSol®, FMC Corporation, Newark, DE, USA), sodium starch gylcolate (Explotab®, Penwest, Patterson, NY, USA), crospovidone (BASF, Ludwigshafen, Germany), stearic acid (Mallinckrodt Chemical Inc, St. Louis, MO, USA), fumed silica (Cab-O-Sil® M-5P, Cabot Corporation, Tuscola, IL, USA), HYDRANAL® Composite 2 and HYDRANAL® methanol (Aldrich Chemical Company, Milwaukee, WI, USA). Acetonitrile, water, trifluoroacetic acid, phosphoric acid, sodium hydroxide, hydrochloric acid, sodium carbonate, sodium bicarbonate, magnesium oxide, tartaric acid and citric acid were all obtained from Fisher Scientific (Fair Lawn, NJ, USA). High density polyethylene bottles (HDPE) (SETCO Inc., Anaheim, CA, USA) were used for storing tablets.
Levothyroxine tablet preparation using different diluents
Different batches of 50 µg levothyroxine sodium tablets (500 µg g−1) were manufactured using one of the following five diluents: lactose anhydrous, microcrystalline cellulose, mannitol, starch and/or dibasic calcium phosphate. All tablets contained magnesium stearate and aluminum lake blue #2. The ingredients were mixed by geometric dilution in a mortar with pestle and directly compressed at 1000 psi using a Carver laboratory press (Fred S. Carver Inc., Menomonee Falls, WI, USA). Tablets were stored in HDPE bottles. The batches were tested for uniformity of dosage units (USP 25). The stability of the tablets was evaluated for six months under ICH accelerated stability conditions (40 °C and 75% RH) in an Espec humidity cabinet LHL112 (Tabai Espec Corp, Osaka, Japan).Preparation of tablets for analysis
Levothyroxine commercial tablets were obtained from local suppliers. The dosage of levothyroxine in the tablets varied (∼0.6–3 mg g−1) among the different pharmaceutical companies. Therefore, adequate quantities of tablets were powdered and dissolved in 25 ml of ultrapure water in a volumetric flask, obtaining a levothyroxine concentration of 8 mg l−1. Tablets prepared in the laboratory were dissolved according to a similar procedure and the levothyroxine concentration was 4 mg l−1. All solutions were kept in darkness and at a temperature of 5 °C to avoid posterior degradation of levothyroxine. All sample solutions were filtered through 0.45 µm membrane filters (Millipore Corporation, Bedford, MA, USA) before the analysis. The manipulation and analysis was done immediately after sampling in a clean laboratory environment. All the apparatus used to carry out these procedures were previously washed with a 10% (v/v) HNO3 water solution and then with ultrapure water.Results and discussion
Optimization of the HPLC separation conditions
Different standard solutions of 2 mg l−1 of each of the iodine species were used to determine the most adequate mobile phase and mobile phase flow rate for the separation of the iodine species. A volume of 20 µl of the standard solutions was injected to carry out these studies using UV absorbance detection and then, finally, to evaluate the separation by ICP-MS. In order to study the chromatographic resolution of the iodine species, several acetonitrile concentrations were evaluated, trying in all cases to obtain total separation using the lowest acetonitrile concentration possible. An acetonitrile concentration of 22% (v/v) with isocratic conditions was the best concentration to obtain complete resolution of the iodine species and be compatible with the introduction of the mobile phase into the ICP-MS. Additionally, to optimize resolution for all the peaks, the mobile phase flow rate was studied in a range of 0.1–0.5 ml min−1. Complete resolution was obtained with a mobile phase flow rate of 0.3 ml min−1 and for an acetonitrile concentration of 22% (v/v) in the mobile phase (Fig. 2 (a) and (b)). Higher mobile phase flow rate values did not yield a complete separation of the iodine species, while lower flow rates increased the retention times significantly and produced higher dispersion of the chromatographic signal, giving less sensitivity. At the wavelength of 225 nm, the organoiodine species showed high absorbance and solvent absorption was minimal.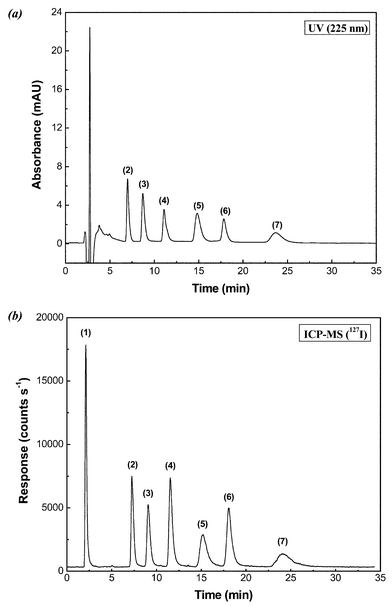 | ||
| Fig. 2 Comparison of (a) UV absorbance detection at 225 nm and (b)ICP-MS detection (127I) for the analysis of iodine species in levothyroxine pharmaceutical tablets. Iodine species: (1) inorganic iodine; (2) T2; (3) TTAA2; (4) T3; (5) TTAA3; (6) T4; (7) TTAA4. Concentration of each iodine species was 200 µg l−1. Other conditions are as given in Table 1. | ||
Peak reproducibility values, in terms of peak area and retention time, were measured with UV detection at the conditions given in Table 1. The relative standard deviations (RSDs), based on three replicates, were well below 5% for all the iodine species absorbing at 225 nm. Absolute limits of detection for all the species, measured by calculating three times the standard deviation of the blank and dividing by the slope of the calibration graph, are given in Table 2.
| Retention time/min | Instrumental detection limit/µg l−1 | RSD (%) | ||||
|---|---|---|---|---|---|---|
| Species | UV | ICP-MS | UV | ICP-MS | UVa | ICP-MSb |
| a Concentration of each iodine species was 0.2 mg l−1. b Concentration was 10 µg l−1 of each iodine species. | ||||||
| Inorganic iodine | — | 2.1 | — | 0.12 | — | 2.5 |
| T2 | 6.9 | 7.3 | 29 | 0.13 | 2.9 | 2.2 |
| T3 | 11.2 | 11.6 | 32 | 0.17 | 3.9 | 3.2 |
| T4 | 17.8 | 18.2 | 34 | 0.09 | 4.0 | 1.5 |
| TTAA2 | 8.7 | 9.1 | 30 | 0.17 | 3.1 | 3.7 |
| TTAA3 | 14.8 | 15.2 | 32 | 0.11 | 2.8 | 2.3 |
| TTAA4 | 23.7 | 24.1 | 35 | 0.16 | 3.6 | 3.4 |
Optimization of ICP-MS variables
The ICP-MS instrumental parameters were carefully studied in this work to obtain optimal sensitivity conditions for monitoring of 127I. Due to restrictions for introducing a high organic solvent load into the plasma, on-line dilution of the chromatographic eluent, containing 22% acetonitrile, was necessary. This was carried out by means of a PTFE tee to allow mixing of flows from the chromatographic column at 0.3 ml min−1 and from a 2% (v/v) nitric acid solution at 0.7 ml min−1. Consequently, the analytes were introduced into the cross-flow nebulizer at a final flow rate of 1.0 ml min−1. An important effect that has to be taken into account when chromatographic signals are measured is the dispersion produced by connections including the post-column PTFE tee. It is known that transient signals can be affected at mixing points producing an increase of the dispersion of these signals and subsequent broadening. In order to evaluate the dispersion generated by the PTFE tee connection, a fast experiment was carried out injecting a limited volume of a potassium iodide solution into the mobile phase using a flow injection system without the chromatographic column. Fig. 3(a) shows the dispersion produced by the PTFE tee connection on the transient signal generated with an injection of 20 µl of 100 µg l−1 iodide solution. However, as can be appreciated, the effect was not significant. A comparison between Fig. 2(a) and Fig. 2(b) verifies that no appreciable dispersion of the chromatographic peaks were caused by the PTFE connection. Retention times obtained for all iodine species are shown in Table 2, with the retention time difference between the UV and ICP-MS detectors, which is caused by the UV detector being positioned ahead of the ICP-MS. | ||
| Fig. 3 (a) Effect of the PTFE tee connection on the dispersion of the transient signals. Injection of 20 µl of 100 µg l−1 I solution into the mobile phase in (1) the absence and (2) the presence of the tee connection. (b) Influence of the acetonitrile concentration in the mobile phase on the ICP-MS response with 20 µl of 100 µg l−1 I injection. (■) Analytical and background signals; (•) background signal; and (▲) analytical signal with background signal discounted. | ||
The on-line dilution of the chromatographic column outlet reduced the acetonitrile concentration, improving the performance obtained by the ICP-MS. A sequential study was carried out in order to evaluate the effect of the acetonitrile concentration on the ICP-MS response. In this case, a flow injection system was utilized to carry out the study, permitting a fast optimization. Additionally, usage of potassium iodide for optimizing the acetonitrile concentration was convenient to avoid the use of rare standards. Injections of 20 µl of 100 µg l−1 iodide solution were made directly into the mobile phase, which contained different amounts of ACN varying from 0 to 40% (v/v). Fig. 3(b) shows the increased background signal from increasing the acetonitrile concentration. On the other hand, the net signal shows a maximum at 5% (v/v) of acetonitrile. This type of improvement has been observed by others authors.27–29 Additionally, the on-line dilution avoided deposition of carbon residue on the surface of the sampling and skimmer cones. It then was possible to introduce diluted mobile phase for extended periods of time without a decrease the ICP-MS performance. ICP-MS optimization was developed by introducing a standard solution containing 100 µg l−1 iodide solution by one side arm of the tee while pumping the mobile phase into the other side arm. In this way, the device permitted the optimization of the 127I signal under the same conditions as those used for the analysis. Finally, the on-line dilution did not increase the noise of the signal and the RSD of the diluted iodine solution was about 2–4%, similar to that obtained for conventional sample introduction with the cross-flow nebulizer.
The property of rf plasma power is an important parameter to optimize in ICP-MS studies, especially when organic solvents are being introduced into the plasma. The results obtained by the application of various forward power values showed 1250 W as being the most favorable, which yielded the highest signal-to-background ratio. Forward power values higher than 1250 W did not produce an increase in signal-to-background ratio. On the other hand, lower forward power values did not yield an enhancement in the signal and there was a possibility of extinguishing the plasma. Therefore, a forward power value of 1250 W was selected in this work.
The argon carrier gas flow rate was also optimized to enhance the sensitivity of iodine determination. In this case, an important difference was noticed regarding the optimal carrier gas flow rate obtained when constant iodine introduction and transient injection iodine introduction were performed. The best results for constant iodine introduction were obtained with 1.025 l min−1 of argon carrier flow rate. However, an argon carrier flow rate of 0.85 l min−1 was optimal when transient signals were monitored. In such cases, transient signals are more influenced by changes in the carrier gas flow rates, producing a higher signal dilution when higher flow rate is utilized. Consequently, a 0.85 l min−1 argon carrier flow rate was adopted as the most adequate to obtain the highest performance in the chromatographic signal monitored by ICP-MS.
Important information was also obtained regarding the response of the ICP-MS detector with the different iodine species present in the chromatographic eluent. As is shown in Fig. 1, the iodine species in this work differ in the number of iodine atoms per molecule; therefore the response of the detector should change with the different iodine species determined. The effect of the iodine species on the sensitivity of the ICP-MS was studied by injecting a 20 µl solution containing all the iodine species at the same molar concentration of 2 × 10⁻⁷ mol l−1 into the column. In Fig. 4, the expected enhancements with increasing iodine atoms are observed. The relationship between the ICP-MS sensitivity and the type of iodine species is best considered on a molar rather than the same µg l−1 basis.
 | ||
| Fig. 4 Dependence of ICP-MS detection ability with the number of iodine atoms per iodine compound. Concentration for each iodine species was equal to 2 × 10⁻⁷ mol l−1. Others experimental conditions were as given in Table 1. | ||
Analytical performance
The analytical performance obtained with the methodology proposed is seen in Table 2. The on-line coupling of UV and ICP-MS detectors to the chromatographic column permitted the study of the analytical performance characteristics in terms of retention times and peak widths. Table 2 shows the chromatographic characteristics for the iodine species using both detectors. As is observed, the difference in retention times between the detectors was 25 s, indicating minimal dead volume in the analytical system. Also, the proposed methodology permits the complete separation of the 7 iodine species in a time of 25 min (Fig. 2).Detection limits with ICP-MS were 175 to 375 times better compared with UV detection. The use of the ICP-MS permitted the detection and determination of iodine species at µg l−1 levels in solution or low µg g−1 in the tablet samples. The detection limits given in Table 2, were calculated as the amount of analyte required to yield a peak three times the standard deviation of the background signal (3σ). The percent RSD for ten replicates of 20 µl injections containing all the iodine species was <4% in all cases. The calibration graph was linear for each iodine species with correlation coefficients higher than 0.9996. The concentrations ranged from near the detection limits to 1000 µg l−1 with ICP-MS detection.
Recovery study
A recovery study was performed to demonstrate the capabilities of the methodology for the determination of the iodine species in the presence of sample matrix components. An aliquot of the levothyroxine sample solution was added from a standard solution containing all the iodine species. The iodine species concentration in the presence and the absence of the addition was calculated. Recovery values of the amount of iodine species added to the sample solution were in the 96–105% range, demonstrating the capability of the HPLC-UV-ICP-MS for the determination of iodine species in levothyroxine pharmaceutical tablets.Speciation analysis of levothyroxine tablets
A study of the effect of different common diluents used in the formulation of levothyroxine tablets was performed to evaluate possible degradation of levothyroxine. A typical chromatogram obtained for these samples using the HPLC-UV-ICP-MS is shown in Fig. 5(a). The concentrations of levothyroxine found in most of the tablets prepared with the different diluents were near 500 µg l−1, confirming no significant effect of the different diluents used in the formulation on the stability of levothyroxine (Table 3). Some iodine species, such as T2, TTAA2 and TTAA3, were not present in any of the tablets analyzed. However, it has been demonstrated that these iodine species, and moreover, all the iodine species studied in this work, could be present as a consequence of the thermal instability of levothyroxine.6,8 For other samples such as SS2, SS4, SS5 (shown in Fig. 5) a small amount of TTAA4 was found. The results suggest a possible effect of the diluents (lactose anhydrous, mannitol, and dibasic calcium phosphate) in the generation of deamination and decarboxylation products of levothyroxine. However, as shown in Table 3, the concentration of these species was not very high considering the long times that had passed since the samples were prepared. On the other hand, in the case of the sample SS5, a possible deiodination product was found corresponding to the T3 peak. Commercial levothyroxine tablets did not contain any degradation products and the major presence of levothyroxine was confirmed. Inorganic iodine species occurred in all levothyroxine tablets at concentrations ca. 1–10 µg g−1. This product was expected because of contamination present in the formulation of the levothyroxine tablets rather than as a consequence of degradation reactions. The absence of other deiodinated levothyroxine species, except T3 in sample SS5 at a very low level adds further confirmation.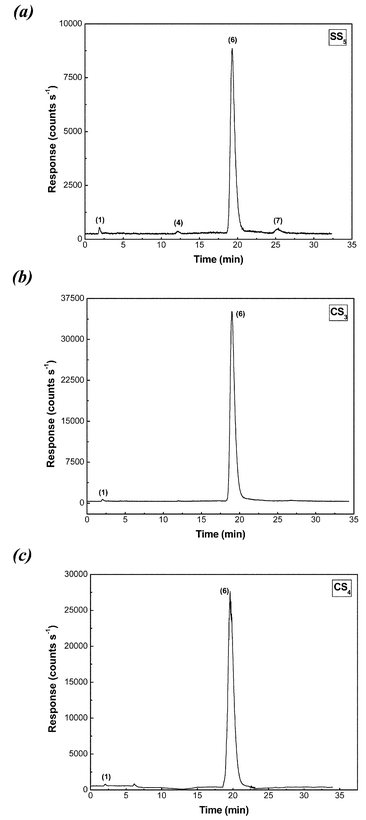 | ||
| Fig. 5 Typical chromatograms obtained for levothyroxine tablets using ICP-MS detection of 127I. (a) Synthetic levothyroxine tablet, (b) commercial tablet after expiration date, and (c) recent commercial levothyroxine tablet. Iodine species: (1) inorganic iodine; (2) T2; (3) TTAA2; (4) T3; (5) TTAA3; (6) T4; (7) TTAA4. Experimental conditions were as given in Table 1. | ||
| Samplesa | Concentration/µg g−1 | ||||||
|---|---|---|---|---|---|---|---|
| Inorganic iodine | T2 | T3 | T4 | TTAA2 | TTAA3 | TTAA4 | |
| a SSi: synthetic levothyroxine samples prepared with different diluents commonly used in the tablets formulation. SS1: with microcrystalline cellulose diluent; SS2: with lactose anhydrous diluent; SS3: with starch diluent; SS4: with mannitol diluent; SS5: with dibasic calcium phosphate. CSi: commercial samples obtained from different pharmaceutical companies. b Commercial samples 3–9 months older than expiration date. c Commercial sample before expiration date. | |||||||
| SS1 | 2.8 ± 0.3 | n.d. | n.d. | 494 ± 22 | n.d. | n.d. | n.d. |
| SS2 | 2.4 ± 0.4 | n.d. | n.d. | 497 ± 22 | n.d. | n.d. | 2.8 ± 0.3 |
| SS3 | 2.4 ± 0.3 | n.d. | n.d. | 500 ± 24 | n.d. | n.d. | n.d. |
| SS4 | 1.4 ± 0.2 | n.d. | n.d. | 499 ± 21 | n.d. | n.d. | 7.8 ± 0.8 |
| SS5 | 3.0 ± 0.2 | n.d. | 1.2 ± 0.2 | 476 ± 21 | n.d. | n.d. | 7.1 ± 0.9 |
| CS1b | 3.2 ± 0.2 | n.d. | n.d. | 1005 ± 57 | n.d. | n.d. | n.d. |
| CS2b | 4.7 ± 0.3 | n.d. | n.d. | 659 ± 41 | n.d. | n.d. | n.d. |
| CS3b | 11 ± 0.7 | n.d. | n.d. | 3121 ± 72 | n.d. | n.d. | n.d. |
| CS4c | 3.4 ± 0.3 | n.d. | n.d. | 1157 ± 56 | n.d. | n.d. | n.d. |
Conclusion
The on-line coupling of HPLC with ICP-MS permitted the complete separation and determination of possible degradation products of levothyroxine in pharmaceutical tablets. Higher sensitivity was obtained with ICP-MS detection as compared with UV detection of the chromatographic eluent. Additionally, lower detection limits were reached with ICP-MS for the determination of levothyroxine degradation products on a Cyano-spherisorb column in reversed phase conditions. Complete separation was obtained isocratically employing a mobile phase of containing 22% (v/v) acetonitrile. Further on-line dilution permitted improvement of the performance of the ICP-MS for 127I detection. With the proposed methodology the determination of levothyroxine degradation products was possible in the low µg l−1 range, whereas some degradation products may not be detected by using conventional UV detection because of poorer detection limits.Acknowledgements
The authors would like to thank Agilent Technologies for the continuing support of our work. We would also like to acknowledge NIEHS grant #ES04908 for partial funding of this research.References
- E. J. Underwood, Trace Elements in Human and Animal Nutrition; Academic Press, New York, 1977 Search PubMed.
- G. A. Glowa and S. P. Mezyk, Radiat. Phys. Chem., 1998, 53, 127–135 CrossRef CAS.
- W. Buchberger, J. Chromatogr. A, 1988, 439, 129–135 CrossRef CAS.
- A. Gilman, J. Hardman and L. Limbird, Goodman and Gilman's, The Pharmacological Basis of Therapeutics, McGraw-Hill Press, New York, 10th edn, 2001 Search PubMed.
- M. W. Chong, Pharm. Res., 1992, 9, 131–137 CrossRef.
- A. G. Kazemifard, D. E. Moore and A. Aghazadeh, J. Pharm. Biomed. Anal., 2001, 25, 697–711 CrossRef CAS.
- J. Wortsman, D. C. Papadimitriou, M. Borges and C. L. Defesche, Clin. Chem., 1989, 35, 90–92 CAS.
- M. Andre, R. Domanig, E. Riemer, H. Moser and A. Groeppelin, J. Chromatogr. A, 1996, 725, 287–294 CrossRef CAS.
- C. T. Rhodes, Clin. Res. Regul. Affairs, 1998, 15, 173–186 Search PubMed.
- H. Yamada, M. Sugahara, H. Kosaka, A. Katayama, K. Takahashi and K. Yonebayashi, Soil Sci. Plant Nutr., 1996, 42, 367–374 Search PubMed.
- K. Takatera and T. Watanabe, Anal. Chem., 1993, 65, 759–762 CrossRef CAS.
- H. Yamada, T. Kiriyama, Y. Onagawa, I. Hisamori, C. Miyazaki and K. Yonebayashi, Soil Sci. Plant Nutr., 1999, 45, 563–568 Search PubMed.
- H. J. Stark, J. Mattusch, R. Wennrich and A. Mroczek, Fresenius’ J. Anal. Chem., 1997, 359, 371–374 CrossRef CAS.
- L. F. Sanchez and J. Szpunar, J. Anal. At. Spectrom., 1999, 14, 1697–1702 RSC.
- G. Radlinger and K. G. Heumann, Fresenius’ J. Anal. Chem., 1997, 359, 430–433 CrossRef CAS.
- B. Michalke, Trends Anal. Chem., 2002, 21, 154–165 CrossRef CAS.
- M. Leiterer, D. Truckenbrodt and K. Franke, Eur. Food Res. Technol., 2001, 213, 150–153 Search PubMed.
- K. G. Heumann, L. Rottmann and J. Vogl, J. Anal. At. Spectrom., 1994, 9, 1351–1355 RSC.
- P. L. M. Cook, P. D. Carpenter and E. C. V. Butler, Mar. Chem., 2000, 69, 179–192 CrossRef CAS.
- B. Michalke and P. Schramel, Electrophoresis, 1999, 20, 2547–2553 CrossRef CAS.
- B. Michalke, J. Anal. At. Spectrom., 1999, 14, 1297–1302 RSC.
- A. Schwarz and K. G. Heumann, Anal. Bioanal. Chem., 2002, 374, 212–219 CrossRef CAS.
- R. G. Wuilloud, J. C. A. de Wuilloud, A. P. Vonderheide and J. A. Caruso, J. Anal. At. Spectrom., 2003, 18(9), 1119 RSC.
- B. Michalke, P. Schramel and H. Witte, Biol. Trace Elem. Res., 2000, 78, 67–79 Search PubMed.
- B. Michalke, P. Schramel and H. Witte, Biol. Trace Elem. Res., 2000, 78, 81–91 Search PubMed.
- R. Garnick, G. Burt, D. Long, W. Bastian and J. Aldred, J. Pharm. Sci., 1984, 73, 173–186.
- B. Gammelgaard and O. Jons, J. Anal. At. Spectrom., 1999, 14, 867–874 RSC.
- M. Montes-Bayon, C. B'Hymer, C. P. de Leon and J. Caruso, J. Anal. At. Spectrom., 2001, 16, 945–950 RSC.
- C. E. Sieniawska, R. Mensikov and H. T. Delves, J. Anal. At. Spectrom., 1999, 14, 109–112 RSC.
| This journal is © The Royal Society of Chemistry 2004 |