Analysis for selenium speciation in selenized yeast extracts by two-dimensional liquid chromatography with ICP-MS and electrospray MS-MS detection
Shona
McSheehy
,
Paweł
Pohl†
,
Joanna
Szpunar
,
Martine
Potin-Gautier
and
Ryszard
Łobiński
CNRS UMR 5034, Université de Pau et des Pays de l'Adour, Hélioparc, 2, av. Pr. Angot, F-64053, Pau, France
First published on 14th December 2000
Abstract
An analytical approach allowing the detection of previously unreported glutathione S-conjugates with selenocompounds in water extracts of nutritional yeast supplements was developed. The procedure was based on the use of two-dimensional size-exclusion and reversed-phase HPLC for the separation of selenospecies, ICP-MS for the monitoring of the eluting selenium, and electrospray MS-MS for the identification of the eluted species. The presence of six compounds with molecular masses of 197, 603, 562, 584, 372 and 432 (in the elution order from reversed-phase HPLC) was identified on the basis of the selenium isotopic pattern. The identity of the Mr 197 and 432 species was confirmed, by collision induced dissociation MS, to be selenomethionine and Se-adenosylhomocysteine, respectively. The compounds with larger Mr (562, 584, 604) were demonstrated, by reaction with dithiothreitol followed by HPLC-ICP-MS and ES-MS-MS, to contain a Se–S bridge between glutathione (γGlu–Cys–Gly) and a selenocompound that did not respond in the positive ES-MS mode. The MS-MS analysis of the original compound confirmed the presence of a selenium-containing fragment that could be fragmented only at high fragmentation energies. A similar Se-containing moiety (m/z 227), resistant to collision induced dissociation, was found in the 372 compound attached to a glutamine (Gln) residue as demonstrated by MS-MS.
Introduction
Recent reports on the putative role of selenium supplementation in cancer chemoprevention directed interest of the analytical community to selenized yeast.1–3 Indeed, since the absorption, tissue distribution, and body retention of selenium are dependent on the chemical species of the element present in food and food supplements,4 methods for the separation, detection, determination and identification of selenocompounds in yeast are becoming necessary.5 Because of the poor volatility of most selenium species present in yeast, the coupling of HPLC with ICP-MS has been the primary analytical tool in these investigations.6–14Reversed-phase HPLC-ICP-MS brought into evidence the presence of a considerable number (7–20) of selenocompounds in yeast extracts,6,7,10–14 but in most of the cases their identification turned out to be impossible. Indeed, the large number of compounds potentially present makes the chromatographic purity of the signals uncertain, whereas standards necessary to match the retention times of analyte peaks are usually unavailable. The choice of standards to be synthesized cannot be made on sound premises, and even if a match of the retention time of an analyte's peak with a standard compound is achieved, it cannot be regarded as the ultimate proof of the compound's identity.
The identification problems can be addressed with a detection technique producing a signal specific of the molecule, e.g., electrospray MS.15 Its applications to Se species in biological sample extracts, however, have been extremely scarce.9–11,16–18 HPLC–ES-MS was successfully used to identify selenomethionine and two selenocysteine derivatives in garlic extracts,10,11 and selenomethionine and Se-adenosylselenohomocysteine in an enzymic yeast digest11 on the basis of the molecular mass accompanied by the agreement of the retention time of an analyte with that of a synthetic standard. An alternative analytical approach was proposed by Casiot et al.9 and McSheehy et al.18 who isolated the major selenocompounds in yeast and garlic, respectively, and identified them on the basis of the collision induced fragmentation pattern of the protonated molecular ions corresponding to the adjacent Se isotopes by ES-MS-MS.
The paucity of successful applications of ES-MS to biological samples results from its poor (in comparison with ICP-MS) detection limits and, especially, from the dramatic loss of sensitivity in the presence of matrix components. The cases reported to date have concerned only major Se compounds in samples rich in this element. Indeed, a straightforward application of the HPLC-ES-MS procedure10,11 to our yeast sample extract, in which selenium is apparently distributed fairly uniformly among a number of compounds, did not allow the detection of any selenium compound in the extract. Neither was it possible to use the alternative procedure based on a cleanup of the extract by reversed-phase HPLC followed by ES-MS-MS.9 The matrix of the collected fraction after preconcentration suppressed the ionization of the selenocompounds, or produced a noise in the ES mass spectrum in which the recognition of the Se isotopic pattern was impossible.
The research described below was carried out for the purpose of developing an analytical strategy, based on HPLC with parallel ICP-MS and ES-MS-MS detection, for examining selenium speciation in yeast. In comparison with the above cited studies, another chromatographic dimension (size-exclusion) was added to the separation side in order to improve the purity of reversed-phase HPLC peaks and thus to decrease the noise level in ES-MS. In terms of identification, controlled chemical degradation of larger selenocompounds by reduction with dithiothreitol and fragmentation of protonated molecular ions at variable collision energies were investigated.
Experimental
Instrumentation and materials
For size-exclusion (SE) chromatography a 700 × 16 mm column (Pharmacia, Uppsala, Sweden) was filled with G-75 Sephadex Gel (Pharmacia) according to the manufacturer's protocol. The sample and mobile phase were pumped with a peristaltic pump (Minipuls3, Gilson, France). Fractions were collected using an automatic fraction collector (Dynamax FC-2, France). Selenium in the effluent was monitored (off-line) using the Elan 6000 (PE-SCIEX, ON, Canada) ICP mass spectrometer fitted with a cross-flow nebulizer. Reversed-phase (RP) chromatography was performed on a waters Spherisorb (250 mm × 4.6 mm × 5 µm) (Supelco, Bellefonte, PA, USA) with on-line or off-line detection of selenium using the Elan 6000 instrument. For semi-preparative RP HPLC, the same column but with a larger diameter (10 mm) was used. Injections onto HPLC columns were carried out using a Model 7725 injection valve (Rheodyne, CA, USA) with a 100 µl or 500 µl (semi-preparative column) injection loop. A HP Model 1100 (Hewlett-Packard, Waldbronn, Germany) HPLC pump was used. The software to handle on-line HPLC-ICP-MS data was Turbochrom4 (PE-SCIEX). Electrospray MS experiments were performed using a PE-SCIEX API 300 ion-spray triple-quadrupole mass spectrometer (Thornhill, ON, Canada). Samples were introduced using a syringe pump (Harvard Apparatus, South Natic, MA, USA).The eluates were concentrated by lyophilisation using a Model LP3 lyophilizer (Jouan, France). Solid particules were removed by ultracentrifugation using a Model Hima CS 120GX (Hitachi, Tokyo, Japan) centrifuge. Water was purified to 18.2 MΩ resistance using a Milli-Q system (Millipore, Bedford, MA, USA). Acetic acid, methanol and hydrochloric acid (Signa-Aldrich, St. Quentin, France) were of analytical grade. The chromatographic mobile phases were degassed using a Branson Model 1210 ultrasonic cleaner (Danbury, CT, USA).
Procedures
![[thin space (1/6-em)]](https://www.rsc.org/images/entities/char_2009.gif) °C in an ultrasonic bath for 2 h. The 15 extracts were centrifuged (4000 rps, 30 min), decanted into a 250 ml flask, frozen and lyophilized. The dried extract was then dissolved in 7 ml of water (giving 8.2 ml of solution) and ultracentrifuged at 50000 rpm at 4°C under vacuum to remove any solid particles which may remain. The extract was stored in the fridge.
°C in an ultrasonic bath for 2 h. The 15 extracts were centrifuged (4000 rps, 30 min), decanted into a 250 ml flask, frozen and lyophilized. The dried extract was then dissolved in 7 ml of water (giving 8.2 ml of solution) and ultracentrifuged at 50000 rpm at 4°C under vacuum to remove any solid particles which may remain. The extract was stored in the fridge.
The chromatographic purity of the size-exclusion peak was verified by analytical RP HPLC–ICP-MS for fractions N°·80, 85, 90, 95 and 100 (see Fig. 1). The mobile phase was 0.3% acetic acid (pH 3) at a flow rate of 0.9 ml min−1. The ICP-MS conditions were optimized daily using the standard built-in procedure (daily check).
 | ||
| Fig. 1 Fractionation of selenium compounds in yeast extracts by size-exclusion chromatography: (a) elution of Se from a size-exclusion column monitored by ICP-MS; (b) verification of the chromatographic purity of the fractions within the major peak in Fig. 1(a) by reversed-phase HPLC-ICP-MS. | ||
000 rpm for 30 min at 4°C). 100 µl of the solution were injected on the reversed-phase column run under previous conditions, but with introduction of methanol up to 5% starting from 20 min. Fractions (450 µl each) were collected every 30 s for the total time of 45 min. An 10 µl aliquot of each fraction was diluted with 190 µl of water and analysed by ICP-MS for Se. Each fraction with high Se content was lyophilized. The freeze-dried residue was dissolved in 40 µl of 0.1 M HCl in 50% methanol and introduced into the electrospray source.
MS-MS spectra were acquired in the product ion scan mode for the ions within the Se isotopic pattern for each compound. The dwell time and step size were modified to give an approximate run time of 0.6 min for 10 scans. The collision energy was optimized daily for each species and varied between 20–35 eV. A higher collision energy (up to 80 eV) was sometimes employed to encourage fragmentation and the production of possibly new daughter ions which could provide additional structural information.
Results and discussion
Fractionation of selenocompounds in a yeast extract by SE chromatography
Water-soluble selenium in yeast accounts for ca. 10–20% of the total concentration of this element. Size-exclusion chromatography was chosen as the technique for the preliminary screening of the extract for the presence of selenium species on the basis of earlier literature reports for yeast8 and fish.9Fig. 1 shows that water-soluble selenium in a yeast extract is present in two fractions: one excluded from the column and one, low-molecular weight, eluted close to the total volume of the column. The chromatographic purity of the low molecular fraction (containing 86.6% of water-soluble Se) was verified by reversed-phase chromatography for fractions 80, 85, 90, 95 and 100 as demonstrated in Fig. 1(b). The choice of reversed-phase chromatography was dictated by the literature reports6,7,13,16 showing its high efficiency for the separation of selenoaminoacids. The reversed-phase chromatograms bring evidence of the presence of a large number of selenospecies, some of which are not retained on the stationary phase. The latter compounds are likely to be oxidation products of some Se species as indicated elsewhere.12,13 The compounds retained are likely to correspond to selenoaminoacids and oligopeptides.Quasi-identical chromatograms were obtained for all the 5 fractions analysed within the major size-exclusion chromatographic peak, proving the practical impossibility of fractionating low-molecular weight selenium species by this mechanism. Then, the fractions 75–100 were pooled (Fig. 1) and preconcentrated by freeze-drying. In order to verify the compound stability during the lyophilization, an aliquot of the resulting solution was diluted 20-fold and analysed by RP HPLC-ICP-MS. The chromatogram had a similar morphology to those shown in Fig. 1(b), confirming the absence of degradation. Note that the peaks were sharper and better distinguished from the noise after the SE chromatographic cleanup compared to when a raw extract was run (chromatogram not shown). This indicates that the cleanup step removes some matrix components that would otherwise affect the reversed-phase separation and might interfere later with electrospray ionization.
Fractionation of selenocompounds by reversed-phase chromatography
For preparative purposes, a 500 µl aliquot of non-diluted solution was run by reversed-phase HPLC. Acetic acid used as the mobile phase was found to extend the range of elution of selenocompounds in comparison with water. The principle of the separation is similar to that with the conventional trifluoroacetic acid (TFA), or with more exotic ion-pairing reagents proposed elsewhere.10,12 Acetic acid was preferred to TFA because of the better separation efficiency for the selenocompounds studied. Like TFA, acetic acid can be removed during the lyophilization step.In order to avoid missing the analysed compound in the fraction collected on the basis of the retention time, fractions (ca. 450 µl) of the eluate were collected continually throughout the whole duration of the chromatogram. The reconstructed chromatogram, shown in Fig. 2, has a similar morphology to the RP HPLC chromatograms of individual SE fractions [Fig. 1(b)], although the resolution is poorer. The selenium-containing fractions (the concentration was measured for 5 µl aliquots by ICP-MS) corresponding to peaks 2–5 were freeze-dried individually. The dissolution of the residue in 40 µl of 0.1 M HCl in 50% MeOH (mixture required for the most efficient electrospray ionization) allowed a preconcentration factor of ca. 30 to be obtained.
 | ||
| Fig. 2 Reconstructed HPLC-ICP-MS chromatogram of pooled and freeze-dried fractions 75–100 in Fig. 1. The insets show the part of the ES-MS spectra of peaks 2–5 in the chromatogram that show the characteristic Se isotopic pattern: (a) peak 2; (b) peak 3; (c) peak 4; (d) peak 5. | ||
Identification of organoselenium compounds by ES MS-MS
Electrospray mass spectra of the Se-rich fractions collected and preconcentrated from a reversed-phase HPLC column are shown in the insets (a)–(d) of Fig. 2. The spectrum of peak 1 is not shown since this fraction contains salts that suppress the signals from selenocompounds, should any of them be ionizable. Even for the retained species the ES-MS signals for selenocompounds are difficult to distinguish from the noise. The spectra were analysed in the quest of a characteristic Se isotopic pattern. As can be seen in Fig. 2, the correct isotopic pattern of selenium can be recognized for peak 2 (m/z 198 for the M + H+80Se ion), peak 3 (m/z 563 for the M + H+80Se ion), possibly peak 4 (m/z 373 for the M + H+80Se ion) and peak 5 (m/z 433 for the M + H+80Se ion).Two of the molecular masses found, 197 and 432, were previously attributed in the literature to selenomethionine11,12,15 and Se-adenosylhomocysteine,9 respectively. Their identity was confirmed here by CID of the protonated molecular ions corresponding to the adjacent Se isotopes, which enables the recognition of the characteristic fragments of Se-containing and Se-free moieties. The collision induced detection (CID) spectra (not shown) were identical with ones previously published in the literature for the above two compounds.9,18 The other two compounds produced CID spectra for the adjacent major selenium isotopes (Fig. 3) confirming the presence of Se fragments in the MS-MS spectra. Note that for the 372 compound [Fig. 3(b)] it can be considered as a proof of the presence of Se, which is rather ambiguous in the MS spectrum.
 | ||
| Fig. 3 Collision induced dissociation MS spectra of the peaks in the chromatogram in Fig. 2 containing previously unreported selenium compounds: (a) peak 3; and (b) peak 4. Top panels are mass spectra corresponding to the 78Se isotope. Bottom panels are mass spectra corresponding to the 80Se isotope. Peaks corresponding to Se- containing fragments are highlighted in bold. | ||
The MS-MS spectrum of the M + H+ ions at 561 and 563 [Fig. 3(a)] contains a number of Se-containing fragments (highlighted in bold in the figure). The presence of several aminoacids suggests that a peptide structure can be seen. The interpretation of the spectrum is difficult and indicates a more complex structure than a straight selenopeptide.
The most intense peak correponds to the loss of 307 u. This, accompanied by finding terminal glycine (Gly) (−74 u, m/z 488), glutamic acid (Glu) (−129 u, m/z 434) and glutamic acid–cysteine (Glu–Cys) dipeptide (−232 u, m/z 331) residues in the spectrum, makes the hypothesis of the presence of γ-glutathion rather well documented. The only possible explanation for incorporation of selenium would then be via the -SH group of cystein. This can be confirmed by the presence of a Glu–Cys–(Se)–Gly fragment at m/z 386 (78Se). Such a hypothesis would account for the presence of the m/z 130 peak (Glu + H+) and 313 (331–H2O) peak and indicates the presence of a selenium-containing moiety, resistant to fragmentation, forming a Se–S bridge with the -SH cysteine group of the glutathion.
An insight into the association between the fragments that could give some clue to the compound structure can be obtained by fragmentation with different collision energies. The relevant set of mass spectra is shown in Fig. 4. The collision energy was changed every 5 eV in the 25–80 kV range but the spectra (not shown) do not give any novel information.
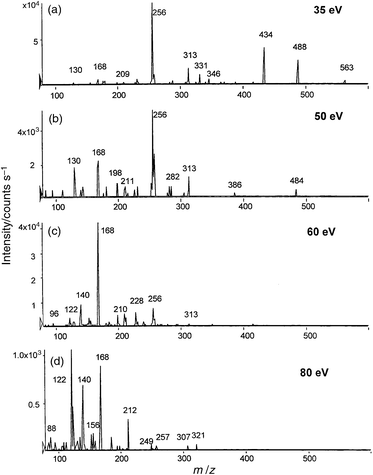 | ||
| Fig. 4 CID MS-MS fragmentation of the m/z 563 peak at the different fragmentation energies: (a) 35 eV; (b) 50 eV; (c) 60 eV; (d) 80 eV. | ||
The spectra allow the conclusion that the degradation of the Se-containing moiety occurs via the loss of a Se-free stable 88 u moiety, leading to a Se-containing fragment of Mr 168. Still higher energies lead to the formation of two ions of 140 u and 122 u (140–H2O) that are fragmentations of the m/z 168 peak and are therefore likely to contain selenium. Note that the reduced intensity of peaks at the higher collision energies is due to the poorer ion transport under these conditions.
The fragmentation of the pair of ions at m/z 371 and 373 [Fig. 3(b)] gives two pairs of Se-containing fragments: 225/227 and 353/355. The analysis of these mass spectra reveals the loss of water, 373 → 355, and the loss of the amide of glutamic acid, glutamine (Gln), identified owing to its characteristic m/z 84, 101, and 129 fragments. The amide is bound to a stable Se-containing moiety that is too stable at higher fragmentation energies to be a peptide.
Note that the ultimate proof of the existence of the Se–S bridge, which is important for the understanding of the compound's structure, is still missing. Therefore, it was decided to examine the species' stability against reducing reagents, such as dithiothreitol (DTT).
Stability of the selenocompounds against reducing reagents
In order to confirm the presence of glutathion bound via the -SH cysteine group, the fraction containing the Mr 562 species was divided in two parts, one of which was incubated with 5 mM solution of DTT. The incubated and non-incubated fractions were investigated by ES-MS-MS and by RP HPLC-ICP-MS.Fig. 5(a) shows that the Mr 562 compound disappears in the fraction to which DTT has been added, liberating a species with m/z 308 [Fig. 5(b)], which is confirmed by CID to be γ-glutathione (the fragmentation pattern is given in the inset). However, no (562 − 307) +H+ species appears, which leads to the conclusion that the Se-containing reaction product is either not ionized in the ES source, or it undergoes spontaneous oxidation or decomposition with eliminationof Se.
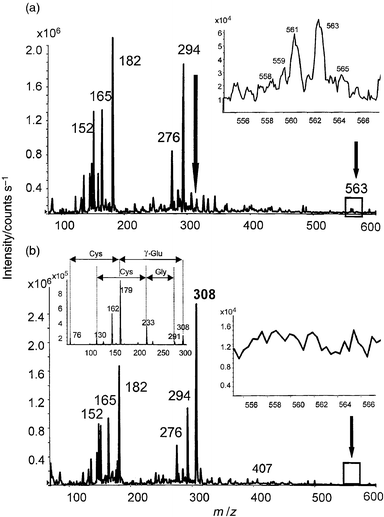 | ||
| Fig. 5 Electrospray MS-MS spectra of the fraction containing the m/z 563 peak (peak 3 in Fig. 2): (a) untreated fraction; and (b) fraction treated with DTT. The insets contain a zoom of the vicinity of the protonated molecular ion peak. Fragmentation of the 308 peak arising after the treatment with DTT is given in the inset of Fig. 5(b). | ||
Analytical reversed-phase HPLC-ICP-MS (Fig. 6) demonstrates that the fraction investigated actually contains not onebut at least three different compounds with similar physicochemical properties. The addition of DDT results in the formation of a similar series of more hydrophobic compounds. These data corroborate our hypothesis of the existence in yeast of a number of glutathione S-conjugates with selenocompounds. The following attempts focused on the identification of the origin of the three peaks in HPLC-ICP-MS (Fig. 6).
 | ||
| Fig. 6 Analytical reversed-phase chromatogram of the fraction containing the m/z 563 peak (peak 3 in Fig. 2): bold line is untreated fraction; and dotted line is fraction treated with DDT. Signal identification (cf.Fig. 7): 1 - compound with Mr 603; 2 - compound with Mr 562; and 3 - compound with Mr 584. | ||
Electrospray MS-MS analysis of glutathione S-conjugates with selenocompounds
The chromatography discussed in Fig. 6 was repeated by collecting 30 -s fractions for further analysis by ES-MS-MS. A chromatogram (not shown) was reconstituted off-line by analysing a 5 µl aliquot of each fraction. The individual fractions were preconcentrated by freeze-drying followed by dissolution of the residue in 10 µl of acidified methanol and analysis by ES-MS-MS. Fig. 7 shows ES-MS and MS-MS spectra of two novel (other than Mr 562) Se-containing compounds: one in the front peak in Fig. 6 [Fig. 7(a)] and one in the last peak in Fig. 6 [Fig. 7(b)]. Both CID mass spectra contain a number of Se-containing fragments highlighted in bold, of which the peaks differed by two mass units when protonated molecular ions corresponding to the 78Se and 80Se isotopes were fragmented. The mass spectra of the middle peak in Fig. 6 corresponded to the previously discussed compound with Mr 562. | ||
| Fig. 7 ES MS-MS of compounds producing peaks in Fig. 6: (a) compound with Mr 584; and (b) compound with Mr 603. The insets contain the zoomed range of the protonated molecular ion peaks in the MS spectra (80Se). | ||
The CID mass spectrum of the Mr 584 compound is very similar to that of the Mr 562 species shown in Fig. 3(a). All the fragments correponding to the presence of the Glu–Cys–Gly moiety can clearly be seen. However, the molecular masses of the fragments are 22 u higher which indicates that the CID resistant, Se-containing moiety represents a species larger by 22 mass units.
The spectrum of the Mr 603 compound also contains several signals corresponding to losses of Glu, Cys, and Gly, but glycine does not seem to be terminal. A peak suggesting the loss of 307 u is present but the presence of glutathione cannot be proven on the basis of the existing fragments. It should be noted that the concentration of this compound is lower than that of the others and the quality of the MS-MS spectrum is poorer. Also, although the reduction with DTT destroys the compound, no analogue of the Mr 563 and 584 species is seen in the HPLC-ICP-MS chromatogram after reduction with DTT (Fig. 6). This may suggest that, in addition to a Se–S bridge, an S–S bridge is also present, resulting in a more complex structure.
Conclusions
Electrospray tandem mass spectrometry is an attractive technique to alleviate the shortcomings of HPLC-ICP-MS in terms of identification of peaks shown in chromatograms of selenized yeast extracts. Because of its poorer detection limits, it is essential that it is preceded by multidimensional chromatographic purification for the elimination of other matrix components, thus allowing high preconcentration factors to be obtained by lyophilization. However, molecular mass and CID-MS fragmentation patterns alone seem to be insufficient to allow a complete identification of the compounds discovered, especially if they have never been reported before. Their isolation prior to chemical reduction or enzymic cleavage approaches seem to be necessary for their unambiguous identification. It should be emphasized that the compounds were identified in aqueous extracts. The presence of enzymes in the extracting solution is likely to degrade the water-soluble species and to release degradation products of water-insoluble selenoproteins.Acknowledgements
The authors thank Dr. Hubert Chassaigne (IRMM, Geel, Belgium) for the critical reading of the manuscript and valuable discussion.References
- C. Ip, D. J. Lisk and G. S. Stowesan, Nutr. Cancer., 1992, 17, 279 Search PubMed.
- L. C. Clark, G. F. Combs, B. W. Turnbull, E. H. Slate, D. K. Chalker, J. Chow, L. S. Davis, R. A. Glover, G. F. Graham, E. G. Gross, A. Kongrad, J. L. Lesher, H. K. Park, B. B. Sanders, C. L. Smith and J. R. Taylor, J. Am. Med. Assoc., 1996, 276, 1957 Search PubMed.
- D. G. Barceloux, J. Toxicol. Clin. Toxicol., 1999, 37, 145 CAS.
- J. W. Finley, J. Agric. Food Chem., 1998, 46, 3702 CrossRef CAS.
- R. Lobinski, J. S. Edmonds, K. T. Suzuki and P. C. Uden, Pure Appl. Chem., 2000, 72, 447 Search PubMed.
- S. M. Bird, H. Ge, P. C. Uden, J. F. Tyson, E. Block and E. Denoyer, J. Chromatogr., A, 1997, 789, 349 CrossRef CAS.
- S. M. Bird, P. C. Uden, J. F. Tyson, E. Block and E. Denoyer, J. Anal. At. Spectrom., 1997, 12, 785 RSC.
- C. Casiot, J. Szpunar, R. Lobinski and M. Potin Gautier, J. Anal. At. Spectrom., 1999, 14, 645 RSC.
- C. Casiot, V. Vacchina, H. Chassaigne, J. Szpunar, M. Potin-Gautier and R. Lobinski, Anal. Commun., 1999, 36, 77 RSC.
- M. Kotrebai, M. Birringer, J. F. Tyson, E. Block and P. C. Uden, Analyst, 2000, 125, 71 RSC.
- M. Kotrebai, M. Biringer, J. F. Tyson, E. Block and P. C. Uden, Anal. Commun., 1999, 36, 249 RSC.
- M. Kotrebai, J. F. Tyson, E. Block and P. C. Uden, J. Chromatogr. A, 2000, 866, 51 CrossRef CAS.
- P. C. Uden, S. M. Bird, M. Kotrebai, P. Nolibos, J. F. Tyson, E. Block and E. Denoyer, Fresenius' J. Anal. Chem., 1998, 362, 447 CrossRef CAS.
- J. Zheng, W. Goessler and W. Kosmus, Trace Elements Electrol., 1998, 15, 70 Search PubMed.
- H. Chassaigne, V. Vacchina and R. Lobinski, Trends Anal. Chem., 2000, 19, 300 CrossRef CAS.
- H. M. Crews, P. A. Clarke, D. J. Lewis, L. M. Owen, P. R. Strutt and A. Izquierdo, J. Anal. At. Spectrom., 1996, 11, 1177 RSC.
- M. Kotrebai, S. M. Bird, J. F. Tyson, E. Block and P. C. Uden, Spectrochim. Acta, Part B, 1999, 54B, 1573 CrossRef CAS.
- S. McSheehy, W. Yang, F. Pannier, J. Szpunar, R. Lobinski, J. Auger and M. Potin-Gautier, Anal. Chim. Acta, 2000, 421, 147 CrossRef CAS.
Footnote |
| † On leave from: Department of Analytical Chemistry, Technical University of Wrocław, 50-370 Wrocław, Poland |
| This journal is © The Royal Society of Chemistry 2001 |