Influence of environmental parameters on the accuracy of nitrogen dioxide passive diffusion tubes for ambient measurement
Carolyn
Kirby†
a,
Malcolm
Fox
b,
John
Waterhouse
a and
Tim
Drye
c
aEnvironmental Sciences
Research Centre, Anglia Polytechnic University, Cambridge, UK CB1
1PT
bDepartment of Chemistry, De
Montfort University, Leicester, UK LE1 9BH
cDataTalk (Statistical Solutions)
Ltd, 1a George Street, Huntingdon, UK PE18 6AD
First published on 11th December 2000
Abstract
Two studies at three sites in the UK provided confirmation that systematic positive bias in NO2 diffusion tube measurement occurred because of changes to “within-tube” chemistry, rather than eddy diffusion at the mouth of the tube. In the first study in Cambridge, UK, sampler overestimation for 1 and 2 week exposures was compared to corresponding time-averaged monitor measurements (NO–NO2–NOx, O3) and weather variables. Nonlinearity between sampler and monitor NO2 measurements was interpreted in terms of spatial and temporal variations in relative and absolute availability of NO, NO2 and O3 at the site. A maximum overestimation occurred for an exposure mean NO2/NOx ∼ 0.5. The separate contributions of reduced NO2 photolysis and eddy diffusion were compared in Study II using samplers of two materials, acrylic and quartz, and of different lengths (40, 55, 71 and 120 mm) at three sites: Norwich background, Cambridge intermediate, London kerbside. For compared sites, NO2 measured by acrylic samplers was significantly higher than for equivalent quartz samplers. For quartz samplers [NO2]mean was only just above the monitor at Norwich and London; sampler/monitor NO2 = 1.04 (P = 0.59) and 1.01(P = 0.76), respectively. For acrylic samplers the order of [NO2]mean was 40 mm > 120 mm > 71 mm ≥ 55 mm. Excepting 40 mm samplers, this accords with a chemical bias where co-diffusing NO and O3 molecules in longer tubes have more time to react to form excess NO2. Bias in 40 mm samplers is discussed. Eddy diffusion is negligible for standard samplers because [NO2]mean was equivalent for 55 mm and 71 mm acrylic samplers and close to monitor NO2 for 71 mm quartz tubes. Both studies showed that sampler accuracy was dependent on location. Significantly, overestimation was greatest (∼3–4 ppb) where the NO2 annual mean was ∼20 ppb, close to the UK and EU air quality standard of 21 ppb.
Introduction
Nitrogen dioxide (NO2) is a key urban pollutant for which routine review and assessment is required by local authorities in the UK under the terms of the Environment Act 1995. Passive diffusion tubes are widely used for ambient NO2 measurement to determine the extent of polluted zones1,2 and for comparison with national and international air quality standards.3,4 Unfortunately, validation of the technique for outdoor use is incomplete and uncertainties remain regarding its accuracy and reliability for air quality assessment.5–8In a recent paper,9 we have identified a source of inaccuracy arising from differences in sampler preparation methods and advised the adoption of a universal standard method to eliminate this type of error. However, removal of systematic biases, as reported in previous outdoor studies,5–8 is more problematical. These sources of bias need to be clarified and their influence on sampler accuracy assessed for different sampling conditions. For instance, trials in rural areas have shown good agreement with the reference chemiluminescence technique10,11 but urban studies have found significant overestimation of NO2 concentrations.5,7,8,12 Two studies have also found an aging effect whereby NO2 uptake declined as sampler exposure time increased.7,8 The reason for this loss is not known but may be due to limitations in adsorbent capacity or photolytic degradation of bound nitrite. Incomplete conversion of NO2 gas to nitrite at the triethanolamine surface may also contribute to the aging effect.
One approach to “correcting” sampler NO2 uptake for these conflicting biases might be to use an effective sampling rate, based on laboratory tests with standard NO2 atmospheres. This would avoid errors incurred by using the theoretical equation based on Fick's diffusion law. However, it will be shown that positive bias in outdoor sampler measurement is a consequence of constantly changing environmental variables. Apart from the difficulties of reproducing these conditions in laboratory experiments, this implies that the sampling rate would vary according to atmospheric conditions.
Two potential sources of environmental interference have been proposed to explain positive bias in NO2 measurement. Firstly, eddy diffusion caused by air turbulence at the entrance to the sampling tube could lead to a shortening of the diffusion path.5,6 Secondly, attenuation of UV radiation through the acrylic walls could reduce daytime photolysis of NO2 molecules diffusing along the sampler.13 Reaction between co-diffusing NO and O3 molecules continues, causing excess NO2 formation at the absorbent. A model of sampler diffusion, incorporating changes to “within-tube” chemistry, has been developed by Heal and Cape.13 This has been applied to monitoring data from two independent studies in Edinburgh7 and Cambridge.8 In both studies, modelled NO2 and sampler NO2 measurements were in good agreement, indicating that reduced NO2 photolysis accounted for most of the excess NO2 recorded by the acrylic samplers. However, wind-turbulence could not be ruled out as an additional source.
The influence of environmental sampling conditions on the accuracy of NO2 diffusion tubes is explored in this paper using data from two separate studies: the Cambridge study8 mentioned above and a three-centre study in London, Cambridge and Norwich. Both investigate the respective contributions of eddy diffusion and “within-tube” chemistry to excess NO2 formation in acrylic samplers. Results provide strong support for “within-tube” chemistry, showing how excess NO2 formation in acrylic samplers is modified by spatial and temporal changes in sampling conditions. Relevant environmental measurements taken over the study periods include weather parameters and pollutants (NO, NO2, NOx and O3), obtained as continuous hourly mean measurements and averaged over corresponding sampler exposure times.
Experimental
Sampler preparation, deployment and analysis have been reported previously,9 together with the monitoring sites relevant to this paper. Sampling protocols for the two studies are described below; neither has been previously reported.Study I. Cambridge
At this urban intermediate site, situated 20 m from a main road, NO2 measurements by standard length (71 mm) acrylic diffusion tubes were compared to those from chemiluminescence over 22 months. A concurrent time–exposure comparison of 1, 2 and 4 week acrylic samplers took place over 11 months of this long-term study. The Cambridge monitoring site was equipped with gas analysers for NO–NO2–NOx and O3, located at ground level, and a roof-top weather station (height = 10 m). Pollutant and weather parameters were collected and stored as continuous hourly mean measurements. Statistical analyses of data sets were performed using MINITAB version 10.5 for Windows.In the long-term study consecutive 2 week exposures of two replicate samplers, placed on the inlet arm of the monitoring station, were obtained over 22 months commencing March 1995. Two additional samplers were placed within the rain hood protecting the inlet, concurrent with these exposures, for a period of 17 months. The open ends of the tubes were level with the bottom edge of the hood to allow free movement of air whilst sheltering the samplers from wind turbulence. Data from the 4 sampler positions was without loss over these periods but the chemiluminescence data was only available for approximately 17 months out of the 22 month survey because of discontinuities in operation.
The time–exposure study consisted of sampler exposures over consecutive 4 week periods between February and November 1996. For this study the samplers were located on holders spaced at 100 mm intervals along a horizontal baton, fixed behind the hood of the monitoring inlet. The baton was parallel to the road so that exposed samplers were equidistant from the traffic emission source. For each 4 week period, 14 samplers were deployed as follows: 2 samplers exposed for 4 weeks (weeks 1–4); 4 samplers exposed for 2 week periods (2 each for weeks 1–2, 3–4); 8 samplers exposed for 1 week periods (2 each for weeks 1, 2, 3 and 4).
For the duration of this study the 2 week samplers also contributed to the long-term dataset, replacing the samplers attached directly to the monitoring inlet arm. Hence, 6 samplers were located beside the monitor inlet at any one time and a 96% return was achieved on all duplicate samplers. Reported data were the means of duplicate measurements. The 6 sampler positions were changed each week using a randomised layout to avoid any bias due to position. Sampler exchanges took place at the same time each week so that exposure times were exact multiples of 168 h (1 week). Both sites were well protected from vandalism and losses were therefore minimal. Collected samplers were sealed and stored at low temperature in polythene bags and analysed at the end of each 4 week period. Storage time before and after exposure was minimised to avoid contamination and for consistency of procedures. For each 4 week set, 2 unexposed samplers were retained as blanks for laboratory analysis.
Study II. London, Cambridge and Norwich
Wind-driven turbulence as a cause of NO2 overestimation was examined, as it has been elsewhere,5,6 by varying the length of the diffusion tubes [40 mm, 55 mm, 71 mm (standard length) and 120 mm]. If eddy diffusion contributed to overestimation then the reduction in the diffusion path length would be of the same magnitude for all samplers, irrespective of their overall length. This would have the greatest proportional effect on enhanced NO2 uptake for the shortest tubes, reducing as the tube length increased (i.e. the shortest tubes would record the highest NO2 concentrations). There would also be no difference in NO2 measured by acrylic and quartz tubes of the same length.
To determine whether reduced NO2 photolysis contributed to sampler overestimation, two sets of samplers were deployed composed of two different materials: acrylic (UV-blocking) and quartz (UV-transmitting). Heal and Cape13 have estimated that quartz tubing transmits ∼90% of light of wavelengths appropriate to NO2 photolysis, compared with only ∼20% light transmission for acrylic tubing. A chemical overestimation would therefore be indicated by higher NO2 concentrations for acrylic than for corresponding quartz samplers. In addition, greater overestimation by the longest acrylic sampler, 120 mm, would occur compared to shorter lengths because of the extra time available for co-diffusing NO and O3 molecules to react to form excess NO2. For quartz samplers this would cause little or no difference in accumulated NO2 for different tube lengths because NO2 photolysis was taking place. However, some excess NO2 might form as UV transmission through quartz would be <100% and this might show a length dependence. This experimental design should identify and distinguish between the two potential causes of bias and also determine whether location is a key factor.
Cambridge: Winter, 8 sets, December 1997–March 1998; Summer, 6 sets, March–August 1998.
Norwich: Summer, 7 sets, March–June 1998 terminated because of access changes.
London: Summer, 9 sets, March–August 1998.
In Study II gas analyser measurements were only available at the Norwich and Marylebone Road sites.
As the study was concerned with very small differences between groups of samplers, measurements for each type and length were obtained in triplicate. Calculation of the NO2 concentrations from extracted nitrite masses10 took account of changing tube dimensions (length and cross-sectional area) in accordance with the following expression derived from Fick's diffusion law:
 | (1) |
Tube dimensions were determined as mean measurements obtained for each group used in the study, by material and length.
The use of replicate tube arrays9 has been validated by the authors to show that samplers record equivalent NO2 measurements. As in the earlier time–exposure study (Study I), parallel batons were positioned close to monitor inlets with samplers spaced at 100 mm intervals. Each exposure set comprised 18 samplers: 3 each of 40 mm, 71 mm and 120 mm acrylic and 40 mm, 71 mm and 120 mm quartz samplers. Sets at the Norwich and Marylebone Road sites also included 3 each of 55 mm acrylic samplers.
Precision of replicate measurement
In both studies precision, determined as the relative standard deviation (RSD) of replicate measurements, compared favourably with reported precision from previous studies in Cambridge9 and elsewhere.5,10 For Study I, the long-term mean precision was 3.8% (n = 41) for 2 week exposures outside the monitoring inlet (DTOUT) and 3.9% (n = 33) for samplers inside the inlet hood (DTIN). Reproducible NO2 measurements were also indicated by high correlations between replicates at each position: r = 0.89 for both DTOUT and DTIN. The RSD of the difference in replicate measurements was 1.6 ppb and 1.4 ppb for DTOUT and DTIN, respectively. Paired Student t-tests indicated there was no difference in NO2 measured by replicates at the same position so a mean reading was used for subsequent analyses. For Study II mean precision is reported in Table 2 (see below), by type and length of sampler. For both acrylic and quartz samplers, at all lengths, the mean precision was acceptably low at <10% (RSD).Results and discussion
Accuracy of NO2 diffusion tube measurement was determined by comparing sampler and equivalent time-averaged chemiluminescence monitor measurements. Sampler/monitor NO2 ratios (S/MNO2) provided a measure of the difference between the two techniques and the degree of over- or underestimation by the diffusion tubes. The effects of other variables, both pollutant and weather, was determined by comparing concurrent time-averaged measurements to the corresponding S/MNO2 values. This approach has assumed that the reference technique was itself free from error and this may not have been valid for all conditions. However, sources of bias discussed in Heal et al.8 are thought to be small for UK conditions. In any case the most significant source, over-reading due to interference from peroxyacetylnitrate and nitrous acid, would affect both sampling techniques in the same way.Study I. Comparison of exposed and sheltered 2 week samplers
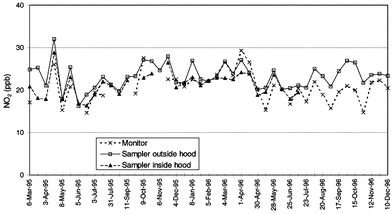 | ||
| Fig. 1 Time series of 2 week NO2 exposures measured by chemiluminescence monitor and diffusion tubes in exposed and sheltered positions. Diffusion tube data are the means of duplicate measurements. | ||
Paired t-tests of the difference of means found a very highly significant difference for exposed samplers and monitor (P = 0.0005) but no significant difference for sheltered samplers and monitor (P = 0.614). In addition, the two sets of sampler data were very well correlated with each other (r = 0.84, n = 33), but paired t-tests showed a very highly significant difference of means (P = 0.0005).
Other weather parameters, mean temperature and solar radiation, were also compared to S/MNO2, but no significant correlations were found. However, lack of a relationship may reflect inappropriate weather measurements, as time-averaged parameters provided only a gross approximation to actual conditions. Air flows at ground-level would be reduced by frictional drag and surface roughness features, such as vegetation and buildings,14 and might not be adequately represented by wind flows measured at a height. Therefore further investigation was needed of the wind turbulence contribution to enhanced NO2 uptake by samplers.
Study I. Influence of other pollutant measures on sampler NO2 measurement
For the 1 week data, less affected by the second bias of time-dependent loss of NO2,8 nearly all data points lay above the line of 1∶1 correspondence. However, there was considerable variation in the extent of overestimation by the samplers (mean = 1.24; range = 0.95–1.73). As with the 2 week data, there was a tendency for sampler data at the upper end of the NO2 range (>23 ppb) to be closer to the monitor NO2.
It was found that linear regression applied to the 1 and 2 week datasets gave large positive intercepts on the sampler NO2 axis when monitor NO2 = 0 ppb. A quadratic fit, indicating a non-linear sampler–monitor relationship, might have been more appropriate but it was concluded that regression analysis was inappropriate for the limited data range.
 | ||
| Fig. 2 Correlations between sampler/monitor NO2 ratios and monitor NO2 for sampler exposures: (a) 1 week; (b) 2 week; (c) 2 week, summer; and (d) 2 week, winter. The line of equal sampler/monitor correspondence is included. | ||
These findings gave support to “within-tube” excess NO2 formation, a source which was sensitive to relative and absolute ambient concentrations of the reactants, NO and O3. In Fig. 2, exposure mean NO2 concentrations in the range 15–20 ppb were indicative of a daytime atmosphere where both NO and O3 were available to react to form excess NO2 within the diffusion tube. (This was supported by statistical modelling15 of the automated hourly NO2, NO and O3 datasets.) Conversely, raised NO2 concentrations at this site were associated with increased levels of NOx (NO + NO2) from nearby traffic emissions. This most frequently occurred in winter when dispersion was inhibited by greater atmospheric stability, and NO2/NOx ratios tended towards values associated with tailpipe emissions16 (∼0.2). A consequence of increased NOx concentrations was that available O3 in the roadside atmosphere was rapidly depleted through reaction with NO, inhibiting excess NO2 formation within samplers. This effect was shown by S/MNO2 approaching unity at higher [NO2]. Lack of O3 availability in winter was also a consequence of reduced photochemical activity, with lower mean [O3] than in summer.17
At lower concentrations, [NO2] < 5 ppb, typifying rural conditions remote from NOx emission sources, lack of NO in the atmosphere could also inhibit the NO + O3 reaction in the sampler.8 Hence, excess NO2 formation within exposed samplers will not take place at either low or high [NO2] when the atmosphere becomes NO-limited or O3-limited, respectively. This implies that, whilst linear regression lines are depicted in Fig. 2 to show trends, a nonlinear relationship is probably more valid. Indeed, 2 week ratios in Fig. 2 are actually below unity at higher NO2 concentrations. This may well reflect loss of absorbed NO2, the opposing systematic bias to that previously described and largely absent in 1 week exposure data, Fig. 2(a). It appears that samplers can both over- and underestimate ambient NO2 concentrations, depending on length of exposure and proximity to NOx emission sources. This implies that accuracy is both highly variable and dependent on monitoring location.
These seasonal differences in correlations also appear for sheltered samplers, Figs. 2(c)–(d), indicating that samplers have responded in a similar manner to unprotected samplers. This accords with a reduced NO2 photolysis occurring in all acrylic samplers used in these trials, irrespective of whether sheltered or not.
Heal et al.8 have shown that NO, NO2 and O3 interactions at this site provide for maximum “modelled” excess NO2 formation within samplers. The variation in relative and absolute concentrations of NO, NO2 and O3 over short timescales is maximised at this location, as highlighted by a principal components model of the NO2–NOx–O3 system derived from the hourly monitoring data.15 It is expected that a seasonal influence on sampler accuracy would be less obvious for sampler data from background or kerbside sites which were further from, or closer to, NOx emission sources.
 | ||
| Fig. 3 Correspondence of the sampler/monitor NO2 ratio to the NO/NO2 ratio in summer, (a) and (c), and to the O3/NO2 ratio in winter, (b) and (d), for 1 and 2 week exposures, respectively. | ||
Examination of these ratios gives insight into the nature of NO2 overestimation but their utility as correction factors is limited, necessitating the use of gas monitors to obtain accurate NO2, NO and O3 concentrations and thus making diffusion tubes redundant.
Study I. Effect of different protective screens on NO2 uptake by samplers
In Fig. 2(b)–(d) there is an almost constant difference in NO2 measured by exposed and sheltered samplers, which is independent of NO2 concentration and must therefore have a different origin. The mean absolute difference in NO2 concentration is 1.94 ppb or 8.7% of the mean of DTIN and DTOUT data sets. Eddy diffusion occurring at the mouth of exposed samplers could be indicated by this difference. Alternatively, the difference could be explained by a stagnation of the air under the inlet hood, reducing NO2 uptake by protected samplers. Both of these explanations would be independent of ambient NO2 concentration. However, given the open aspect of the monitoring site, air stagnation is not seen as a likely cause. Differences of UV transmittance for samplers in the two positions is also unlikely, as the Edinburgh study7 found no significant difference in NO2 measured by standard and foil-wrapped samplers: both were UV-blocking.A third explanation is proposed for the difference between NO2 uptake by exposed and sheltered samplers, based on a short study using different types of protective screen. Emissions from traffic are subject to both dilution (through transport and mixing) and chemical reaction, taking place through time and space as air moves away from the roadside. Daytime concentrations of NO, NO2 and O3 are controlled predominantly by the reactions of the photostationary state equilibrium.17 Close to the roadside this equilibrium is continually perturbed by fresh NOx emissions. However, as air moves away from the roadside, both dilution and chemical reaction cause changes in pollutant concentrations. Eventually, at a sufficient distance from emission sources, background concentrations of NO, NO2 and O3 are attained. In fact, the results from a spatial NO2 study in Cambridge1 and from other studies16 show that background NO2 concentrations are often achieved at a short distance from the roadside, ∼20 m.
The placing of a barrier near the mouth of the sampler will impede the natural air flow, creating extra turbulence and delaying entry into the tube. This additional mixing and time delay allows further dilution and chemical reaction of the polluted air before reaching the sampler. On average then, the protected sampler receives air which is closer to a background state of equilibration than for an identical unprotected sampler. If the sampler has maximum protection, while still being in contact with the free atmosphere, the NO2 recorded may approach that of local background. If the degree of screening is less, sampler NO2 will lie between that of an equivalent unprotected sampler and the background concentration.
This explanation is supported by the results of a short-term trial reported in Table 1. For equivalent exposures well-protected samplers, placed within a miniature Stevenson screen next to the inlet at the Cambridge site, recorded the same [NO2] as samplers at an urban background site. At the same time [NO2] recorded by samplers on the monitor inlet, protected by simple plastic mesh surrounds, was slightly lower than for unprotected samplers. For samplers under the monitor hood, [NO2] was even lower. The order of measured [NO2] can be seen as reflecting the level of protection of the samplers. However, for samplers exposed at the urban background site, no difference was found in [NO2] recorded by unprotected samplers and those protected by the plastic mesh surrounds (Table 1). In the well-equilibrated atmosphere at the background site, well away from direct sources of NOx emissions, no further reduction in [NO2] is expected. Despite the brevity of the survey (four consecutive 2 week exposures), these results give support to a process of dynamic change taking place at near-road locations, which leads to lower NO2 levels for sheltered diffusion tubes.
| Location | Exposure dates | |||
|---|---|---|---|---|
| 20/11/95–4/12/95 | 4/12/95–18/12/95 | 18/12/95–8/01/96 | 8/1/96–22/1/96 | |
| a All positions, except roadside, are the means of duplicate tubes; NO2 concentrations in ppb. | ||||
| East Road monitor— | ||||
| Outside hood | 28.0 | 21.9 | 21.9 | 27.1 |
| Inside hood | 26.6 | 20.8 | 21.7 | 23.1 |
| Outside, mesh-screened | 27.1 | 21.2 | 20.9 | 25.3 |
| Inside Stevenson screen | 21.0 | 17.3 | 16.8 | 20.2 |
| East Road kerbside | 38.8 | 31.2 | 29.4 | 32.6 |
| Urban background— | ||||
| Unsheltered | 23.3 | 17.5 | 16.0 | 23.1 |
| Mesh-screened | 23.2 | 17.8 | 16.6 | 24.4 |
In the long-term survey, NO2 concentrations from the samplers under the monitor hood appeared to be closer to the corresponding monitor NO2 values. If the explanation presented above is valid, sheltered samplers will not provide greater accuracy of measurement. In fact, external protection may not be advisable, as it may alter the composition of the air being sampled. The extent of change will depend on the type of screen used and the proximity to direct sources of NOx emissions. Other studies in the UK12 and elsewhere2 provide evidence of this variability in wind-protected samplers, underestimating by ∼10% on average compared to monitor measurements.
One implication of a “within-tube” chemical bias in sampler NO2 measurement is that overestimation only takes place during daylight hours. After sunset, NO2 photolysis ceases and the chemistry of NO and O3 within the diffusion tube is equivalent to that taking place in the ambient atmosphere. This suggests that diffusion tubes act as efficient monitors during the night hours and has important implications for indoor monitoring, where NO2 photolysis is also absent. Diffusion tube measurements indoors should be more comparable to NO2 concentrations by chemiluminescent monitors.
Study II. Comparison of eddy diffusion and “within-tube” chemistry as sources of excess NO2 in diffusion tube measurement
For the sites in the 3-centre study there were no losses of samplers, although a small number (<3%) were found to be defective during laboratory analyses. Reported data were the means of triplicate measurements except where only duplicate sampler measurements were available.| Site | Monitor | Acrylic tubes | Quartz tubes | |||||
|---|---|---|---|---|---|---|---|---|
| 120 mm | 71 mm | 40 mm | 55 mm | 120 mm | 71 mm | 40 mm | ||
| a NO2 concentrations are quoted in ppb. | ||||||||
| Cambridge— | ||||||||
| Winter mean (8 sets) | 24.4 | 23.2 | 30.1 | 25.3 | 24.7 | 32.2 | ||
| Summer mean (6 sets) | 21.3 | 18.4 | 17.9 | 17.5 | ||||
| RSD (%) (all sets) | 2.6 | 5.3 | 5.9 | 6.2 | 6.4 | 6.9 | 8.1 | |
| Marylebone Road— | ||||||||
| Mean of 8 sets | 44.7 | 51.2 | 46.7 | 47.6 | 46.3 | 45.2 | ||
| Mean of 5 sets | 44.4 | 49.5 | 45.4 | 53.4 | 46.2 | 44.0 | 42.2 | 52.3 |
| RSD (%) (all sets) | 2.1 | 4.1 | 3.4 | 6.9 | 5.6 | 3.9 | 5.7 | |
| Norwich— | ||||||||
| Mean of 6 sets | 10.4 | 12.6 | 11.6 | 13.0 | 11.7 | 10.8 | 10.6 | 12.1 |
| RSD (%) | 3.0 | 4.4 | 5.9 | 4.2 | 6.0 | 6.3 | 5.7 | |
| Tube length | A/Q | |
|---|---|---|
| Winter | Summer | |
| 120 mm— | ||
| No. of observations | 8 | 6 |
| Mean A/Q ratio and 95% confidence interval | 0.97 ± 0.14 | 1.21 ± 0.14 |
| Significant paired t-test difference: P-value | 0.239 | 0.009 |
| Correlation (r) | 0.95 | 0.87 |
| 71 mm— | ||
| No. of observations | 8 | 6 |
| Mean A/Q ratio and 95% confidence interval | 0.94 ± 0.06 | 1.07 ± 0.12 |
| Significant paired t-test difference: P-value | 0.041 | 0.203 |
| Correlation (r) | 0.92 | 0.77 |
| 40 mm— | ||
| No. of observations | 8 | |
| Mean A/Q ratio and 95% confidence interval | 0.94 ± 0.006 | |
| Significant paired t-test difference: P-value | 0.136 | |
| Correlation (r) | 0.66 | |
| Ratio of diffusion | Acrylic/acrylic | Quartz/quartz | ||
|---|---|---|---|---|
| Winter | Summer | Winter | Summer | |
| 120 mm/71 mm— | ||||
| No. of observations | 8 | 6 | 8 | 6 |
| Mean ratio and 95% confidence interval | 1.05 ± 0.03 | 1.15 ± 0.08 | 1.02 ± 0.04 | 1.02 ± 0.07 |
| Significant paired t-test difference: P-value | 0.007 | 0.004 | 0.351 | 0.448 |
| Correlation (r) | 0.98 | 0.96 | 0.97 | 0.98 |
| 120 mm/40 mm— | ||||
| No. of observations | 8 | 8 | ||
| Mean ratio and 95% confidence interval | 0.81 ± 0.07 | 0.79 ± 0.10 | ||
| Significant paired t-test difference: P-value | 0.0005 | 0.002 | ||
| Correlation (r) | 0.77 | 0.68 | ||
| 71 mm/40 mm— | ||||
| No. of observations | 8 | 8 | ||
| Mean ratio and 95% confidence interval | 0.77 ± 0.06 | 0.77 ± 0.08 | ||
| Significant paired t-test difference: P-value | 0.0005 | 0.0005 | ||
| Correlation (r) | 0.83 | 0.75 | ||
Cambridge datasets
At the Cambridge site there was a marked change in the behaviour of the samplers between winter and summer. In winter the mean [NO2] for quartz (Q) samplers was slightly higher than for acrylic (A) samplers of equivalent length. This order was reversed in summer with mean [NO2]A > mean [NO2]Q. In Table 3, comparative data for acrylic and quartz samplers of the same length showed that the mean A/Q NO2 ratio was below unity in winter and above unity from April onwards. This abrupt change in the ratio coincided with a sudden rise in mean daily temperatures and marked the onset of summer.Norwich and Marylebone Road datasets
The range of NO2 reflected the site location: 9 to 19 ppb at the urban background site at Norwich and 38 to 61 ppb at Marylebone Road, the London kerbside site. The results of these sites were consistent with the summer data from Cambridge; the order of [NO2] concentrations for individual exposures was predominantly 40 > 120 > 71 ≥ 55 mm for both acrylic and quartz samplers. Mean exposures (Table 2) and sampler/monitor NO2 ratios (Table 5) also followed this order.| Acrylic tube/monitor | Quartz tube/monitor | ||||||
|---|---|---|---|---|---|---|---|
| 120 mm | 71 mm | 40 mm | 55 mm | 120 mm | 71 mm | 40 mm | |
| Marylebone Road— | |||||||
| No. of sets | 9 | 9 | 7 | 8 | 8 | 8 | 5 |
| Mean ratio and 95% confidence interval | 1.15±0.07 | 1.05±0.09 | 1.20±0.16 | 1.04±0.07 | 1.04±0.09 | 1.01±0.09 | 1.18±0.16 |
| Signif. paired t-test difference: P-value | 0.003 | 0.35 | 0.002 | 0.30 | 0.36 | 0.763 | 0.02 |
| Correlation (r) | 0.38 | 0.37 | 0.62 | 0.32 | 0.65 | 0.36 | -0.05 |
| Norwich— | |||||||
| No. of sets | 6 | 6 | 6 | 6 | 6 | 6 | 6 |
| Mean ratio and 95% confidence interval | 1.24±0.14 | 1.14±0.15 | 1.26±0.15 | 1.12±0.14 | 1.06±0.13 | 1.04±0.15 | 1.19±0.11 |
| Signif. paired t-test difference: P-value | 0.005 | 0.09 | 0.053 | 0.098 | 0.35 | 0.59 | 0.006 |
| Correlation (r) | 0.93 | 0.88 | 0.88 | 0.89 | 0.88 | 0.41 | 0.95 |
Significant paired t-tests, Table 5, showed whether the differences between sampler and monitor NO2 measurements were significant. At both sites, [NO2]A was significantly different from [NO2]M for 120 mm samplers. However, excess NO2 formation in 71 mm acrylic samplers was not sufficient to be confirmed by t-tests. For 120 mm and 71 mm quartz samplers at both sites, t-tests and sampler/monitor ratios indicated that [NO2]Q was not different from [NO2]M. Results also showed that for both acrylic and quartz 40 mm samplers, sampler and monitor [NO2] were different.
Acrylic/quartz sampler differences. The difference between acrylic and quartz NO2 measurements was greater for 120 mm than for 71 mm samplers and more marked at the Norwich site than at Marylebone Road. Paired t-tests confirmed these differences for 120 mm samplers (P ≤ 0.01) at both sites and for 71 mm samplers (P = 0.005) at Norwich only.
Comparison of sampler tube lengths. For acrylic samplers there were significant differences between 120 mm, 71 mm and 40 mm lengths: P ≤ 0.02. However for quartz samplers, at both sites, no significant difference was found between 120 mm and 71 mm tubes. Differences between 40 mm and both 120 mm and 71 mm quartz samplers were significant (P ≤ 0.01). All results were in agreement with the Cambridge summer data set.
Acrylic–quartz comparison. At all three sites the mean NO2 measurements by acrylic samplers were significantly higher than quartz samplers of equivalent length.
The difference between acrylic and quartz showed a length dependence, i.e., it was greatest for 120 mm lengths, slightly less for 71 mm and small but apparent for 40 mm lengths.
The mean NO2 from quartz samplers was only just above the monitor NO2 at Norwich and Marylebone Road; the sampler/monitor NO2 ratio = 1.04 (P = 0.59) and 1.01 (P = 0.76), respectively. The slight positive bias remaining, which was greater in 120 mm tubes, was explained by a small loss of UV radiation through quartz tube walls (see Experimental design).
Acrylic length comparison. The mean NO2 measured by acrylic samplers of different lengths was in the order 40 mm ≥ 120 mm ≥ 71 mm ≥ 55 mm, which, excepting 40 mm, corresponded to a chemical bias (where co-diffusing NO and O3 molecules in the longer tubes had more time to react to form excess NO2).
Results for 40 mm samplers suggested enhanced NO2 uptake caused by eddy diffusion at the mouth of the tube. However, this could also have been due to (i) increased atmospheric turbulence for very short samplers caused by the proximity of the sampler holders or (ii) a breakdown of the diffusion process for this length.
More importantly, the results showed that eddy diffusion had a negligible effect for all other tube lengths because mean NO2 was equivalent for 55 mm and 71 mm acrylic tubes (P = 0.766 and 0.335 for Norwich and Marylebone Road, respectively), and mean NO2 for 71 mm quartz samplers was close to monitor NO2.
Explaining differences in sampler accuracy
Evidence from both studies indicates that, for outdoor NO2 measurement, sampler accuracy varies both within and between different locations. This is because accuracy is dependent on constantly changing NO, NO2 and O3 concentrations of the monitored atmosphere. Factors that influence the level of accuracy of exposed samplers are the proximity to NOx emission sources, atmospheric chemistry and prevailing meteorology as these determine relative and absolute NO and O3 concentrations.16 This also explains differences in sampler accuracy found in earlier studies between rural10,11 and urban5,7,8,12 sites. The complexity of interactive processes means that it is extremely difficult to apply a simple correction factor to sampler NO2 measurements.
 | ||
| Fig. 4 Sampler/monitor NO2 ratio versus monitor NO2/NOx for (a) 1 week and (b) 2 week sampler exposures. The line of equal sampler/monitor correspondence is included. | ||
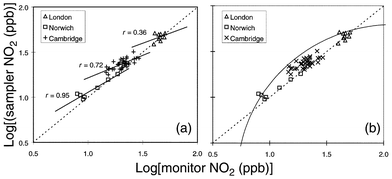 | ||
| Fig. 5 Sampler NO2 against monitor NO2 for 3 locations: (a) comparing correlations and regression lines by individual sites and (b) replacing regression lines with an outer-limit data envelope over all sites. | ||
The magnitude of the NO2/NOx ratio reflects location type in terms of proximity to NOx emission sources and dispersion characteristics of the locality.15,16 If this ratio is known for a particular site, the extent of overestimation by diffusion tube measurement may be estimated.
Use of NO2 diffusion tubes for assessment against air quality standards
Diffusion tube measurements are now directly comparable to the new UK and EU annual mean standards, both set at 21 ppb. Mean absolute sampler overestimations at the three study sites are as follows: Norwich ∼1.4 ppb, Cambridge ∼3.3 ppb, Marylebone Road ∼2.3 ppb. This indicates a maximum overestimation of 3–4 ppb occurring when [NO2]annual is close to the limit level; illustrated by Cambridge 1996 annual means of 20.9 ppb and 23.5 ppb, monitor and sampler NO2, respectively. This indicates that for a sampler [NO2]annual = 25 ppb, air quality may actually be in compliance with EU and UK standards.Trends in NO2 may be difficult to identify in long-term surveys3 because overestimation increases as O3 availability improves: a direct consequence of declining NO concentrations. Real reductions in NO2 of a few ppb may be masked by greater overestimation by samplers.
It is important to note that, even for worst case conditions, the magnitude of the systematic biases is still within accuracy limits recommended by the EU Daughter Directive for indicative monitoring of ±25%. A maximum bias for urban intermediate and background sites of ∼20% (based on 2 week exposures from the Cambridge site) would therefore be acceptable. However, for samplers exposed for longer periods (4–5 weeks) at heavily trafficked roadside sites, accuracy may fall below acceptable limits.
Positioning samplers within shelters is not recommended as this may interfere with the composition of the monitored atmosphere. In the studies presented here sites were reasonably sheltered, however, and this may have helped to eliminate eddy diffusion as a significant source of excess NO2. By optimising sampler design as described, an accuracy for NO2 samplers of ±10% compared to chemiluminescence measurements should be achievable.
Acknowledgements
The provision of a bursary to C. Kirby by Anglia Polytechnic University is gratefully acknowledged. Laboratory facilities and materials were made available by the Department of Geography, Cambridge University. Thanks are also due to staff from the Environmental Health Departments of Norwich City Council and Westminster City Council, London, for site access. Guidance on gas monitor operation was provided by the South East Institute of Public Health, King's College, London, as well as access to the Marylebone Road site.References
- C. Kirby, A. Greig and T. Drye, Environ. Monit. Assess., 1998, 52, 65 CrossRef CAS.
- M. Glasius, M. F. Carlsen, T. S. Hansen and C. Lohse, Atmos. Environ., 1999, 33, 1177 CrossRef CAS.
- T. Bush, D. Mooney and K. Stevenson, UK Nitrogen Dioxide Survey 1998. Report AEAT 4565, AEA Technology, National Environmental Technology Centre, Culham, UK, 2000. Search PubMed.
- H. Van Reeuwijk, P. H. Fischer, H. Harssema, D. J. Briggs, K. Smallbone and E. Lebret, Environ. Monit. Assess., 1998, 50, 37 CrossRef CAS.
- G. W. Campbell, J. R. Stedman and K. J. Stevenson, Atmos. Environ., 1994, 28, 477 CrossRef CAS.
- A. J. Gair and S. A. Penkett, Atmos. Environ., 1995, 29, 2529 CrossRef CAS.
- M. R. Heal, M. A. O'Donoghue and J. N. Cape, Atmos. Environ., 1999, 33, 513 CrossRef CAS.
- M. R. Heal, C. Kirby and J. N. Cape, Environ. Monit. Assess., 2000, 62, 39 CrossRef CAS.
- C. Kirby, M. Fox and J. Waterhouse, J. Environ. Monit., 2000, 2, 307 RSC.
- D. H. Atkins, J. Sandalls, D. V. Law, A. M. Hough and K. J. Stevenson, Harwell Laboratory Report AERE-R12133, National Environment Technology Centre, Culham, UK, 1986. Search PubMed.
- K. J. Hargreaves, PhD Thesis, University of Nottingham, UK, 1989..
- T. Bush, K. J. Stevenson, S. Moorcroft and S. Smith, Validation of nitrogen dioxide diffusion tube methodology, Stanger Science and Environment/National Environmental Technology Centre, Culham, UK, 1998. Available on DETR web page http://www.environment.detr.gov.uk/airq/aqinfo.htm. Search PubMed.
- M. R. Heal and J. N. Cape, Atmos. Environ., 1997, 31, 1911 CrossRef CAS.
- T. R. Oke, Boundary Layer Climates, Cambridge University Press, Cambridge, UK, 1993. Search PubMed.
- C. Kirby, PhD Thesis, Anglia Polytechnic University, Cambridge, UK, 1999..
- Quality of Urban Air Review Group, Urban Air Quality in the United Kingdom, First Report of QUARG, Department of the Environment, London, UK, 1993. Search PubMed.
- UK Photochemical Oxidants Review Group, Ozone in the United Kingdom, Department of the Environment, London, UK, 1987. Search PubMed.
Footnote |
| † Address for correspondence: 11 Henry Morris Road, Impington, Cambridge, UK CB4 9YG. E-mail: kirby_carolyn@hotmail.com |
| This journal is © The Royal Society of Chemistry 2001 |