Glow discharge atomic spectrometry for the analysis of environmental samples — a review
Stephane
Baude
a,
José A. C.
Broekaert
b,
Daniel
Delfosse
c,
Norbert
Jakubowski
d,
Lars
Fuechtjohann
e,
Nestor G.
Orellana-Velado
f,
Rosario
Pereiro
f and
Alfredo
Sanz-Medel
f
aCommisariat à l'Energie Atomique (CEA/DIF/DASE/RCE), Département Analyse et Surveillance de l'Environnement, F-91680, Bruyères-le-Chatel, France
bInstitut für Analytische Chemie, Universität Leipzig, Linnéstr. 3, D-04103, Leipzig, Germany
cEidgenössisches Materialprüfungsamt (EMPA), Abteilung 126, CH-3602, Thun, Switzerland
dInstitut für Spektrochemie und Angewandte Spektroskopie, Bunsen-Kirchhoff-Str. 11, D-44139, Dortmund, Germany
eInstitut für Analytische Chemie, Universität Dortmund, Otto-Hahn-Str. 6, 44227, Dortmund, Germany
fUniversity of Oviedo, Department of Physical and Analytical Chemistry, Julian Claveria 8,, E-33006, Oviedo, Spain
First published on 4th October 2000
1. Introduction
Glow discharges (GD) have been used as sources for atomic spectrometry for many years. First studies with hollow cathode (HC) discharges go back to Paschen.1 However, it was the 1960's before they were studied in more detail as spectrometric radiation sources. A strong impulse came from the work of Grimm,2 who developed a flat cathode dc (direct current) discharge, which proved to be very useful both for bulk and for depth-profile analysis of conducting samples, as also described by Laqua.3 Reviews on the early work with glow discharges, which at the beginning were mainly used as radiation sources for atomic emission spectrometry, were written by Mavrodineanu4 and Broekaert,5 whereas Caroli reviewed the work with hollow cathodes.6 Glow discharges were also developed as powerful ion sources for mass spectrometry. Soon a wide variety of geometries such as pin and different flat sample arrangements were investigated, reports on different spectroscopic techniques with these sources were published7 and a book on glow discharge atomic spectroscopy was published by Marcus.8 A further impetus for glow discharges normally operated with a direct current (dc) in atomic spectrometry was given by the development of suitable radio frequency (rf) sources, which allow a direct analysis of electrically non-conducting samples, as described by Marcus.9–11 Further, more knowledge on the processes occurring in glow discharges became available12 and these sources also started to be used routinely for in-depth profile analysis in metallurgical samples.13 Until recently the diagnostics of the analytical glow discharge sources were scarcely investigated. With the modelling work of Bogaerts and Gijbels,14 an evaluation of the number densities for different species and the related atomicemission line intensities in the different locations of the plasma was possible15 and the description of sputtering profiles was established.With glow discharges of different shapes and at different working conditions, samples of different states of aggregate can be analyzed. Accordingly, these sources can be used for solving different analytical tasks and challenges in environmental analytical chemistry. The different glow discharges described can be used in optical atomic spectrometry as well as in mass spectrometry for different tasks. They can be used for analyses of samples from the different areas of the environment, namely air including airborne dust, solid samples such as sediments and soils as well as liquid samples such as waters, and also for analyses of various biological fluids. Through coupling with separation methods or even directly, signals stemming from different species of the same element can be detected separately, which makes speciation possible. This review will deal with the possibilities offered by different types of glow discharges for the determination of elements within a very wide concentration range of species in the different sections of the environment; it will show the lines of development in atomic emission spectrometry, atomic absorption and atomic fluorescence work, also with laser sources, and in mass spectrometry. In a number of cases sampling approaches and analytical figures of merit will be discussed and the corresponding applications as well.
2. Samples and sample preparation
In environmental analysis, the most interesting samples consist of powders and particles (sediments, soil, airborne dust), dried organic substances (from animals or plants), gases and liquids or solutions containing the analytes to be analysed. Glow discharge spectroscopy (GDS) is a relative method, which means that calibration is required for quantification, because the sensitivity strongly depends on various factors such as geometry and conditions of sample and source or chosen discharge working conditions (pressure, power, voltage, current).2.1. Powdered and particulate samples
The advantage of glow discharges for powdered and particulate samples is that sample preparation is extremely simple in comparison to other techniques of atomic spectroscopy which require complete dissolution of the sample. Dissolution for some of the matrices described is difficult, laborious and time consuming. Dissolution always leads to a dilution of the sample, can cause blank problems and many of the acids used are not compatible with the techniques applied, causing spectral and non-spectral interferences.Prior to analysis, samples from soil, rock or sediments are usually dried, homogenised and ground in a mill to a specific particle size (less than 50–100 µm). The sample powder is then thoroughly mixed with an amount of a pure conducting matrix powder, which is several times larger than the sample mass, and pressed into pellets, which leads to a certain dilution of the matrix. As a conducting matrix, most often high-purity copper is used, but graphite, silver and tantalum have also been employed. The choice of copper as a binding material is particularly popular because the pressed pellet has good mechanical properties, excellent thermal and electrical conductivity and high sputtering efficiency. However, this approach is always limited by signal drift effects caused by preferential sputtering, if the sputter rates of the conducting host matrix and the non-conducting analyte material differ significantly.
Samples taken from animal or plant tissue have to be processed before GDS analysis is possible. The samples may either be dried in an oven or ashed. The dry residue is homogenised and ground and can then be treated in the same way as a particulate matter.
Calibration is often applied by using certified reference materials (CRM) or by standard additions of well known powders or residues of liquids. Massive solid samples and pressed pellets do not behave in the same way when they are analysed using a glow discharge. Therefore, solid CRMs generally cannot be used directly to calibrate the analysis of pellets. Accordingly, calibration standards should be prepared along the same processing route as the pellets containing the material to be analysed. Instead of a CRM, a mixture of pure substances in powder form may also be used. For instance, for the GD analysis of an Antarctic sediment, four calibration standards were prepared using seven different high-purity powder oxides.16 The oxides were mixed in various concentrations, added at a mass ratio of 1∶5 to a copper powder and processed into pellets to form the calibration standards. For an optimisation of the analysis of non-conducting materials in a copper matrix, a set of calibration standards was prepared using a river sediment CRM, a bauxite CRM and several mixtures of high-purity Fe2O3 and Al2O3.17 The highest sensitivity was obtained for discs with only 5% non-conductor content and the analysis of the two CRMs indicated an accuracy that is adequate for quantitative analysis.
2.2. Liquid solutions
Three different approaches exist for the GD analysis of liquid samples: the dry residue analysis with the hollow cathode discharge (HCD) concept, analysis of pressed pellets containing the adsorbed liquid, and direct analysis of the liquid samples by use of adequate sample introduction techniques. For each of these methods, the preparation of calibration standards is slightly different, but they all rely on CRMs in the form of aqueous solutions.The HCD method employs hollow tubes, which are filled with liquid and subsequently dried in a furnace, leaving a small film of residue to be analysed. Calibration standards need to be prepared in the same manner starting with a certified liquid solution that may or may not be mixed with other solutions or further diluted before filling the hollow tube.
The adsorption method relies on materials with a high specific surface, mostly copper or graphite powders. The liquids are adsorbed before pellets are produced. For preparation of the standards, graphite or copper powders are mixed with the appropriate volume of dilute solutions of the elements in question. The slurry is dried, the resulting powder homogenised and pressed into pellets for GD analysis, again following the same processing route as the samples containing the unknown liquids.
Direct injection of liquids in a GD is possible too if suitable sample introduction systems are applied, but for all these approaches it should be mentioned that the gas temperature of most glow discharges is low so that they do not have sufficient capability to vaporise droplets or too large particles. Additionally the pressure difference between the aerosol generation at atmospheric pressures and the glow discharge operated at reduced pressure has to be overcome either by differential pumping used in a particle-beam method or by use of adequate connecting capillaries. A direct nebulisation of solutions such as different types of water samples can be easily used provided aerosol desolvation is applied. To avoid an overload of the plasma by water vapour, a particle-beam method is described by You et al.,18 which achieved detection limits at ng ml−1 levels. Schroeder and Horlick19 used a similar source and operated the system without removing the water vapour. They achieved even lower detection limits for some elements such as Li.
2.3. Gases and volatilised samples
Three approaches can be considered for introduction, as a gas phase, of the analytes of interest into a glow discharge: (i) the direct introduction of gaseous samples, (ii) the introduction of samples which were previously thermally vaporised, and (iii) the use of a chemical reaction to convert the analytes to volatile species prior to introduction in the GD, such as hydride generation (HG) or an oxidation reaction. In the latter case, by-products produced in the gas generation step, such as water vapour, carbon dioxide and molecular hydrogen, can be eliminated prior to reaching the discharge.Often a pre-concentration step by freezing of the gaseous or volatilised samples on a cooled trap is used prior to sample introduction into the GD to improve detection limits significantly. One of the most prominent applications is the use of gas chromatography for separation of gaseous or volatilised samples prior to introduction to the GD.
2.4. Calibration standards and certified reference materials
For each of the described types of samples, the preparation of calibration standards and the use of CRMs will be discussed separately. In this section, a difference is made between a CRM and a calibration standard. A CRM is defined here as a ready-to-use standard sample that is commercially available and certified with respect to its use and its elemental concentrations. It includes in this context both types of reference materials called CRM and RM according to ISO REMCO Guide No. 35. A calibration standard, on the other hand, is defined as a specimen that is prepared by the user from a number of high-purity materials, or materials and solutions with a certified composition.Unfortunately, depending on the type of environmental sample to be analysed, the availability of CRMs is either very limited or non-existent. For GDS, being a relative method, this represents a serious drawback that needs to be overcome if the technique is to find widespread use for environmental analysis. Standards—either CRMs or user-prepared calibration standards—are absolutely essential to calibrate the spectrometer, i.e., to establish an unambiguous function between the measured intensities and the elemental concentrations. In fact, a correct calibration is the key to accurate and reliable analytical results. For this reason, in the current European Thematic Network project `GDS for Spectrochemical Analysis', high emphasis was put on the definition of specifications for CRMs needed for GDS.
Quite a number of CRMs of sediments, rocks, soil and airborne particles, as well as `urban particulate matter', ashes, slags and minerals are available from many different institutions and companies [Alfa, Johnson Matthey Inc., Seabrook NH, USA; Bureau of Analysed Samples (BAS) for British Chemical Standards, Middlesbrough, UK; Breitländer (Eichproben und Labormaterial GmbH), Hamm, Germany; H.R.T. Labortechnik GmbH, Kirchheim, Germany; MBH Analytical Ltd., Barnet, UK; and National Institute of Standards and Technology (NIST), Washington DC, USA].
Two interesting new CRMs were prepared for a monitoring campaign to assess the degree of pollution in the Mediterranean Sea20 and in the Antarctic.16 The multi-elemental CRMs were based on coastal sediments collected at different locations along the coastline. As the effort and cost of sample collection, preparation and certification was high, these types of CRMs represent an exception worth mentioning. Although they were prepared essentially for national purposes they were also made available on the market. CRMs of marine sediments have also been introduced on the market recently by the Institute of Marine Biosciences, NRC (National Research Council), Ottawa, Canada.
For analysis of airborne particles, Marcus et al. applied a glow discharge source with direct injection of the particles.21 The novel concept was evaluated using a NIST SRM 1648 urban particulate matter (a composite of airborne particles collected in St. Louis, MO) as well as ground caffeine powder and several pure organic substances.
In a direct analysis of liquid samples by the use of adequate interfaces, the standard solutions for calibration can be employed directly, eliminating the need to prepare special calibration standards. Several GD methods, discussed below, show a certain promise for the direct elemental analysis of liquids.
CRMs of dried organic substances (from animals or plants)are virtually non-existent with few exceptions. Along with the preparation of CRMs based on sediments, Caroli and co-workers launched two projects to prepare CRMs based on green algae20 and krill.16 For the determination of trace metals in marine fauna, a number of CRMs based on fish tissues have been made available by the Institute of Marine Biosciences at NRC. CRMs based on a number of dried cereals and freeze-dried animal blood are distributed in powder form by H.R.T., Germany.
The preparation of calibration standards from aqueous solutions is the most simple and inexpensive approach used so far, because other analytical methods, especially the widespread inductively coupled plasma (ICP) method, use dilute solutions as well. ICP standard solutions are readily available for all elements from different suppliers [Alfa, Johnson Matthey Inc., Seabrook NH, USA; Fluka Chemie AG, Buchs SG, Switzerland; and MBH Analytical Ltd., Barnet, UK].
3. Glow discharge optical atomic spectrometry
Glow discharges can be operated with either planar or hollow cathodes. Having fundamentally different analytical figures of merit, as a result of the differences in the residence times of the analyte species, it makes sense to treat both types of devices separately with respect to their systematic development, their properties and their applications. Further, glow discharges can be used not only as radiation sources in optical atomic spectrometry but also as atom reservoirs for atomic absorption and atomic fluorescence work.3.1. Atomic emission spectrometry of glow discharges with planar cathodes
The glow discharge lamp according to Grimm is a restricted glow discharge and has been widely employed, as described in a review by Dogan.22 However, slightly different versions can also be used, such as the one described by Czachow.23 Here a floating restrictor is applied, which might have the advantage of decreasing the curvature in the burning crater profile. DC glow discharges, as discussed by Winchester et al.24 are mostly photon noise limited and it is possible to apply Fourier transform spectrometry (where however limitations of detection occur) as shown by Broekaert et al.25 As many of the analyte species are in the ground state, as shown by the self-reversal of atomic resonance lines, it makes sense to apply boosting with an additional discharge, as reviewed by Leis and Steers. This boosting has been described for a microwave discharge with a slab-line cavity, using argon and neon as discharge gases.26 The latter even enables the detection of fluorine with GD-AES, as shown by Wagatsuma.27 Further atomic emission line enhancements may also be obtained as a result of magnetic fields. This leads to increased sputtering as well as to increased excitation, as shown by Raghini et al.28 and used by Kim et al.29 Enhancements in signal to background ratios may also result from the use of pulsed glow discharges, as described by Harrison and co-workers.30,31With respect to environmental analysis, glow discharge atomic emission spectrometry with planar cathodes has been used for the analysis of airborne dust, soil and plants as well as for liquid samples (water samples, biological fluids and others).
As airborne dust samples are electrically non-conducting, Pan and King32 used a radio-frequency glow discharge for the atomic emission spectrometric determination of trace elements down to 2 µg g−1 for a number of trace elements in coal fly ash. In the case of a dc discharge one could mix the sample with copper powder so as to obtain an electrically conducting pellet after briquetting.
Caroli et al. analysed marine sediments from the Antarctic and determined Al, Cr, Fe, Mn, Ni, Pb and Zn by flat and hollow cathode atomic emission spectrometry after grinding the samples, mixing with copper powder and briquetting pellets. For studies in marine ecosystems, both coastal sediments and plant materials such as green algae were analysed for As, B and others so as to study anthropogenic impacts with various methods including glow discharge atomic emission spectrometry.20
Special use of glow discharge atomic emission spectrometry has been made for water analysis. Two methods can be followed, namely dry solution residue analysis and the direct introduction of the solution, after solvent removal, into the glow discharge source. Becerra et al.33 determined Pb down to 50 ng and Ga to 300 pg in dry solution residues. Wrembel et al.34 determined Hg in water samples after preconcentration through electrolysis and sweeping the vapors into a ring discharge. The challenge of introducing liquids directly into the glow discharge plasma was taken up by various groups. Cserfalvi and Mezei35 used a 20 kV dc discharge to determine 1–50 µg ml−1 of Cu, Mn, Ni and Pb directly in tap water, and presented a model36 for the operation of the discharge. The same principles were applied for coupling glow discharges to liquid chromatography so as to perform element-specific detection. Herring and Piepmeier37 used a liquid-interfaced oscillating glow discharge detector for a flowing liquid. It was formed in an argon atmosphere at atmospheric pressure and could be used for element-specific detection in liquid chromatography and capillary electrophoresis. The presence of carbohydrates could be monitored down to low nanomole and femtomole quantities from changes of the glow discharge working conditions such as current and oscillation frequency. Park et al.38 showed that OH bands and elemental atomic lines for elements such as Al, Cd, Cr, Cu, Hg, Mn and Pb (but not for Ar) were emitted and these elements could be determined, however, only to the µg ml−1 level.
The physical features of a low pressure GD make it a promising spectrochemical source for the analysis of gases or volatilized analytes by AES. Glow discharges are known not to be in local thermal equilibrium. Gas-kinetic temperatures are low (implying that the continuum background emission should be relatively weak) while electronic excitation temperatures are very high. Potentially, the glow discharge could offer the detection capabilities, as gas chromatographic detector, of the microwave induced plasma (MIP) or the He inductively coupled plasma (ICP) (e.g., for the analysis of volatilized non-metals) but at a fraction of their running costs. Unfortunately, although these applications appear to be ideal for GD analyses, very few examples are quoted in the literature so far.
As mentioned previously, three approaches can be considered to introduce, as a gas, the analytes of interest into planar cathode glow discharges: (i) the introduction of gaseous samples or samples previously thermally vaporised; (ii) the use of a chemical reaction to convert the analytes into volatile species prior to the introduction in the GD, such as a hydride generation or an oxidation reaction; and (iii) the use of gas chromatography.
On the other hand, several non-metals in organic compounds have been determined by introducing their vapours directly into the GD chamber. Hieftje et al.39,40 determined C, F, Cl and S using a He flat cathode dc-GD, patterned after the first stage of an interface designed for inductively coupled plasma mass spectrometry. Gaseous samples or low boiling point liquids were introduced into the GD through a thermoelectrically heated exponential dilutor. The compounds used to deliver the cited elements were carbon dioxide (for C), hexafluoroethane (for F), dichloromethane (for Cl) and thiophene (for S). Also, a Grimm glow discharge was investigated by Broekaert et al.41 for the determination of chlorine in evaporated halogenated hydrocarbons (dichloromethane, chloroform, carbon tetrachloride, trichloroethylene, 1-chloropentane, chlorobenzene and p-chlorotoluene), introduced into the dc-GD through a fused-silica capillary. Three different locations of the capillary ending in the chamber discharge were evaluated: at the flat surface of the cathode, at a conical depression machined into the surface of the cathode, and at the bottom of a hollow cathode. It was observed that the line-to-background ratio in the central region of the plasma did not differ greatly among the three sampling geometries.
The potential of a He rf-GD was evaluated by Centineo et al.42 for the determination of Cl, C, Br and S, using a thermoelectrically heated exponential dilutor to introduce discrete amounts (0.5 µl) of organic compounds diluted in hexane solution. The He gas together with the analyte was introduced into the discharge chamber through a block called `the limiting disc', which separates the body of the chamber from the piece acting as `cathode' and also constrains the plasma volume. Detection limits obtained for the four elements were of the order of pg s−1.
The use of relative emission intensities for the determination of element ratios and empirical formulae of organic molecules containing hetero-atoms has also been investigated for sulfur- and chlorine-containing compounds with satisfactory results.39–43 For each hetero-atom, one molecule was arbitrarily chosen to define a standard hetero-atom/carbon intensity ratio, while the molecules to be characterised were referenced to this standard.
Other types of applications were described by Kim et al.43 In their work, toxic contaminants and harmful gases in air flows were eliminated by a gas-jet glow discharge, and atomic emission spectrometry was used to monitor the decomposition. To find the optimum conditions for effectively removing pollutants from air, the elimination of carbon tetrachloride in an air-GD was investigated. The level of decomposition of the toxic contaminant was observed to be higher than 96%.
Different approaches with chemical reactions were used to provide for a volatilised compound in GD-AES detection. Batch arsine generation and accumulation in a liquid nitrogen trap prior to entering into a He dc-GD was employed to determine traces of arsenic in standard fly ash, coal, tissues and rock samples.44 By-products produced in the hydride generation step, such as water vapour, carbon dioxide and molecular hydrogen, were eliminated prior to reaching the discharge. Therefore, the arsenic hydride was passed through H3PO4 to avoid the introduction of water vapour into the plasma and through NaOH to trap the CO2 produced during the reaction. The arsine was then trapped in liquid N2 which subsequently was warmed up so as to sweep the released arsine into the chamber discharge. The use of the liquid N2 trap allowed both the separation of the molecular hydrogen (which is not retained) from arsine and preconcentration of the analyte.
Matsumoto et al.45 explored batch hydride generation coupled to dc-GD-AES for the six elements: As, Ge, Pb, Sb, Se and Sn. In the method developed by Feldman,44 the hydrides were retained in a liquid nitrogen trap. H2O and CO2 were also trapped before reaching the discharge. In this study an improved generation system was constructed, which does not necessitate switching off the discharge during the hydride generation reaction when much hydrogen gas is evolved. The technique was applied to the determination of As, Se and Ge in biological and environmental samples such as orchard leaves, pepperbush, bovine liver and dolphin liver.
A continuous flow hydride generation system was investigated for As determination by Broekaert et al.41,46 In continuous flow generation procedures, the production of hydrogen is not as violent as in the batch procedures and the system is simpler. The evolved arsine, by-products and support gas could be continuously introduced into a dc-GD, once they had passed through a gas–liquid separator and cooled to retain moisture. The use of He, Ne and Ar as plasma gas was investigated and the best results were obtained with Ar.
The determination of chloride in water using a continuous flow sample introduction system, based on the generation of volatile chlorine by chemical oxidation, was described by Rodríguez et al.47 After the optimization of the parameters affecting the GD plasma, the analytical figures of merit were compared for dc- and rf-GD in the near infrared (NIR) and visible regions. Rf-GD provided better DLs for chloride than the dc-GD (dc-GD, 2.5 ng ml−1 in the visible and 0.5 ng ml−1 in the NIR; rf-GD, 1.0 ng ml−1 in the visible and 0.14 ng ml−1 in the NIR). Rf-GD-AES and detection in the NIR were used to develop a selective and sensitive method for the determination of the adsorbable organic halogen (AOX) parameter in the wastewaters from cellulose factories, after preconcentration and combustion steps to yield chloride ions from the organochlorides.
Finally, GD-AES has been applied for gas chromatography (GC) detection. Feldman and Batistoni48 used a He dc-GD as a spectroscopic detector for F, Cl, Br, I, S, P, C, Si, Al, As, Cr and Cu in GC effluents. A 3 m chromatographic packed column was used to separate the compounds while, for detection, the glow discharge was generated in a 6 mm od borosilicate glass tubing with two lateral arms where two electrodes were inserted.
GDs have also been employed in elemental speciation studies as GC detectors for mercury speciation.49 Information provided by total concentration determination of a toxic element is not enough today to evaluate the impact on the environment, bioavailability or actual toxicity. In other words nowadays information on speciation of trace elements is urgently needed. For mercury toxicity assessment, inorganic and organic forms of the metal should be known, e.g., methylmercury is much more toxic than inorganic mercury. In work using GD-AES detection, a fused silica capillary column was employed in the chromatographic system and the effluent from the GC was transported into the chamber discharge through a stainless-steel tube welded to the limiting disc of the GD. Methylmercury, ethylmercury and inorganic mercury (II) were the species of mercury under study and they were derivatised with a Grignard reagent (butylmagnesium chloride) before chromatographic separation. Similar DLs were observed when powering the discharge with rf or with dc energy. Moreover, these DLs were of the same order as those obtained with other, more common detectors used for mercury speciation, as has been demonstrated in the analysis of fish tissues (certified reference materials) by dc-GD-AES.
In Table 1 a list of the most relevant applications for the determination of gases and volatilized analytes by GD-AES is given.
| Instrumentation | Elements (λ) | DL | Application | Reference |
|---|---|---|---|---|
| a MeHg = Methylmercury. b EtHg = Ethylmercury. | ||||
| dc-GD-AES | C (193.09 nm) | 0.4 ng s−1 | Volatilised organic compounds | 40 |
| S (190.03 nm) | 1.0 ng s−1 | |||
| F (685.6 nm) | 82 ng s−1 | |||
| Cl (479.45 nm) | 5.0 ng s−1 | |||
| dc-GD-AES | Cl (579.45 nm) | 20 ng s−1 | Halogenated hydrocarbons | 41 |
| rf-GD-AES | Cl (479.45 nm) | 0.7 pg s−1 | Volatilised organic compounds | 42 |
| C (247.86 nm) | 0.3 pg s−1 | |||
| Br (470.49 nm) | 11 pg s−1 | |||
| S (545.38 nm) | 6.0 pg s−1 | |||
| dc-HG-GD-AES | As (228.8 nm) | ≤0.1 ng | Coal fly ash, orchard leaves, bovine liver,granite and other rocks | 44 |
| dc-HG-GD-AES | As (228.8 nm) | 0.2 ng | Orchard leaves, pepperbush, bovine liver,dolphin liver | 45 |
| Ge (265.2 nm) | 0.1 ng | |||
| Pb (405.8 nm) | 6.0 ng | |||
| Sb (252.9 nm) | 0.8 ng | |||
| Se (204.0 nm) | 2.0 ng | |||
| Sn (284.0 nm) | 0.2 ng | |||
| dc-HG-GD-AES | As (228.8 nm) | 20 ng ml−1 | Arsenic solutions | 46 |
| dc-GD-AES | Cl (837.6 nm) | 0.5 ng ml−1 | Waste water | 47 |
| Cl (479.45 nm) | 2.5 ng ml−1 | |||
| GC-dc-GD-AES | F (685.6 nm) | 4.5 ng | Organic compounds | 48 |
| Cl (725.67 nm) | 45 ng | |||
| Br (734.85 nm) | 45 ng | |||
| I (206.24 nm) | 4.5 ng | |||
| C (247.86 nm) | 5.0 ng | |||
| P (231.62 nm) | 6.4 ng | |||
| S (527.89 nm) | 110 ng | |||
| Si (251.61 nm) | 10 ng | |||
| Al (396.15 nm) | 12 ng | |||
| As (228.8 nm) | 0.3 ng | |||
| Cr (425.43 nm) | 1.4 ng | |||
| Cu (324.75 nm) | 110 ng | |||
| GC-dc and rf- | MeHga (253.6 nm) | 1.3 pg as Hg | Fish tissues | 49 |
| GD-AES | EtHgb (253.6 nm) | 1.3 pg as Hg | ||
| Hg (II) (253.6 nm) | 3.0 pg as Hg | |||
| dc-HC-GD-AES | F (685.6 nm) | 0.6 ng | Fluorocarbon compounds | 73 |
| Br (827.2 nm) | 17.4 ng | |||
| Cl (479.5 nm) | 2.7 ng | |||
| dc-HC-GD-AES | Cl (479.45 nm) | 44 ng | Organic solutions | 74 |
| Br (734.86 nm) | 41 ng | |||
| F (685.6 nm) | 200 ng | |||
| I (206.24 nm) | 55 ng | |||
| S (545.4 nm) | 39 ng | |||
| HG-HC-GD-AES | Si (288.1 nm) | 6 mg | Silicate sample | 69 |
| Si (251.6 nm) | 30 mg | |||
| GC-rf-HC-GD-AES | MeHga (253.6 nm) | 0.2 pg | Fish tissues | 75 |
| EtHgb (253.6 nm) | 0.2 pg | |||
| Hg (II) (253.6 nm) | 0.3 pg | |||
| CV-FANES | Hg (253.6 nm) | 20 pg | Citrus leaves, pine needles, river sediment | 77 |
| CV-FANES | Hg (253.6 nm) | 4 pg | Fish, shrimp, horse, kidney, cotton cellulose,river sediment, sewage, sludge | 78 |
| HG-FANES | As (228.8 nm) | 0.116 ng | Fish, shrimp, river sediment, soil, apple leaves, peachleaves, pine needles, milk powder, animal bone, hay powder | 79 |
| Bi (223.1 nm) | 0.062 ng | |||
| Sb (217.6 nm) | 0.044 ng | |||
| Se (207.5 nm) | 0.316 ng | |||
| Te (214.3 nm) | 0.016 ng | |||
3.2. Atomic emission spectrometry of glow discharges with hollow cathodes
It has long been recognized that hollow cathode (HC) glow discharges provide better limits of detection than planar cathode discharges. Therefore, they are of higher potential interest to environmental analysts. In particular, the high power of detection can be realized using boosted hollow cathodes. In a hot hollow cathode, as discussed by Kitagawa et al.,50 not only low detection limits but also a decrease in interferences by Na was realized. Caroli et al.51 mentioned that the improvement of the detection limits was at least one order of magnitude. Szilvassy-Vamos et al.52 reported on `state of the art' detection limits in hollow cathode emission spectrometry. Chen and Williams53 studied the determination of non-metals in micro-samples with the aid of hollow cathodes and Borkowska-Burnecka and Zyrnicki54 studied the vaporization and excitation mechanisms of Pb also in the presence of potassium halides.Special interest was paid to a combination of furnace evaporation under reduced pressure and excitation in a low-pressure plasma. This method, introduced by Falk et al.55 as furnace atomic non-thermal emission spectrometry (FANES), was found to enable the determination of non-metals in plants for example.56 Dry solution residues can easily be analysed. For Cd and Mn, e.g., ref. 57, it was shown that the dynamic range is three times as large as in furnace atomic absorption spectroscopy. Dittrich et al.58 also used this source for the excitation of molecular spectra and Harnly et al.59 used a hollow anode instead of a hollow cathode for the excitation of the evaporated material. Owing to the high evaporation efficiencies and the excellent signal to background ratios the detection limits for many elements are in the pg range.
For the monitoring of lead and cadmium in air as a result of automobile exhaust emissions, sampling on a graphite hollow cathode surface and the use of the hollow cathode glow discharge were described in the 1970s.60 Recently, Marcus et al.21 refined this approach by direct introduction of particulate matter into glow discharge emission spectrometry and mass spectrometry sources through a particle beam/momentum separator apparatus. Particles passing through the aerodynamic momentum separator impinge on the heated (200–500![[thin space (1/6-em)]](https://www.rsc.org/images/entities/char_2009.gif) °C) inner surface of a hollow cathode glow discharge plasma volume and are flash-evaporated. Absolute detection limits for Fe are about 7 ng.
°C) inner surface of a hollow cathode glow discharge plasma volume and are flash-evaporated. Absolute detection limits for Fe are about 7 ng.
Caroli et al.61 further reported on the analysis of marine sediments and use of a microwave-boosted glow discharge lamp for determinations in dry solutions residues; detection limits between 10 and 160 ng ml−1 could be obtained for Al, As, P, Pb, S, Sb, Si, Sn and Ti.
The hollow cathode especially has been used for analytical determinations in liquids. Dry solution residue analysis has been described for the determination of selenium in serum down to the 1 ng ml−1 level by Szilvassy-Vamos et al.62 Even micro-volumes down to the nl level can be analysed with a micro hollow cathode source and detection limits for Li, Na, K and Ca, as determined in serum, were achieved at the pg level.63 Morgan et al.64 determined Cu and Pb with a micro-cavity hollow cathode glow discharge at the low pg level. They studied the influence of the electrode surface and the drying conditions on the analytical figures of merit, whereas Tseng et al.65 showed that, by improved discharge current control, the analytical precision in hollow cathode glow discharge emission spectrometry can be considerably improved, in the analysis of renal fluids. Cai and Williams66 optimised a pulsed hollow cathode emission source for dry solution residue analysis with respect to power of detection and precision and showed the influence of pulse width, pulse height, frequency, pressure, gas-flow rate, cathode materials and filler gas. Analysis of micro-samples was performed with nl volumes of standard solutions, realizing absolute detection limits of only 0.32 pg for Na, 0.35 pg for Li and 3.5 pg for K. Extreme care was taken in the calibration routine, including working in a `clean bench' work space and ensuring that samples and standards were handled with the same pipette for a given experiment.
A further feasible way to operate a hollow cathode for solution analysis consists of coupling it with electrothermal evaporation, as reviewed by Papp and Banhidi67 for the case of environmental liquids and micro-liter samples; for Mn, Cu, Cr and Pb detection limits in the µg ml−1 range were obtained. Lee et al.68 determined Hg and Pb in serum and urine without the need of applying sample decomposition prior to analysis with this combination method. Another interesting approach is the use of hydride generation with hollow cathode sources, for the determination of silicon in water samples, as demonstrated by Fujiwara et al.69 Direct nebulisation of solutions, such as different types of water samples, is feasible in the case of hollow cathode glow discharges, provided aerosol desolvation is applied, as described by You et al.18 This particle-beam method allows a detection limit of 8 ng ml−1 to be achieved. Schroeder and Horlick19 worked with a similar source and could even operate the system without removing the water vapour; they reported detection limits ranging from 0.03 ng ml−1 for Li to 200 ng ml−1 for Zn. Particle beam hollow cathode emission spectrometry allows the determination of C and H in amino acids and the brutto formulae when a thermoconcentric nebulizer is used, as described by You et al.70 The optimisation of CH3OH/H2O mixtures for Cu, Pb, Fe and Mg has been described and detection limits between 10 and 20 ng ml−1 were reported.71 Accordingly, element-specific detection for HPLC work can be performed. Sikharulidze and Lezhnev72 even conceived a general source for the elemental analysis of liquids on a such principle.
The ability of HC-GDs for gas analyses was evaluated by Puig and Sacks73 with a dc-HC-GD. Fluorine, Cl and Br were determined in a gas stream (100 mg l−1 Freon mixture of Freon 13 and Freon 13B1 in He). Two types of hollow cathode cavities (0.8 and 3.2 mm) and copper as cathode material were evaluated. Unfortunately, the rather large injected volume and the relatively large dead volume of the injector resulted in significant tailing and bad peak shapes. A dc-HC also was used by Ng et al.74 for the determination of Cl, Br, F, I and S. Single element solutions were prepared with methanol as the solvent, so as to dilute the standard solutions (CCl4, CS2, HF, CH2Br2 and CH3I). Samples were then injected into the He stream through a septum; the injected volumes were between 0.7 µl and 10.7 µl. DLs obtained with this hollow cathode helium discharge-AES system were between 200 ng for S and 39 ngfor F.
HC-GD-AES was also applied to the determination of Si using a novel gaseous hydride generation technique, involving the drying of an aqueous solution of silicate (sample) and its mixing with powdered LiAlH4.69 The sample was introduced into the glow discharge chamber through a pinhole at the center of the cathode which was connected to the hydride generator. The detection limit for Si was 6 mg at 288.1 nm and 30 mg at 251.6 nm.
The HC has also been used for elemental speciation purposes.75 A similar chromatographic system to the one mentioned above49 was used, but the effluent from the capillary GC was detected with an rf-HC-GD. The GC–GD interface consisted of a stainless-steel tube (150 mm long, 10 mm od and 5 mm id) and the capillary column from the GC passed through it. One end of the transfer line was introduced into the chromatograph oven while the other end was welded to the hollow cathode body. Fig. 1(a) shows a general view of the GC-GD coupling. The detection limits obtained were up to 5–10 times better than those obtained with a flat-cathode GD. Also, the rf-HC-GD-AES detector proved to be more sensitive than the more common MIP-AES detector for GC. The accuracy of the methodology was validated by the analysis of two certified materials (Dogfish Liver: DOLT-2 and Dogfish Muscle: DORM-2; NCR Canada). Typical chromatograms obtained for the fish tissue samples are shown in Fig. 1(b).
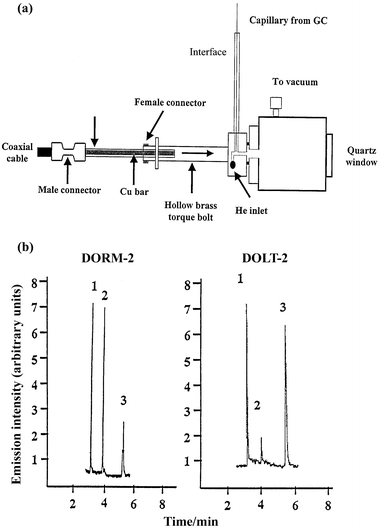 | ||
| Fig. 1 GC-rf-HC-GD-AES for speciation studies (reproduced from ref. 75, with permission): (a) schematic diagram of the interface between the GC and the GD; and (b) chromatograms obtained for the speciation of mercury in DORM-2 and DOLT-2 certified materials, after Grignard derivatization. 1, Methylmercury, 2, ethylmercury (internal standard) and 3, inorganic mercury. | ||
As mentioned previously, the FANES source can be considered as a special type of HC-GD.76 Baxter et al.77 have evaluated the FANES technique for the determination of mercury by cold vapour (CV), following reduction with tin(II) chloride. The generated vapour was swept in a flow of Ar through a Pt lined graphite tube for preconcentration and matrix separation. The DLs were reported to be 6 or 7 times lower than those obtained with CV-AAS and the technique could be applied to the analysis of certified reference materials (citrus leaves, pine needles and river sediment).
Dittrich et al.78 used Ir and Pd as modifiers and carried out determinations of mercury using several methods, including cold vapour generation with NaBH4. The DLs obtained were 4 pg when Ir was used as modifier and 12 pg when Pd was employed. Several types of certified material were analysed including fish flesh homogenate, shrimp, horse kidney, cotton cellulose, river sediment and sewage sludge.
The simultaneous determination of As, Bi, Sb, Se and Te hydrides has been studied by FANES also.79 Simultaneous preconcentration of the different hydrides inside the graphite furnace was carried out. Also, Pd and Ir were evaluated as modifiers, obtaining best results for Ir. Different reference materials (water samples, fish flesh, apple leaves, peach leaves, milk powder, pine needle, hay powder, animal bone) were analysed.
For flat cathodes, most of the applications presented in the literature for the analysis of gases and volatilized analytes with hollow cathode glow discharges are compiled in Table 1.
3.3. Glow discharges as atom reservoirs for atomic absorption and atomic fluorescence spectrometry
Different types of glow discharges have been shown to be very suitable for use as atom reservoirs for atomic absorption and fluorescence spectrometry. Indeed quenching of species through collisions is considerably reduced, which favors the population of excited states in fluorescence work. Atomic absorption from non-ground-state levels, as is often required in diode laser atomic absorption spectrometry, is also possible. Both atomic absorption and laser atomic fluorescence with glow discharges have thus been frequently described. With respect to environmental applications, laser atomic fluorescence has been proposed for challenging tasks because of its extremely high power of detection.For the direct atomic absorption spectrometric analysis of compact metallic samples, jet-assisted glow discharges were developed. However, such systems can also be used for dry solution residue analysis, and detection limits of 40 pg Cd and 3.7 ng Ni have been reported.80 Metals such as Cd, Cr, Cu, Fe, Mg and Mn deposited on graphite cathodes can be sputtered off and determined by atomic absorption spectrometry with a very high power of detection. In the case of sediment samples, pellets can be made after mixing with Cu powder and Fe can be determined in the river sediments as well as in bauxite with a high accuracy at the 0.5% (w/w) level.17 Also Zeeman AAS has been performed using a hollow cathode glow discharge in the pulsed mode as atom reservoir, and Pb in urine, Pb, Mn and Cu in blood and Mn in hair were determined.81 Glow discharges are especially useful for diode laser AAS, as lines starting on excited levels can be used. With a see-through hollow cathode as atom reservoir, atomic absorption spectroscopy can be used for the determination of rubidium isotopes. With this aim, a pumping and a probing beam in opposite directions as well as stainless-steel electrodes at a current of 160 mA were used. Barshick et al.82 reported on diode laser optogalvanic spectrometry for isotopic analyses of uranium where the 235U/(235U + 238U) ratio for 20% enriched uranium could be measured with a precision of 2.38%, which is sufficient for screening purposes. The results were found to agree well with those of thermionic mass spectrometry.
Typical conditions, figures of merit and applications of laser-induced atomic fluorescence with different types of hollow cathode glow discharges are given in Table 2. Potential applications are the analysis of small volume samples such as cloud water samples, and the determination of extremely low concentrations, e.g., in pure water or ice samples.
| Atom reservoir | Detection limits | Application | Reference |
|---|---|---|---|
| Pulsed hollow cathode (pulse 0.1 ms in afterglow) | 50 µl, Pb (0.5 pg), Ir (20 pg) | Aqueous solutions | Glick et al.104 |
| Pulsed graphite hollow cathode - Cu vapour pumped dye laser | 1.5 fg Pb, 2 pg Ir | — | Womack et al.105 |
| Pulsed hot hollow cathode, 1800°C, laser pulse in afterglow |
15 pg ml−1 Co, 10 pg ml−1 Ni | Solutions, SiO2 andAl2O3 powder | Lunyov et al.106 |
| Planar cathode (ref. 10) | 2 pg Pb | Solutions | Deavor et al.107 |
| Miniature stainless-steel hollow cathode - Cu vapour laser pumped dye laser | 2 fg Eu, 1.2 pg Y, 0.08 fg Tm | 400 ml | Davis et al.108 |
| nl-sized source - Cu vapour laser pumped dye laser | 0.03 pg Pb | 400 ml water | Davis et al.109 |
| Glow discharge and hollow cathode lamps - laser | Review | — | Sjostrom et al.110 |
4. Glow discharge mass spectrometry
Atomic mass spectrometry reviews generally deal with fundamental studies of the physical processes involved in the ion source, with instrumental developments and with analytical methodologies. Routine applications of glow discharge mass spectrometry for bulk analysis of high purity materials (generally metals) and semi-conductors or layer analysis are often discussed in the literature, whereas its application to solve environmental problems is only minimal.Glow discharge mass spectrometry is mainly a direct solid method and the ion sources used can be placed in two categories: Grimm type sources for flat samples and pin-shaped sample ion sources in which the sample comes into the glow discharge plasma. Thus, environmental samples have to be compacted for solid-state analysis and to be compatible with these sources.
Because of the lack of commercial rf-GDMS sources for the analysis of non-conductive samples, samples are generally compacted with a conductive binder such as high purity metal powders. Aluminium, silver, copper and tantalum are commonly used83,84 but one can also use bismuth, titanium, lead, tin, zinc or carbon powders.85,86 The results generally reveal a high dependance on the glow discharge conditions.87
Low melting-point materials such as Ga or In can be used to compact ashes or atmospheric dust as a direct deposit on a metal surface.88 In these cases, the sampling protocol used is the so-called secondary cathode technique. This method is applied to poorly- or non-conductive materials or compacted samples.89 The conductive metallic plate (more often tantalum or copper) exposed to the glow discharge plasma is sputtered, allowing the non-conductive parts of the cell (including the sample) to be covered by a thin layer. Argon ions can then sputter the non-conductive material.
There is a common requirement for these two sampling methods: a very high purity material is to be used as a binder and/or as a secondary cathode if one needs to have low blank levels. Moreover, this material must be considered with regard to the possible formation of molecular ions interfering with the analytes. For example, tantalum powder would generate TaO ions making gold determinations at low concentrations impossible.
Accordingly, multi-element determinations can be performed in soil samples90,91 without the problems of incomplete dissolution or contamination which often occur during chemical preparation. This technique was also used to determine Pd, Pt and Rh using aluminium powder to compact automobile catalyst exhaust deposits.92
Liquid samples have also been investigated. Solutions can permeate on a substrate in order to measure trace elements in petroleum93 or lead isotope ratios in waste oil.94 Some other applications are based on pumping the solution through a metal capillary,95 or electrochemically forming deposits of metals on a silver pin.96 Cementation from aqueous solutions can be performed on copper discs97 for determination of Pt and Ir from catalytic converters of combustion engines or for tetraethyllead determinations in water after solid phase micro-extraction.23
If the general analytical figures of merit for glow discharge mass spectrometry on high purity materials are in the low ng g−1 range, the limits of detection for environmental matrices depend on the associated material used for sampling. Most of the soil standards that have been analysed in GDMS give low ppm LODs with a few % RSDs.90
Radioisotope determinations in environmental samples is a growing field of interest for GD methods. The lowest detection limits (expected for the conventional methods) in GDMS radio-isotopic determinations in environmental samples like soils, sediments and vegetation ashes were probably obtained by Betti et al.84 The aim of that work was to combine both a secondary cathode and conductive binder for the sample preparation. High purity silver (6N) was used to compact 500 mg of material into a disc fitted with a tantalum secondary cathode. Results suggest that plutonium and thorium isotopes can be determined with high sensitivity at the pg g−1 level. Similar results were found for uranium when using a gold secondary cathode, particularly for the determination of 236U. Due to low barium and zirconium background levels, Cs and Sr could be determined as low as 0.2 pg g−1 and 0.01 pg g−1, respectively. The measurement repeatabilities do not exceed 10% and RSDs range from 9 to 30%.
These examples clearly demonstrate that even if direct current glow discharge mass spectrometry is mostly dedicated to high purity metals, good analytical performances can be obtained for environmental samples.
5. Future trends
In comparison to other plasma sources such as the ICP, glow discharges have lower technical and financial demands concerning source construction and power supply. Most glow discharges described so far are operated at reduced pressures so that vacuum pumping is needed, which for development of cheaper instrumentation is a certain disadvantage. Two very recent developments are the atmospheric electrolyte-as-cathode GD and the capillary GD, which can overcome this limitation.First, atmospheric electrolyte-as-cathode GD sources have been developed recently in which a liquid serves as the cathode of the discharge, so that direct analysis of continuously flowing liquids by GD spectrometry becomes possible.38 The authors claim that such a device may be successfully applied for continuous metal analysis of water and wastewater solutions.
For the second approach, Eijkel et al.99 used scaling theory to reduce electrode geometries by more than two orders of magnitude in comparison to the normal linear dimensions of a GD so that a continuous glow discharge could be generated in a capillary on a chip, as shown in Fig. 2. They demonstrated the application as an emission detector for volatile organic compounds at either reduced100 or atmospheric pressures.99 Although glow discharge dimensions are extremely small (see Fig. 2) the microchip plasma can be successfully applied for molecular emission detection and exhibits detection limits as low as 10−14 g s−1 for methane with a calibration curve that is linear over two orders of magnitude. Simple instrumentation, small detector size and high sensitivity make the device highly suitable for integration into micro-analysis systems for volatile compounds, which could lead either to the development of new GC detectors or to portable spectrometers for screening and field sampling in polluted areas. Concerning this application, glow discharges may become competitive to other plasma sources operated on a chip such as the microwave discharge developed by Engel et al.101
 | ||
| Fig. 2 Schematic of a plasma chip. Features of the 20 × 30 × 0.5 mm bottom plate are: 1, gas inlet; 2, gas outlet; 3, pressure sensor connection; 4, electrodes; and 5, electrode connection pads. Etched in the 14 × 30 × 0.5 mm top plate are: 6, plasma chamber; 7, inlet channel; 8, outlet channel, and (not indicated) the electrode chambers. (Reproduced from ref. 99 with permission.) | ||
Another important area of research where GD may have important analytical capabilities is the application as a tunable plasma source. Tunable sources can be operated in two different modes to detect either atoms, or molecules of mainly organic compounds, depending on the conditions chosen for source operation. Details of various sources for this purpose are given in a special issue of J. Anal. At. Spectrom., 2000, 15, showing that they can be used for both emission or mass spectrometry. Normally GDs are operated at moderate or high power to guarantee a complete dissociation of molecules. However, if they are operated at low power the gas temperature is low, so that soft ionisation without breaking molecular bonds can be realized. In emission spectroscopy GDs can serve as element detectors for C, N, O and H, whereas in mass spectrometry they can be used for identification of molecules. From this point of view, they are suited for direct (chemical) speciation of elements, without using a separation technique. What is elegant in this approach is that by simply changing the power both operational modes can be realized. Glow discharges can, therefore, be applied to solve analytical problems in application areas of organic mass spectrometry where formerly only electron impact ionisation, chemical ionisation, fast atom bombardment, thermo-spray or electro-spray ionisation (ESI) have been utilized as techniques for soft ionisation. Here the border lines between inorganic and organic analysis are becoming blurred. Many innovative organic mass spectrometers equipped with ESI still have an additional atmospheric pressure ionisation mode, by use of a discharge very similar to a GD, for enhanced detection of difficult-to-ionise organic compounds, but they are mostly not operated in an atomic mode. Examples for such applications are described in the work of Chambers et al.102 who used an atmospheric pressure (AP) glow discharge for monitoring trace organic compounds such as nitrotoluene in ambient air or in the work of Zhao et al.103 who used a GD coupled to a TOF-MS to detect small organic molecules including biological neurotransmitters, drugs, pesticides, amino-acids and explosives. The detection limits achieved are typically in the low femtomole region. Both examples demonstrate that even in mass spectrometry new plasma sources may become an important analytical tool.
6. Conclusion
The success of new methods and procedures such as the application of glow discharges for environmental analysis is always strongly dependent on competing methods. For liquid samples ICP-AES and ICP-MS techniques are more robust, powerful, sensitive and flexible, but more expensive than GD sources too. Soils and particulate matter can be directly analysed by using sample introduction either by electrothermal vaporization (ETV) or by laser ablation in combination with ICP-MS. For microanalysis strong competition is coming from conventional methods such as graphite furnace-AAS, ETV-ICP-MS or total reflection X-ray fluorescence (TXRF). Again, except for flame AAS, all these techniques are more expensive, so that dedicated instrumentation using less expensive plasma sources can become even nowadays more attractive as emission or ion sources for some niche applications, if—and this is a prerequisite for any analytical method—they become commercially available.Acknowledgements
The review was written within the frame of the Thematic Network `Glow Discharge Spectroscopy for Spectrochemical Analysis' financed by the European Union under contract SMT4-CT98-7517.References
- F. Paschen, Ann. Phys. (Leipzig), 1916, 50, 901 Search PubMed.
- W. Grimm, Spectrochim. Acta, Part B, 1968, 23, 443 CrossRef CAS.
- K. Laqua, in: Analytiker Taschenbuch, Band 10, ed. H. Günzler, R. Borsdorf, W. Fresenius, W. Huber, H. Kelker, J. Lüderwald, G. Tülg and H. Wisser, Springer-Verlag, Berlin, 1991, 297–349. Search PubMed.
- R. Mavorodineanu, J. Res. Natl. Bur. Stand., 1984, 89, 143 Search PubMed.
- J. A. C. Broekaert, J. Anal. At. Spectrom., 1987, 2, 537 RSC.
- S. Caroli, J. Anal At. Spectrom., 1987, 2, 661 RSC.
- R. K. Marcus, Spectroscopy, 1992, 7, 12 Search PubMed.
- R. K. Marcus, Glow Discharge Spectroscopies, Plenum Ltd., London, 1993. Search PubMed.
- R. K. Marcus, J. Anal. At. Spectrom., 1996, 11, 821 RSC.
- R. K. Marcus, J. Anal. At. Spectrom., 1994, 9, 1029 RSC.
- R. K. Marcus, J. Anal. At. Spectrom., 1993, 8, 935 RSC.
- J. A. C. Broekaert, Fresenius' J. Anal. Chem., 1996, 355, 847 CAS.
- A. Bengtson, Spectrochim. Acta, Part B, 1985, 40, 631 CrossRef.
- A. Bogaerts and R. Gijbels, Spectrochim. Acta, Part B, 1998, 53, 1 CrossRef.
- F. Leis and E. B. M. Steers, Spectrochim. Acta, Part B, 1994, 49, 289 CrossRef.
- S. Caroli, O. Senofonte, S. Caimi and P. Karpati, J. Anal. At. Spectrom., 1996, 11, 773 RSC.
- S. J. O'Gram, J. R. Dean, W. R. Tomlinson and J. Marshall, Anal. Chim. Acta, 1994, 294, 95 CrossRef CAS.
- J. You, M. A. Dempster and R. K. Marcus, Anal. Chem., 1997, 69, 3419 CrossRef CAS.
- S. G. Schroeder and G. Horlick, Spectrochim. Acta, Part B, 1994, 49, 1759 CrossRef.
- S. Caroli, E. Beccaloni, L. Fornarelli, P. Delle-Femmine, M. Mancini, M. Gallorini and G. Zaray, Acta Chim. Hung., 1991, 128, 507 Search PubMed.
- R. K. Marcus, M. A. Dempster, T. E. Gibeau and E. M. Reynolds, Anal. Chem., 1999, 71, 3061 CrossRef CAS.
- M. Dogan, J. Serb. Chem. Soc., 1990, 55, 63 Search PubMed.
- J. Czachow, Chem. Anal., 1987, 32, 531 Search PubMed.
- M. R. Winchester, J. C. Travis and M. L. Salit, Spectrochim. Acta, Part B, 1993, 48, 1325 CrossRef.
- J. A. C. Broekaert, K. R. Brushwyler, C. A. Monnig and G. M. Hieftje, Spectrochim. Acta, Part B, 1990, 45, 769 CrossRef.
- M. Outred, M. H. Ruemmeli and E. B. M. Steers, J. Anal. At. Spectrom., 1994, 9, 381 RSC.
- K. Wagatsuma, K. Hirokawa and N. Yamashita, Anal. Chim. Acta, 1996, 324, 147 CrossRef CAS.
- A. R. Raghani, B. W. Smith and J. D. Winefordner, Spectrochim. Acta, Part B, 1996, 51, 399 CrossRef.
- H. J. Kim, Y. S. Park, G. H. Lee, K. B. Lee, H. Kim and J. S. Kim, Microchem. J., 1998, 59, 399 CrossRef CAS.
- W. W. Harrison, C. M. Barshick, J. A. Klingler, P. H. Ratliff and Y. Mei, Anal. Chem., 1990, 62, 943A CAS.
- W. Hang, W. O. Walden and W. W. Harrison, Anal. Chem., 1996, 68, 1148 CrossRef CAS.
- C. K. Pan and F. L. King, Appl. Spectrosc., 1993, 47, 2096 Search PubMed.
- E. B. Becerra, J. Deavor and J. D. Winefordner, Spectrosc. Lett., 1992, 25, 1257 CAS.
- H. Z. Wrembel, Talanta, 1983, 30, 481 CrossRef CAS.
- T. Cserfalvi and P. Mezei, J. Anal. At. Spectrom., 1994, 9, 345 RSC.
- T. Cserfalvi and P. Mezei, Fresenius' J. Anal. Chem., 1996, 355, 813 CAS.
- C. J. Herring and E. H. Piepmeier, Anal. Chem., 1995, 67, 878 CrossRef CAS.
- Y. S. Park, S. H. Ku, S. H. Hong, H. J. Kim and E. H. Piepmeier, Spectrochim. Acta, Part B, 1998, 53, 1167 CrossRef.
- T. K. Starn, R. Pereiro and G. M. Hieftje, Appl. Spectrosc., 1993, 47, 1555 Search PubMed.
- R. Pereiro, T. K. Starn and G. M. Hieftje, Appl. Spectrosc., 1995, 49, 616 Search PubMed.
- J. A. C. Broekaert, T. K. Starn, L. J. Wright and G. M. Hieftje, Spectrochim. Acta, Part B, 1998, 53, 1723 CrossRef.
- G. Centineo, M. Fernández, R. Pereiro and A. Sanz-Medel, Anal. Chem., 1997, 69, 3702 CrossRef CAS.
- H. J. Kim, C. H. Cho, H. Kim and S. C. Lee, Analyst, 1998, 123, 607 RSC.
- C. Feldman, Anal. Chem., 1979, 51, 664 CrossRef CAS.
- K. Matsumoto, T. Ishiwatari and K. Fuwa, Anal. Chem., 1984, 56, 1545 CrossRef CAS.
- J. A. C. Broekaert, Appl. Spectrosc., 1995, 49, 12A Search PubMed.
- J. Rodríguez, R. Pereiro and A. Sanz-Medel, J. Anal. At. Spectrom., 1998, 13, 911 RSC.
- C. Feldman and D. A. Batistoni, Anal. Chem., 1977, 49, 2215 CrossRef CAS.
- N. G. Orellana-Velado, R. Pereiro and A. Sanz-Medel, J. Anal. At. Spectrom., 1998, 13, 905 RSC.
- K. Kitegawa, S. Kanoh, K. Ohta and M. Yanagisawa, Anal. Sci., 1988, 4, 153 Search PubMed.
- S. Caroli, O. Senofonte, N. Violante and N. Astrologo, J. Anal. At. Spectrom., 1988, 3, 887 RSC.
- Z. Szilvassy-Vamos, A. Buzasi-Gyorfi, Z. Pasztor and E. Hazi, Acta Chim. Hung., 1991, 128, 463 Search PubMed.
- F. Chen and J. C. Williams, Anal. Chem., 1990, 62, 489 CrossRef CAS.
- J. Borkowska-Burnecka and W. Zyrnicki, Spectrosc. Lett., 1993, 26, 137 CAS.
- H. Falk, E. Hoffmann, C. Lüdke and K. P. Schmidt, Spectrochim. Acta, Part B, 1986, 41, 853 CrossRef.
- H. Falk, E. Hoffmann, C. Lüdke, J. M. Ottaway and S. K. Giri, Analyst, 1983, 108, 1459 RSC.
- D. Demeny and B. Radziuk, Microchem. J., 1992, 46, 291 CrossRef.
- K. Dittrich, H. Fuchs, H. Berndt, J. A. C. Broekaert and G. Schaldach, Fresenius' J. Anal. Chem., 1990, 336, 303 CrossRef CAS.
- J. M. Harnly, D. L. Styris and N. E. Ballou, J. Anal. At. Spectrom., 1990, 5, 139 RSC.
- J. A. C. Broekaert, Bull. Soc. Chim. Belges, 1976, 85, 755 Search PubMed.
- S. Caroli, O. Senofonte, M. G. Del-Monte-Tamba, I. B. Brenner and M. Dvorochek, Spectrochim. Acta, Part B, 1993, 48, 877 CrossRef.
- Z. Szilvassy-Vamos, J. Lazar, M. Horvath and A. Kertai-Simon, J. Anal. At. Spectrom., 1990, 5, 705 RSC.
- J. Y. Ryu, R. L. Davis, J. C. Williams and J. C. Williams Jr., Anal. Chem., 1988, 42, 1379 CAS.
- C. A. Morgan, C. L. Davis, B. W. Smith and J. D. Winefordner, Appl. Spectrosc., 1994, 48, 261 Search PubMed.
- J. L. Tseng, J. C. Williams, R. B. Bartlov, S. T. Griffin and J. C. Williams Jr., Anal. Chem., 1991, 63, 1933 CrossRef CAS.
- X. Cai and J. C. Williams, Appl. Spectrosc., 1995, 49, 890 Search PubMed.
- L. Papp and O. Banhidi, J. Anal. At. Spectrom., 1998, 13, 653 RSC.
- S. C. Lee, K. S. Choi, E. H. Son and Y. J. Sim, Anal. Sci. Technol., 1998, 11, 167 Search PubMed.
- K. Fujiwara, E. P. Wagner II, B. W. Smith and J. D. Winefordner, Anal. Lett., 1996, 29, 1985 CAS.
- J. You, J. C. Fanning and R. K. Marcus, Anal. Chem., 1994, 66, 3916 CrossRef CAS.
- J. You, P. A. Depalma Jr. and R. K. Marcus, J. Anal. At. Spectrom., 1996, 11, 483 RSC.
- G. G. Sikharulidze and A. E. Lezhnev, J. Anal. Chem., 1998, 53, 375 Search PubMed.
- L. Puig and R. Sacks, Appl. Spectrosc., 1989, 43, 801 Search PubMed.
- K. C. Ng, A. H. Ali and J. D. Winefordner, Spectrochim. Acta, Part B, 1991, 46, 309 CrossRef.
- N. G. Orellana-Velado, R. Pereiro and A. Sanz-Medel, J. Anal. At. Spectrom., in the press. Search PubMed.
- H. Falk, E. Hoffmann and C. Lüdke, Prog. Anal. Spectrosc., 1988, 11, 417 Search PubMed.
- D. C. Baxter, R. Nichol and D. Littlejohn, Spectrochim. Acta, Part B, 1992, 47, 1155 CrossRef.
- K. Dittrich, T. Franz and R. Wennrich, Spectrochim. Acta, Part B, 1994, 49, 1695 CrossRef.
- K. Dittrich, T. Franz and R. Wennrich, Spectrochim. Acta, Part B, 1995, 50, 1655 CrossRef.
- C. L. Chakrabarti, K. L. Headrick, P. C. Bertels and M. H. Back, J. Anal. At. Spectrom., 1988, 3, 713 RSC.
- A. A. Ganeyev and S. E. Sholupov, Spectrochim. Acta, Part B, 1998, 53, 471 CrossRef.
- C. M. Barshick, R. W. Shaw, J. P. Young and J. M. Ramsey, Anal. Chem., 1995, 67, 3814 CrossRef CAS.
- L. L. Burton and G. Horlick, Spectrochim. Acta, Part B, 1992, 47, E1621 CrossRef.
- M. Betti, S. Giannarelli, T. Hiernaut, G. Rasmussen and L. Koch, Fresenius' J. Anal. Chem., 1996, 355, 642 CAS.
- N. Jakubowski, D. Stuewer and G. Toelg, Spectrochim. Acta, Part B, 1991, 46, 155 CrossRef.
- C. M. Barshick, S. A. Barshick, M. L. Mohill, P. F. Britt and D. H. Smith, Rapid Commun. Mass Spectrom., 1996, 10, 341 CrossRef CAS.
- W. Schelles, S. De Gendt, K. Maes and R. E. Van Grieken, Fresenius' J. Anal. Chem., 1996, 355, 858 CAS.
- W. Schelles, K. J. R. Maes, S. De Gendt and R. E. Van Grieken, Anal. Chem., 1996, 68, 1136 CrossRef CAS.
- W. Schelles and R. E. Van Grieken, J. Anal. At. Spectrom., 1997, 12, 49 RSC.
- J. Teng, C. M. Barshick, D. C. Duckworth, S. J. Morton, D. H. Smith and F. L. King, Appl. Spectrosc., 1995, 49, 1361 Search PubMed.
- D. C. Duckworth, C. M. Barshick and D. H. Smith, J. Anal. At. Spectrom., 1993, 8, 875 RSC.
- D. M. Wayne, J. Anal. At. Spectrom., 1997, 12, 1195 RSC.
- C. M. Barshick, D. H. Smith, J. H. Hackney, B. A. Cole and J. W. Wade, Anal. Chem., 1994, 66, 730 CrossRef CAS.
- C. M. Barshick, D. H. Smith, J. W. Wade and C. K. Bayne, J. Anal. At. Spectrom., 1994, 9, 83 RSC.
- G. G. Sikharulidze and A. E. Lezhnev, 1996 Winter Conference on Plasma Spectrochemistry, Fort Lauderdale, Florida, January 8–13, 1996, p. 232. Search PubMed.
- D. A. Day, A. L. Zook, C. M. Barshick and K. R. Hess, Microchem. J., 1997, 55, 208 CrossRef CAS.
- N. Jakubowski, D. Stuewer and G. Toelg, Spectrochim. Acta, Part B, 1991, 46, 155 CrossRef.
- L. R. Riciputi, D. C. Duckworth, C. M. Barshick and D. H. Smith, Int. J. Mass Spectrom. Ion Processes, 1995, 146/147, 55 CrossRef CAS.
- J. C. T. Eijkel, H. Stoeri and A. Manz, J. Anal. At. Spectrom., 2000, 15, 297 RSC.
- J. C. T. Eijkel, H. Stoeri and A. Manz, Anal. Chem., 2000, 71, 2600 CrossRef CAS.
- U. Engel, A. M. Bilgic, O. Haase, E. Voges and J. A. C. Broekaert, Anal. Chem., 2000, 72, 193 CrossRef CAS.
- D. M. Chambers, S. A. McLuckey and G. L. Glish, Anal. Chem., 1993, 65, 778 CrossRef CAS.
- J. Zhao, J. Zhu and D. M. Lubman, Anal. Chem., 1992, 64, 1426 CAS.
- M. Glick, B. W. Smith and J. D. Winefordner, Anal. Chem., 1990, 62, 157 CrossRef CAS.
- J. B. Womack, E. M. Gessler and J. D. Winefordner, Spectrochim. Acta, Part B, 1991, 46, 301 CrossRef.
- O. S. Lunyov and S. V. Oshemkov, Spectrochim. Acta, Part B, 1992, 47, 71 CrossRef.
- J. P. Deavor, E. Beccera, B. W. Smith and J. D. Winefordner, Can. J. Appl. Spectrosc., 1993, 38, 7 Search PubMed.
- C. L. Davis, B. W. Smith, M. A. Bolshov and J. D. Winefordner, Appl. Spectrosc., 1995, 49, 907 Search PubMed.
- C. L. Davis, B. W. Smith and J. D. Winefordner, Microchem. J., 1995, 52, 383 CrossRef CAS.
- S. Sjostrom and P. Mauchien, Spectrochim. Acta Rev., 1993, 15, 153 Search PubMed.
| This journal is © The Royal Society of Chemistry 2000 |