Radial basis function networks for obtaining long range dispersion coefficients from second virial data
M. B. de Almeidaa, A. P. Bragaa, J. P. Bragab, J. C. Belchiorb and G. F. G. Yareda
aDepartamento de Engenharia Eletrônica–EEUFMG, Universidade Federal de Minas Gerais Pampulha, 31.270-901, Belo Horizonte, MG, Brazil
bDepartamento de Química–ICEx, Universidade Federal de Minas Gerais Pampulha, 31.270-901, Belo Horizonte, MG, Brazil
First published on UnassignedUnassigned22nd December 1999
Abstract
A new approach, consisting of using radial basis function networks to obtain the long-range part of diatomic potential energy functions from simulated second virial coefficients, is presented. From these simulated data the artificial neural network was able not only to learn but also to predict properties for systems that were not considered during the training process. Fifteen different diatomic systems were chosen and a leave-three-out approach was applied. A cross-validation procedure was used for analysing the network generalization properties and the relative average error achieved for the three systems was about 5%, providing accurate data for the long-range dispersion coefficients.
1. Introduction
The inversion of potential energy functions from experimental data is a very important step for scientists working in the molecular dynamics area. This inversion procedure will complement ab initio and model calculations for the interaction potential, adding to and correcting the existing information. The problem can be handled by interpolating the potential in order to fit the available data or by handling the data to produce the potential energy function.Methods for extracting the potential energy surface from phase shifts and cross-sections, using quantum and semi-classical methods, have been reviewed.1 Inverted potentials are presented for data using elastic and inelastic atomic collisions and for rotational excitation in atom–molecule collisions. The semi-classical RKR method, not treated in the above review,1 could also be used to obtain the discrete part of the potential from spectroscopic information.2
A systematic approach, of general applicability, was developed by Ho and Rabitz.3 The inversion procedure is formulated in terms of functional derivatives relating dynamic observables with the potential energy function. This approach, which is applicable to one dimension or several dimensions, involves the solution of a Fredholm integral equation of first order. The solution of this integral equation gives rise to an ill-posed problem4 which can be solved by a variety of algorithms,5 the two most common being the Tikhonov regularization6 and decomposition into sub-spaces.7 In the variational constraint approach,8 as in the Tikhonov regularization, extra information is used to obtain the inverted potential energy surface. Nevertheless, the constraint used in the Tikhonov regularization has the purpose of removing a singularity by smoothing the solution, whereas in the variational approach the constraint is used to add information on the potential.
Using the Tikhonov regularization and decomposition into sub-spaces, and handling also a Fredholm integral equation of first order, we were able to invert simulated second virial coefficient data to obtain the repulsive part of the potential energy surface,9 with or without noise in the simulated data. This scheme is also of general applicability and could be also used to obtain the long range part of the potential. In the present work the potential energy function for a rare gas diatomic molecule was obtained using neural networks.
Artificial neural networks (ANNs),10 which are universal function approximators,11,12 do not suffer from this curse of dimensionality problem, having the cost of the overall network increasing only linearly with the number of input variables. Particularly in chemistry, solutions of higher dimensional problems are known.13 ANNs have also recently been applied to atomic and molecular collisions by showing, in a simple way, that the atomic and molecular rainbow trajectories can be obtained with high accuracy.14 That approach was based on the multilayer perceptron15 network trained with the back-propagation learning algorithm,16 which is within the class of stochastic approximation methods.17
Several ANN topologies and several learning algorithms are known to solve the multidimensional function approximation problem.10 This paper aims at describing a solution for the inversion problem with a curve fitting approach using radial basis function networks (RBFs). Input data are expanded into the hidden layer space formed by the basis non-linear functions, aiming at proving a more tractable problem for the output nodes.17,18 With this approach, the curve fitting problem can be regarded as a linear optimization problem, although in some cases non-linear procedures are needed for providing better generalization.19
In this work, radial basis functions networks are used to correlate the properties of rare gas dimers with thermodynamic data, the second virial coefficient, by first learning about 12 systems and then predicting, in an inverse way, the dispersion coefficient for the three remaining systems. Although this inversion procedure is not based on handling the experimental data directly, the word inversion will be used in this paper as the actual scheme will also give a potential from simulated data. The potential used by Huxley et al.20 was considered for simulating the data to be used in the neural network. In their work, a functional form was taken and the parameters were fitted to 43 van der Waals diatomic systems. These potentials were assumed as reference data, i.e., exact potentials, in their work. Fifteen systems belonging to the same class, i.e., rare gas diatomic molecules, were chosen from the whole set of data for training the RBF network. The output data for the neural network were the potential parameters for the long range contribution while the input data were taken as the parameters in the simulated second virial coefficients.
Test and validation sets can also be picked up from the whole training set. To provide cross-validation, 12 diatomic systems were chosen randomly to train the network and three were left out for validation. The RBF was able to predict the second virial coefficients for the three-left-out systems. Finally, the interatomic potential energy functions obtained with the present inversion were compared with those fitted by Huxley et al.20 The relative error was less than 5%, which can be considered as a very satisfactory inversion procedure.
2. Theoretical formulation
Within a second order approximation of the density, ρ, the relation between pressure, p, volume, V, and temperature, T, can be written as21 | (1) |
where k is the Boltzmann constant and B(T) is the second virial coefficient. For central forces this coefficient is related to the interaction potential, U(r), by
 | (2) |
For a given potential energy function it is a simple task to calculate the second virial coefficient. On the other hand, if the data for the second virial coefficient are available, it is considerably more difficult to obtain the interaction potential.
The first systematic study to obtain the intermolecular potential from second virial data, for a single system, was performed by Keller and Zumino in 1959.22 This approach, which transforms the problem into a Fredholm integral equation of first kind, treats equally the short and long range parts of the interaction potential. The first application of this scheme was by Jonah and Rowlinson,23 where a Born–Mayer-type potential was proposed so the integral equation could be inverted analytically. For this specific function the inverse transform is in fact a Laplace transform. Maitland and Smith24 transformed the Keller and Zumino equation into a matrix representation and, using dynamics programming, were able to invert second virial data to obtain the intermolecular potential. Nevertheless this technique was not completely satisfactory, as pointed out by the above authors, who concluded that ‘... it is necessary to investigate other methods capable of giving information about potential energy function from second virial coefficient measurements’.
Obtaining the intermolecular potential from second virial coefficients is in fact an ill-posed problem as described in a previous paper9 where a single system was treated. In the present work, using radial basis function networks, the approach is different since more systems are being considered simultaneously. Therefore, one does not expect, on average, that the present approach will give better inverted potentials than those obtained previously.9 In fact, in this later work, when using data without noise, exact numerical results were obtained for the inverted potential.
The potential energy function,20
 | (3) |
 | (4) |
| System | d0 | d1 | d2 | d3 | d4 | d5 | d6 |
|---|---|---|---|---|---|---|---|
| HeHe | 19.65 | −0.8029 | −0.5974 | 6.975(−2) | −5.165(−3) | 1.949(−4) | −2.798(−6) |
| HeNe | 20.45 | −3.625 | −1.331 | 0.2688 | −3.903(−2) | 3.075(−3) | −1.003(−4) |
| HeAr | 30.48 | −9.361 | −2.323 | 0.5062 | −9.126(−2) | 1.032(−2) | −6.464(−4) |
| HeKr | 35.97 | −11.47 | −2.939 | 0.6409 | −0.1175 | 1.315(−2) | −8.245(−4) |
| HeXe | 46.55 | −13.01 | −4.317 | 1.327 | −0.3252 | 4.573(−2) | −2.762(−3) |
| NeNe | 18.80 | −10.65 | −2.814 | 1.020 | −0.3577 | 8.180(−2) | −1.087(−2) |
| NeAr | 19.33 | −27.29 | −5.303 | 1.902 | −0.8417 | 0.2194 | −2.562(−2) |
| NeKr | 22.10 | −31.89 | −6.658 | 2.458 | −1.079 | 0.2809 | −3.277(−2) |
| NeXe | 21.93 | −45.11 | −8.262 | 3.442 | −2.284 | 1.0291 | −0.2261 |
| ArAr | −26.28 | −101.2 | −18.27 | 1.896 | −0.9728 | 4.539 | −2.093 |
| ArKr | −49.04 | −138.8 | −23.55 | 9.825 | 8.064 | 1.573 | −11.70 |
| ArXe | −74.37 | −186.9 | −34.78 | 10.38 | 9.586 | −0.1242 | −15.28 |
| KrKr | −85.99 | −195.7 | −30.91 | 24.33 | 17.19 | −10.05 | −25.27 |
| KrXe | −131.9 | −271.5 | −39.08 | 49.55 | 29.38 | −33.70 | −47.29 |
| XeXe | −198.9 | −364.7 | −21.32 | 82.92 | 16.32 | −47.37 | −41.69 |
The Boyle temperature plays an important role when handling second virial data from which the potential energy function is to be obtained. Above this temperature the repulsive forces will dominate the process, whereas below it attractive forces will be more important. Since the present work is concerned with the inversion of the long range part of the potential, through the dispersion coefficients, special care must be taken to fit the virial data to a range of temperature that includes the Boyle temperature. Otherwise it will be more difficult for the ANNs to correlate input and output. The compromise to have the Boyle temperature within the range of simulated data together with 4–6 significant figures in the fitted data was taken into account in the simulated second virial coefficient.
3. Radial basis function networks
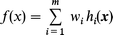
The great popularity of ANNs was certainly due to the description of a general algorithm for training the well known multi-layer perceptron networks (MLP)15,16 and their ability to approximate any arbitrary multivariate function.11,12 This class of ANNs may have any arbitrary number of inputs and layers, with nodes normally performing non-linear functions. RBFs25 have a network topology which is similar to the classical MLP. Although RBFs and MLPs differ in many aspects, the basic idea in both cases is to provide a non-linear mapping between the input layer and the intermediate, or hidden, layers in order to make data tractable to the output layer. MLPs are normally used in both classification and regression problems, whereas work in RBFs is normally focused on the latter.Regression problems are usually defined on finding a suitable function f(x) that fits the set of sampled data Γ=(xi, yi)ip=1, where p is the number of samples, xi is the input vector and yi is the corresponding output. The estimated function f(x) is expected to minimize not only the error [f (xi)−yi]2,but also to interpolate the intermediate pairs (xj, yj) not provided in Γ, and this is called generalization in ANN parlance. The term suitable above was italicized in order to emphasize the fact that this problem has multiple solutions, which makes it naturally ill-posed.4,5 This suggests the use of regularization theory17,26 to restrict the search in the direction of the most suitable solution. In function approximation problems, regularization is normally associated with a smoothness constraint added to the cost function ε=∑i=1p [f(xi)−yi]2 in the search for the most appropriate solution.6,27
In the linear RBF model focused upon in this paper, the function f(x) is expressed as a linear combination of hidden functions:
 | (5) |
 | ||
| Fig. 1 General neural network for inverting long range dispersion coefficients. Representation for only the C6 coefficient. | ||
Radial basis functions are those which, typically, have their responses decreasing or increasing monotonically with the distance of the input vector to a fixed point in the input space called the function centre. Quadratic and Gaussian functions are examples of radial basis functions and the general form of Gaussian functions can be written as
| h(x)=e(−∣x−x0∣2)/σ2) | (6) |
If the parameters of the hidden functions, their centres and radius are not allowed to change, the problem of approximating f (x) is simplified to the linear problem of finding the weights wi of eqn. (5). On the other hand, if they are allowed to change, the problem becomes non-linear with a larger number of free parameters to be adjusted. In both situations, linear algebra theory is used as the basic tool for finding the approximation for f(x). This is claimed by the followers of the RBF approach as an advantage over MLPs, since this avoids the use of computational intensive gradient descent back-propagation16 as used in MLPs. The general problem of training RBFs is that the solution of the linear system resulted from the cost function for f(x) may fall within the class of ill-posed problems, which require more elaborate numerical methods for its solution. This can be more easily understood by developing the following equations. The general cost function for f(x) is given by
 | (7) |
A common regularization cost function used in ANNs is ξ( f)=12∑i=1mλiwi2, where λi is the regularization constant, which makes the balance between the two terms of the cost function ε(f ). The regularization function aims at penalizing larger values of the weight terms wi, and is called weight decay28 in ANNs theory and global ridge regression29 in applied regression analysis. This is used in ANNs as a technique for pruning network weights and providing an approximation model with fewer free parameters. This is aimed at obtaining a balance between the bias and variance30 of the model, which is expected to result in a network that is not too flexible to cause over-fitting of the sampled data Γ=(xi, yi)ip=1. The balance between bias and variance is in fact a dilemma in ANN design and some alternatives to weight decay are also found in the literature.31
Global ridge regression was used in the present paper as one of the training techniques for improving RBF performance. The resulting cost function is presented as
 | (8) |
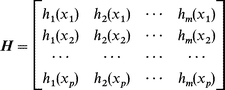
| w=(HTH+Λ)−1HTy | (9) |
 | (10) |
 | (11) |
The simplest solution to eqn. (9) occurs when m=p, which is a result of allocating one hidden function to each training pair (xi, yi) with fixed radius and centre at x. The smoothness criteria would be guaranteed by the smoothness of the hidden function itself, even though a poor generalization can occur in this situation. To improve the approximation, three approaches for training are used in this paper: optimal weight vector (OWV), forward selection (FS) and global ridge regression (GRR), as described by Orr.19 The results of these three methods will be considered in the Discussion section. The OWV solution does not use regularization, i.e., Λ=0. For the GRR method, global generalization parameters are considered, e.g., Λ=λI, where I is the identity matrix. The FS algorithm is a constructive approach which starts from a single hidden node and allocates new units in the same layer according to the network performance. Similar network growing methods, such as the cascade correlation algorithm described by Fahlman and Lebiere32 are well known in the literature on neural networks. The basic difference betwen FS and cascade correlation is in the way in which the network is constructed. In FS, nodes are added within the single hidden layer, whereas the cascade correlation builds the network in successive layers.
4. Results and discussion
The second virial data were generated for the rare gas diatomic molecules HeHe, HeNe, HeAr, HeKr, HeXe, NeNe, NeAr, NeKr, NeXe, ArAr, ArKr, ArXe, KrKr, KrXe and XeXe. For each system and for each individual dispersion coefficient, C6, C8 and C10, an ANN was considered. These networks had as the inputs the dn coefficients, given in Table 1, and as output the corresponding dispersion coefficient Ci, as can be seen in Fig. 1 for C6.As discussed earlier in this paper, three different training strategies were used for finding a solution for the network, OWV, GRR and FS. For each of these methods, the optimum variance of the basis functions were obtained by calculating the error of the overall network within a range of possible values. The optimum value was selected as the one for which the error was a minimum. The responses for each of the networks as a function of the variance of the hidden functions are presented in Fig. 2. As can be observed, the optimum value for the variances is near 0.6. This value was then used as a parameter for the three networks.
 | ||
| Fig. 2 Error as a function of the variance of the radial functions for C6, C8 and C10 from the top to the bottom, respectively. | ||
A preliminary analysis of C6 coefficients was carried out considering 10–14 systems to be used in the training set. Table 2 gives the relative average error for this coefficient. As can be observed, the error in predicting this coefficient increases as the number of systems used in the training set decreases. This indicates how many data should be considered for training the ANNs. Twelve systems were taken for training the neural network, although this is an arbitrary choice. Nevertheless, one observes that for the whole set (14 systems) in Table 2, the coefficient obtained (C6) is exact, as expected, since one has used the available data for training and prediction. On the other hand, on taking out more systems the error increases very rapidly. Therefore, we decided to consider 12 systems during the training set. This analysis was not performed for the C8 and C10 coefficients since a similar result may be expected.
| Number of systems | Error (%) |
|---|---|
| 14 | 0.02 |
| 13 | 0.18 |
| 12 | 0.16 |
| 11 | 0.34 |
| 10 | 0.64 |
The exact and inverted C6, C8 and C10 dispersion coefficients are compared in Tables 3, 4 and 5, respectively. Although the relative average error increases from C6 to C10, it is important to point out that the contribution of these coefficients decreases in the same way. The relative average error for all coefficients is about 15%. For C6, which will contribute more than the other coefficients, the relative average error is about 3%, which can be considered satisfactory. This error can be accepted since then the potential obtained reproduces the exact data which were taken as a reference. That is not the case if a 15% error is considered. Moreover, for the ArKr system, the inversion of all the dispersion coefficients was very satisfactory with an error of about 0.05%. According to Table 4, which corresponds to C8, the relative average error increased and this may be attributed to the contribution of this term to the long range force which is smaller than the previous one. Therefore, one can expect that such errors in Table 4 would not affect much the whole long range forces for the inverted coefficient. It is important to emphasize, however, that for the third system the relative error was less than 0.1%, which is relatively small for all coefficients. The results for the C10 coefficients again show a relative error slightly greater than those observed in Table 4, but the regular behaviour of all data was verified. However, a successful inversion is achieved only if the inverted dispersion coefficients, which correspond to the whole long range forces, are obtained. The inverted long range potentials, when all inverted dispersion coefficients are taken into account, are compared in Fig. 3. As can be observed, the results are almost quantitative and improve according to the behaviour of the relative errors in Tables 3–5.
| System | Exact | Inverted | Error (%) |
|---|---|---|---|
| HeNe | 1.8547 | 1.7496 | 5.7 |
| HeKr | 8.4849 | 8.0907 | 4.6 |
| ArKr | 57.064 | 57.082 | 0.032 |
| System | Exact | Inverted | Error (%) |
|---|---|---|---|
| HeNe | 6.2245 | 3.7207 | 40.0 |
| HeKr | 45.195 | 52.748 | 17.0 |
| ArKr | 401.58 | 401.36 | 0.055 |
| System | Exact | Inverted | Error (%) |
|---|---|---|---|
| HeNe | 24.365 | 36.996 | 52.0 |
| HeKr | 176.18 | 147.25 | 16.0 |
| ArKr | 3725.0 | 3727.0 | 0.053 |
 | ||
| Fig. 3 Comparison between exact or reference data (full line) and inverted (dashed line) long range potential (C6/r6+C8/r8+C10/r10). From the top to the bottom the results correspond to HeNe, HeKr and ArKr. | ||
5. Conclusions
An inversion procedure, using artificial intelligence neural networks, was presented. Simulated second virial coefficients were inverted to obtain, with relative accuracy, the long range part of the potential for rare gas diatomic molecules. The above procedure is general and can be also used to invert other types of data. Experimental measurements more sensitive to the potential can be used, such as rainbow positions, angular distributions, state-to-state differential and total cross-sections. This may provide more accurate inverted potential energy functions, for either atomic or molecular systems, and will certainly improve existing interaction potentials.Conclusions regarding the general applicability and performance of the ANN method presented here should be treated with care since the systems used are chemically similar, i.e., the molecules are formed only with the rare gas atoms. Considering more systems in the training set, large errors may appear since in this case it is more difficult for ANNs to correlate input and output data. This was, in fact, confirmed by us when using more systems instead of 15 systems. Nevertheless, with a previous selection, using chemical information or statistical analysis, the above procedure based on ANNs shows a powerful technique to perform inversion of experimental data where even polyatomic molecules may be considered.
Acknowledgements
This work was supported by CNPq and FAPEMIG, Brazil.References
- U. Buck, Comput. Phys. Rep., 1986, 5, 1 Search PubMed.
- R. Rydberg, Z. Phys., 1931, 73, 376 Search PubMed; R. Rydberg, Z. Phys., 1933, 80, 514 Search PubMed; O. Klein, Z. Phys., 1932, 76, 226 Search PubMed; A. L. G. Rees, Proc. Phys. Soc., 1947, 59, 998 Search PubMed.
- T. S. Ho and H. Rabitz, J. Phys. Chem., 1993, 97, 13447 CrossRef CAS.
- J. Hadamard, Le Problème de Cauchy et les Équations aux Dérivee Partielle Linéaries Hyperboliques, Hermann, Paris, 1932. Search PubMed.
- P. C. Hansen, Rank-Deficient and Discrete Ill-Posed Problems, SIAM, Philadelphia, PA, 1997. Search PubMed.
- A. N. Tikhonov and V. Arsénine, Méthodes de Résolution de Problemes Mal Posés, Mir, Moscow, 1974. Search PubMed.
- B. Noble and J. W. Daniel, Applied Linear Algebra, Prentice-Hall, Englewood Cliffs, NJ, 1988. Search PubMed.
- D. H. Zhang and J. C. Light, J. Chem. Phys., 1995, 103, 9713 CrossRef CAS.
- N. H. T. Lemes, J. P. Braga and J. C. Belchior, Chem. Phys. Lett., 1998, 296, 233 CrossRef CAS.
- C. Bishop, Neural Networks for Pattern Recognition, Oxford University Press, Oxford, 1995. Search PubMed.
- G. Cybenko, Math. Control Signals Syst., 1989, 2, 303 Search PubMed.
- K. Hornik, M. Stinchcombe and H. White, Neural Networks, 1989, 2, 359 CrossRef.
- J. N. Murrell, S. Carter, S. C. Farantos, P. Huxley and A. J. C. Varandas, Molecular Potential Energy Functions, John Wiley, Chichester, 1984. Search PubMed.
- A. P. Braga, J. P. Braga and J. C. Belchior, J. Chem. Phys., 1997, 107, 9954 CrossRef CAS.
- F. Rosenblatt, Psychol. Rev., 1958, 65, 386 CAS.
- D. E. Rumelhart, G. E. Hinton and R. J. Williams, Nature, (London), 1986, 323, 533 CrossRef.
- S. Haykin, Neural Networks—A Comprehensive Foundation, Prentice-Hall, Englewood Cliffs, NJ, 1994. Search PubMed.
- T. M. Cover, IEEE Trans. Comput., 1965, 14, 326.
- M. J. L. Orr, Neural Comput., 1995, 7, 606.
- P. Huxley, D. B. Knowles, J. N. Murrell and J. D. Watts, J. Chem. Soc., Faraday Trans., 1984, 80, 1349 Search PubMed.
- J. O. Hirschfelder, C. F. Curtiss and R. B. Bird, Molecular Theory of Gases and Liquids, John Wiley, New York, 1954. Search PubMed.
- J. B. Keller and J. Zumino, J. Chem. Phys., 1959, 30, 1351 CrossRef CAS.
- D. A. Jonah and J. S. Rowlinson, Trans. Faraday Soc., 1960, 62, 1067 RSC.
- G. C. Maitland and E. B. Smith, Mol. Phys., 1972, 24, 1185 CAS.
- D. S. Broomhead and D. Lowe, Complex Syst., 1988, 2, 321 Search PubMed.
- F. Girosi, M. Jones and T. Poggio, Neural Comput., 1995, 7, 219.
- T. Poggio and F. Girosi, Proc. IEEE, 1990, 78, 1481 CrossRef.
- G. E. Hinton and S. J. Nowlan, Complex Syst., 1987, 1, 495 Search PubMed.
- A. E. Hoerl and R. W. Kennard, Technometrics, 1970, 12, 55.
- S. Geman, E. Bienenstock and R. Doursat, Neural Comput., 1992, 4, 1.
- R. Reed, IEEE Trans. Neural Networks, 1993, 4, 740 CrossRef.
- S. E. Fahlman and C. Lebiere, Advances in Neural Information Processing Systems, Morgan Kaufmann, San Mateo, CA, 1990, vol. 2, pp. 524–532. Search PubMed.
| This journal is © the Owner Societies 2000 |