
 Open Access Article
 This Open Access Article is licensed under a
 Creative Commons Attribution 3.0 Unported Licence
Improved electron–hole separation and migration in anatase TiO2 nanorod/reduced graphene oxide composites and their influence on photocatalytic performance†
Gregor
Žerjav
*a,
Muhammad Shahid
Arshad
a,
Petar
Djinović
a,
Ita
Junkar
b,
Janez
Kovač
b,
Janez
Zavašnik
 c and
Albin
Pintar
a
c and
Albin
Pintar
a
aDepartment for Environmental Sciences and Engineering, National Institute of Chemistry, Hajdrihova 19, SI-1001 Ljubljana, Slovenia. E-mail: gregor.zerjav@ki.si; Fax: +386 1 47 60 460; Tel: +386 1 47 60 249
bDepartment of Surface Engineering and Optoelectronics, Jožef Stefan Institute, Jamova 39, SI-1000 Ljubljana, Slovenia
cCentre for Electron Microscopy and Microanalysis, Jožef Stefan Institute, Jamova 39, SI-1000 Ljubljana, Slovenia
First published on 10th March 2017
Abstract
The as-synthesized TiO2 nanorods a-TNR (amorphous TiO2 layer covering the crystalline anatase TiO2 core) and TNR (fully crystalline anatase TiO2) were decorated with reduced graphene oxide (rGO) to synthesize two series of TiO2 + rGO composites with different nominal loadings of GO (from 4 to 20 wt%). The structural, surface and electronic properties of the obtained TiO2 + rGO composites were analyzed and correlated to their performance in the photocatalytic oxidation of aqueous bisphenol A solution. X-ray photoelectron spectroscopy (XPS) analyses revealed that charge separation in TiO2 + rGO composites is improved due to the perfect matching of TiO2 and rGO valence band maxima (VBM). Cyclic voltammetry (CV) experiments revealed that the peak-to-peak separations (ΔEp) are the lowest and the oxidation current densities are the highest for composites with a nominal 10 wt% GO content, meaning that it is much easier for the charge carriers to percolate through the solid, resulting in improved charge migration. Due to the high charge carrier mobility in rGO and perfect VBM matching between TiO2 and rGO, the electron–hole recombination in composites was suppressed, resulting in more electrons and holes being able to participate in the photocatalytic reaction. rGO amounts above 10 wt% decreased the photocatalytic activity; thus, it is critical to optimize its amount in the TiO2 + rGO composites for achieving the highest photocatalytic activity. BPA degradation rates correlated completely with the results of the CV measurements, which directly evidenced improved charge separation and migration as the crucial parameters governing photocatalysis.
1. Introduction
Photocatalysis holds several promising applications, such as hydrogen evolution via water splitting,1 CO2 reduction to fuels2 and removal of organic pollutants from water.3 In the last case, the main role of a photocatalyst is to produce hydroxyl radicals, which react with liquid-dissolved pollutants and ultimately produce H2O and CO2.4 The overall efficiency of a photocatalyst is determined by its (i) light absorption, (ii) electron–hole pair separation and migration and (iii) efficiency of electron–hole pair utilization.Due to its high photocatalytic activity, photo- and chemical stability, low cost, water insolubility under most conditions and non-toxicity, titanium dioxide (TiO2) has been widely studied and confirmed as the best photocatalyst for the decomposition of pollutants present in an aqueous medium.5,6 The drawbacks of TiO2 are (i) a wide band gap energy of 3.2 eV (only excited by ultraviolet (UVA) light (λ < 387 nm)), and (ii) fast electron–hole recombination. Many different attempts have been made to resolve the drawbacks of TiO2, such as doping TiO2 with other metal or non-metal elements, or coupling with other semiconductors.7–11
Modification of TiO2 with carbon materials such as carbon nanotubes and graphene has attracted a lot of attention due to their exceptionally high electrical mobility (2.5 × 105 cm2 V−1 s−1).12,13 Graphene oxide is chemically modified graphene,14,15 a 2D layered material which consists of hydrophilic oxygenated graphene sheets in which functional groups are located on their basal planes and edges.16 The presence of these functional groups results in poor electrical conductivity because of the interruption of the π bond system.17 Thus, it is necessary to reduce GO to restore the sp2 hybridized network and increase the electrical conductivity.18 The improved electron migration in reduced GO (rGO) can have important implications in enhanced photocatalytic activity in TiO2 + rGO composites, compared to pure TiO2. Additionally, the photocatalytic activity of the TiO2 + rGO composites in comparison to pure TiO2 can be further improved by increasing the charge separation due to the band alignment between TiO2 and rGO.
The method most often used to synthesize TiO2 + rGO composites consists of graphene oxide (GO) fabrication by means of chemical oxidation, exfoliation in water or water/ethanol mixtures, followed by concurrent GO reduction and attachment to TiO2.
The CB conduction band (CB) potential of rGO is slightly lower (−0.08 eV vs. SHE, pH = 0) than the CB level of anatase TiO2 (around −0.24 eV). The modification of TiO2 with rGO causes the transfer of electrons in the CB of TiO2 to rGO, which results in charge separation and increases the probability of their participation in oxidation and reduction reactions.19,20 Besides the positive influence of electron–hole separation, excessive amounts of rGO can also exhibit negative influences: (i) light harvesting competition between rGO and TiO2 becomes progressively dominant with increasing rGO amount, exhibiting decreased catalytic activity, and (ii) an excess of rGO in the composites can act as a recombination center which promotes the recombination of electron–hole pairs.21–26
Bisphenol A (BPA) is a widespread chemical used in the production of numerous plastics, personal care products, dental sealants, clothes, food packing materials, etc.27 It possesses endocrine disrupting properties, and photocatalytic degradation of this chemical is a possible approach to reduce its harmful impact to the environment. Therefore, BPA was chosen as an ideal molecule to test the photocatalytic properties of TiO2 + rGO composite catalysts for its mineralization.
In this study, we prepared TiO2 nanorods (NRs) by means of alkaline hydrothermal synthesis. The produced solids with an amorphous shell and anatase core (a-TNR) and NRs with pure anatase TiO2 structures (TNR) were attached to rGO to obtain TiO2 + rGO composites. For both series of the TiO2 + rGO composites, we investigated in detail how the increasing amount of rGO influences their structural and electrical properties, and how this manifests itself in the photocatalytic activity toward liquid-phase BPA degradation.
2. Experimental
2.1. Sample preparation
![[thin space (1/6-em)]](https://www.rsc.org/images/entities/char_2009.gif) :1 (120:13.3 ml) mixture of concentrated H2SO4 (Merck) and H3PO4 (Merck). The suspension was heated to 40 °C and stirred for 24 h, followed by cooling to room temperature and poured onto ice (133 ml of frozen deionized water). Finally, 2.4 ml of 30% H2O2 (Merck) was added. The suspension was centrifuged, and the wet cake was first washed with 10% aqueous HCl (Merck) solution to remove SO42− and then several times with deionized water until neutral pH. Finally, the obtained material was dried in a vacuum under cryogenic conditions.
:1 mixture of absolute ethanol (25 ml, Sigma Aldrich) and deionized water (50 ml). The mixture was ultrasonicated for 2 h to exfoliate graphene oxide. Afterwards, 0.5 g of either a-TNR or TNR was added to the mixture which was ultrasonicated for another 2 h. The mixture was transferred into a 200 ml Teflon-lined autoclave and heated to 130 °C for 4 h. During the thermal reaction, reduction of GO was achieved. The resulting products were recovered by centrifugation, washed with deionized water and dried in a vacuum under cryogenic conditions.
:1 (120:13.3 ml) mixture of concentrated H2SO4 (Merck) and H3PO4 (Merck). The suspension was heated to 40 °C and stirred for 24 h, followed by cooling to room temperature and poured onto ice (133 ml of frozen deionized water). Finally, 2.4 ml of 30% H2O2 (Merck) was added. The suspension was centrifuged, and the wet cake was first washed with 10% aqueous HCl (Merck) solution to remove SO42− and then several times with deionized water until neutral pH. Finally, the obtained material was dried in a vacuum under cryogenic conditions.
:1 mixture of absolute ethanol (25 ml, Sigma Aldrich) and deionized water (50 ml). The mixture was ultrasonicated for 2 h to exfoliate graphene oxide. Afterwards, 0.5 g of either a-TNR or TNR was added to the mixture which was ultrasonicated for another 2 h. The mixture was transferred into a 200 ml Teflon-lined autoclave and heated to 130 °C for 4 h. During the thermal reaction, reduction of GO was achieved. The resulting products were recovered by centrifugation, washed with deionized water and dried in a vacuum under cryogenic conditions.
Samples were denoted as TNR + X% rGO, which represents a composite of anatase TiO2 nanorods containing X wt% rGO.
2.2. Characterization
The microstructure and chemical composition of the composites were studied using a 200 kV transmission electron microscope (TEM; JEM-2100, Jeol Inc.) equipped with an LaB6 filament and an energy-dispersive X-ray (EDX) spectroscopy system (Oxford instruments, Inca system). For TEM analysis, the samples were dispersed in absolute ethanol and a drop of this suspension was placed on a TEM Cu grid and dried. The micrographs were recorded with a high-resolution slow-scan CCD camera (Orius DC1000, Gatan Inc.). The anatase crystal structure data for the simulation of the selected area diffraction pattern (SAED) patterns were obtained from Howard et al.29BET (Brunauer–Emmett–Teller) specific surface area, total pore volume and average pore size of the investigated materials were determined from N2 adsorption/desorption isotherms at −196 °C (Micromeritics, model TriStar II 3020). The samples were degassed before measurements using a SmartPrep degasser (Micromeritics) under a N2 stream (Linde, purity 6.0) at elevated temperature (60 min at 90 °C, followed by 240 min at 180 °C).
X-ray powder diffraction (XRD) patterns of the catalysts were collected on a PANanalytical X'pert PRO MPD diffractometer with Cu Kα1 radiation (1.54056 Å) in reflection geometry (scan range: 20–90° in increments of 0.034°). PDF standards from the International Centre for Diffraction Data (ICDD) were used for the identification of crystalline phases.
UV-Vis diffuse reflectance (UV-Vis-DRS) spectra were obtained at room temperature using a PerkinElmer Lambda 35 UV-Vis spectrophotometer equipped with an RSA-PE-19 M Praying Mantis accessory. The background correction in the range of 200–900 nm was recorded using a white reflectance standard Spectralon©.
The ATR-FTIR spectra were recorded by using a FTIR spectrometer (PerkinElmer, model Frontier), equipped with a GladiATR Vision™ accessory (PIKE Technologies) that contained a diamond crystal. The obtained spectra were a result of 64 scans with a resolution of 4 cm−1 in the spectral range of 4000–450 cm−1.
X-ray photoelectron spectroscopy (XPS) analysis was performed on a PHI-TFA XPS spectrometer (Physical Electronics Inc.). The samples were excited by X-ray radiation from a monochromatic Al-Kα source (1468.6 eV). The high-energy-resolution spectra were acquired with an energy analyzer operating at a resolution of about 0.6 eV and a pass energy of 29 eV. During data processing, the C 1s peak at 285.0 eV was used as the reference.
The cyclic voltammetry (CV) experiments were carried out with Metrohm Autolab PGSTAT30. A three-electrode configuration was employed using a screen-printed electrode (DropSens) that consists of carbon as a working electrode, platinum as a counter electrode and silver as a reference electrode. The catalyst sample (12.5 mg) was dispersed in absolute ethanol (2.5 ml, Sigma Aldrich) to form a homogeneous suspension. 10 μl of the suspension was dropped onto the surface of the working electrode and dried overnight at room temperature. The CVs were measured in 0.1 M KCl solution containing 1 mM K3[Fe(CN)6] as a redox probe with a scanning rate of 50 mV s−1.
2.3. Photocatalytic oxidation experiments
For the photolytic/photocatalytic experiments, a solution of 10 mg l−1 BPA in ultrapure water (18.2 MΩ cm) was used. The experiments were performed in a 250 ml batch slurry reactor (reaction vessel, Lenz LF60 250 ml (Germany) with an inner diameter of 60 mm, height of 180 mm and a water-cooling jacket) at atmospheric pressure, which was magnetically stirred (600 rpm) and thermostated at 20 °C (Julabo, model F25/ME). The solution was purged with purified air during the whole experiment (45 l h−1). The catalyst concentration used in the performed experiment was 31.25 mg l−1 (TNR + rGO composites) or 62.50 mg l−1 (a-TNR + rGO composites). Ultrasonication was employed to suspend the catalyst before adding it to the BPA solution. Illumination of the suspension with a UVA Hg lamp (150 W, maximum at λ = 365 nm) started after 30 min where the suspension was kept in the dark (“dark” period) for establishing equilibrium of the sorption process. The Hg lamp was positioned in a water-cooling jacket which was immersed vertically in the center of the batch slurry reactor. Oxidation runs were performed in duplicate and found to be fully reproducible (deviation in BPA conversion ± 1%).2.4. Analysis of end-product solutions
During the photolytic/photocatalytic runs, 1.5 ml samples were withdrawn in 5–30 min intervals, filtered using a 0.2 μm membrane filter and analyzed with an HPLC instrument (Thermo Scientific, model Spectra) to determine temporal BPA conversions. Details of the analytical protocol can be found elsewhere.30 The level of mineralization, i.e. the total amount of removed organic substances in aqueous-phase samples withdrawn at the end of the photolytic/photocatalytic experiment (25 ml), was determined by measuring the total organic carbon (TOC) content. TOC measurements were carried out with an advanced TOC analyzer (Teledyne Tekmar, model Torch) equipped with a high pressure NDIR detector.3. Results and discussion
3.1. Catalyst characterization
 | ||
| Fig. 1 (a) TEM image of the a-TNRs (inset is showing SAED pattern (simulation + experiment)); (b) close up image of the a-TNR; (c) HR-TEM image of the a-TNR sample with an amorphous layer covering the surface; (d) EDS spectrum corresponding to the circle shown in (c). | ||
Fig. 2a shows the TEM image of the a-TNR + 5.3% rGO composite. It can be seen that the rGO scrolls are covered with polyhedral TiO2 crystallites. The egg-like a-TNRs are transformed into polyhedral crystallites. The (111) faces of the anatase are well-developed and most of the particles have square bi-pyramidal shape (top left inset of Fig. 2a). No amorphous layer covering the a-TNR was observed. These changes in the morphology of the a-TNRs and noticeable reduction of the BET specific surface area of a-TNR + rGO solids (Table 1) are associated with hydrothermal conditions during deposition of rGO (section 2.1.3). Fig. 2b compares the simulated and experimental SAED data for a-TNR + 5.3% rGO composites. It can be clearly seen that the anatase phase is present in the composite. An additional weak reflection corresponding to the (101) crystal plane of rGO scrolls (interplanar distance of 0.2 nm) was observed, Fig. S3.†
 | ||
| Fig. 2 (a) TEM image of the a-TNR + 5% rGO (inset is showing high magnification image of bi-pyramidal anatase nanocrystal); (b) SAED pattern for a-TNR + 5% rGO (experiment + simulation). | ||
| Catalyst | S BET, m2 g−1 | V pore, cm3 g−1 | d pore, nm | Anatase crystallite size, nm |
|---|---|---|---|---|
| a-TNR | 381 | 0.95 | 8.1 | — |
| a-TNR + HT | 163 | 0.43 | 8.9 | — |
| a-TNR + 2.6% rGO | 176 | 0.49 | 9.7 | 9.4 |
| a-TNR + 5.3% rGO | 182 | 0.44 | 8.2 | 9.3 |
| a-TNR + 9.2% rGO | 187 | 0.43 | 7.7 | 9.4 |
| TNR | 102 | 0.49 | 16.9 | 13.7 |
| TNR + 1.7% rGO | 101 | 0.44 | 15.5 | 9.3 |
| TNR + 5.0% rGO | 108 | 0.48 | 15.5 | 11.2 |
| TNR + 8.0% rGO | 118 | 0.48 | 14.4 | 12.7 |
Fig. 3a shows a typical TEM image of the TNR sample. A proper rod-like morphology was observed for these samples with a length of 70 ± 8 nm and a diameter of 8 ± 2 nm. SAED pattern in Fig. 3b compares simulated and experimental data for the anatase phase revealing that the TNR sample consists of pure anatase phase. It is clearly evident that each NR is a single anatase crystal with preferential growth in the (101) direction without any trace of the amorphous phase (Fig. 3c).
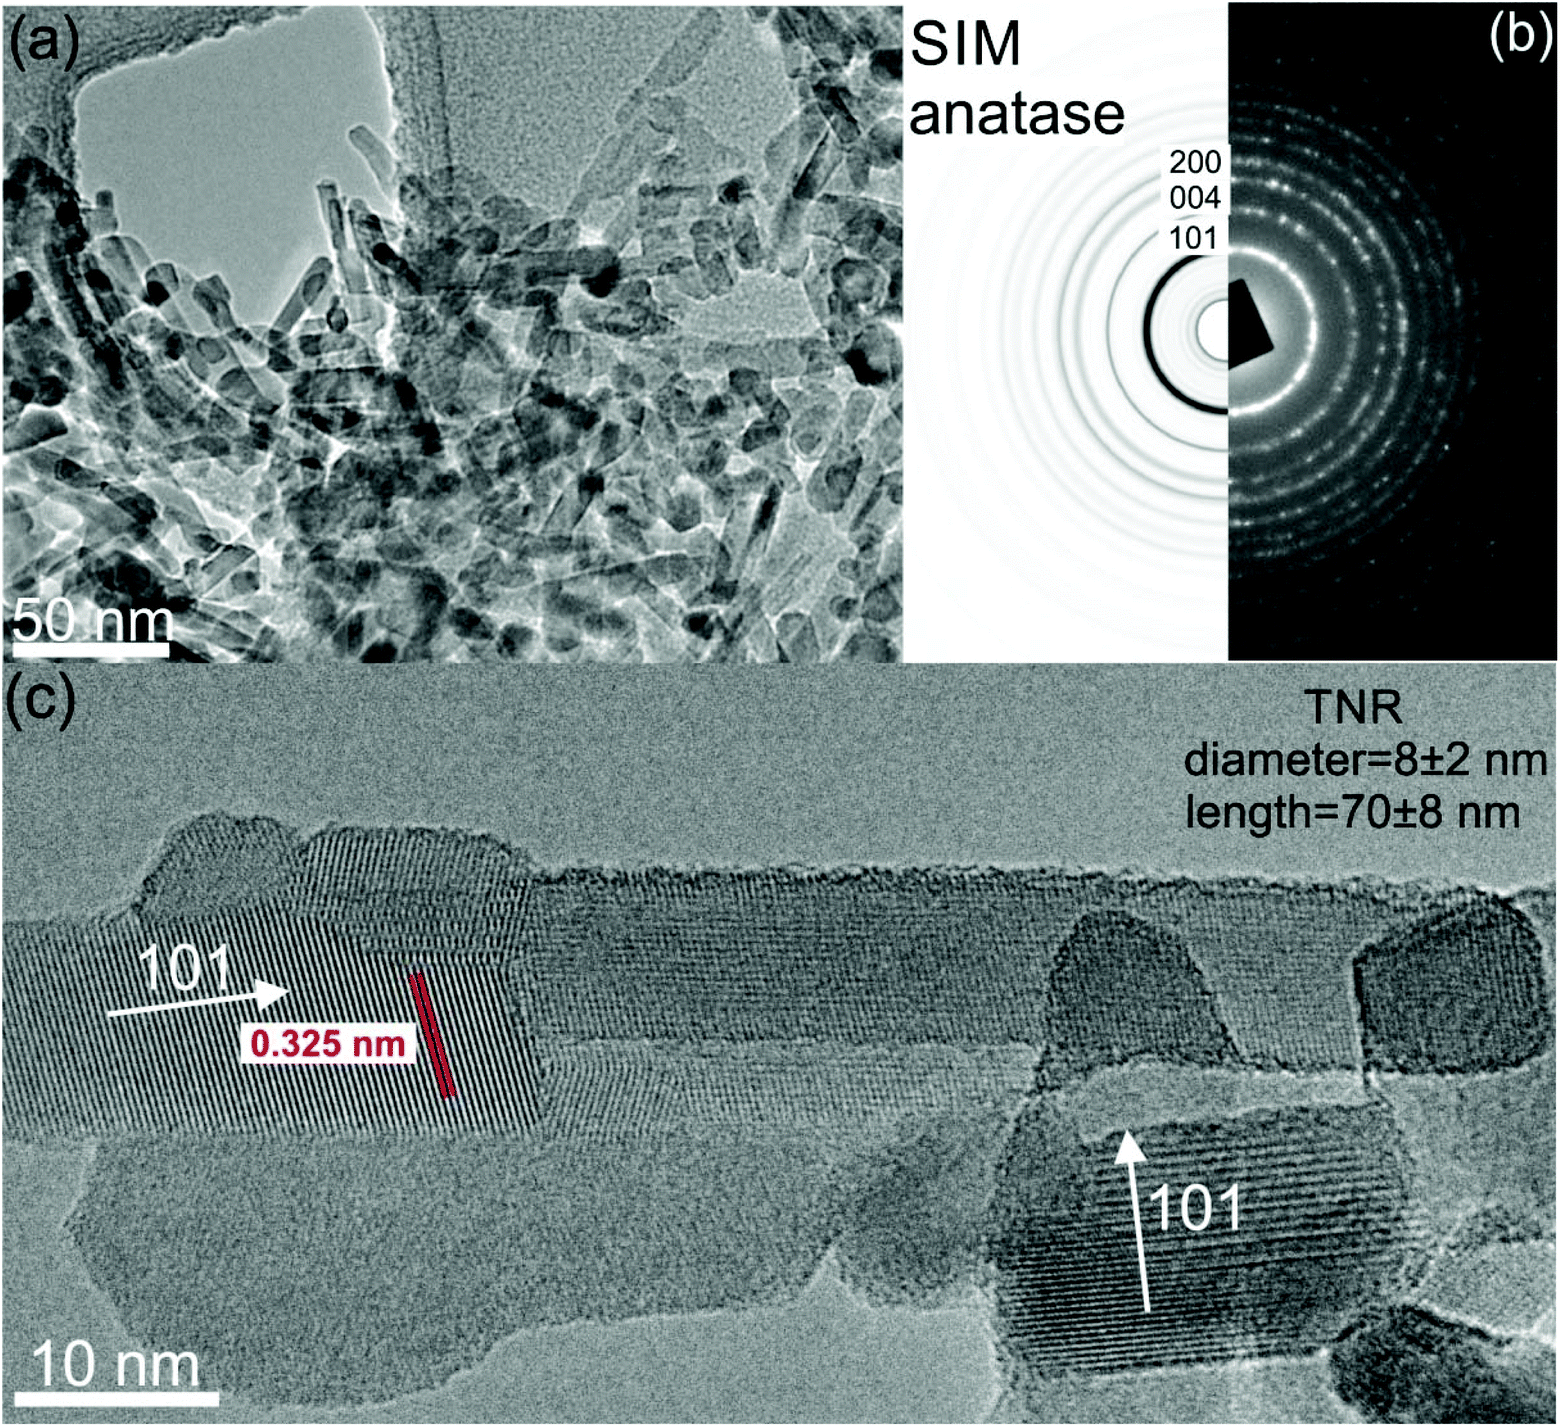 | ||
| Fig. 3 (a) TEM image of the heat treated TiO2 NRs (TNR sample); (b) SAED pattern (simulation + experiment); (c) HR-TEM image of the TNR sample showing single crystalline anatase TiO2 phase with preferential growth in the (101) crystal direction. | ||
The TEM image of the TNR + 5% rGO sample (Fig. 4a) revealed that rGO sheets are covered with TNRs. No significant changes in the dimension and morphology of the TNRs were observed during their hydrothermal attachment to rGO, likely as a result of their previous calcination at 500 °C. Fig. 4b shows a comparison between experimental and simulated SAED patterns for the TNR + 5% rGO composites. The anatase phase is clearly present in the composite. Additionally, a characteristic rGO ring was also observed, corresponding to the (101) crystal plane of rGO sheets. TEM images and lack of multiple diffraction rings originating from the extended stacking of rGO sheets (Fig. S3†) give us good indication that the observed rGO structure is indeed 2D and graphene-like.
 | ||
| Fig. 4 (a) TEM image of TNR + 5% rGO (inset is showing high magnification image of TNRs attached on the surface of rGO); (b) SAED pattern for TNR + 5% rGO (experiment + simulation). | ||
The BET specific surface areas of a-TNR, TNR and TiO2 + rGO composites are presented in Table 1. Corresponding N2 adsorption–desorption isotherms and BJH pore size distributions are presented in Fig. S4.† Calcination of a-TNR (500 °C in air for 2 h) to produce the TNR resulted in a significant decrease of BET specific surface area from 381 to 102 m2 g−1. Increasing amount of rGO in examined solids exhibits only a minor effect on the BET specific surface area. The decrease of the BET specific surface area of a-TNR + rGO composites in comparison to pure a-TNR is associated with the elimination of micropores contained in the amorphous TiO2 layer during the hydrothermal process of a-TNR and rGO coupling. This was confirmed by an individual experiment where a-TNR without GO (a-TNR + HT sample in Table 1) was subjected to identical hydrothermal treatment. BET decrease from 381 to 162 m2 g−1 was observed with a concomitantly decreased quantity of N2 adsorbed at p/po < 0.01 (Fig. S1†). Also, considering that the formed square bi-pyramidal anatase crystallites in a-TNR + rGO samples are of very similar size (10–20 nm) compared to the egg-like core shell TiO2 particles of a-TNR, the observed drop in the surface area is unlikely related only to the change of their shape.
 | ||
| Fig. 5 XRD patterns of (a) a-TNR and (b) TNR composites with different amounts of rGO. | ||
![[double bond, length as m-dash]](https://www.rsc.org/images/entities/char_e001.gif) O). The broad band at 3400 cm−1 arises from the stretching vibrations of surface hydroxyl (–OH) groups, and the peak at 1620 cm−1 arises from the CC skeletal vibration of GO, thus confirming its sp2 hybridized structure.31,34,35 The bands of oxygen containing groups clearly observed in the GO spectrum disappear in the spectra belonging to TiO2 + rGO composites, which indicates their successful reduction during the hydrothermal preparation procedure. The above results confirm that the reduction of graphene oxide and coupling of TiO2 and rGO phases via bridging oxygen in both a-TNR and TNR composites take place.
O). The broad band at 3400 cm−1 arises from the stretching vibrations of surface hydroxyl (–OH) groups, and the peak at 1620 cm−1 arises from the CC skeletal vibration of GO, thus confirming its sp2 hybridized structure.31,34,35 The bands of oxygen containing groups clearly observed in the GO spectrum disappear in the spectra belonging to TiO2 + rGO composites, which indicates their successful reduction during the hydrothermal preparation procedure. The above results confirm that the reduction of graphene oxide and coupling of TiO2 and rGO phases via bridging oxygen in both a-TNR and TNR composites take place.
 | ||
| Fig. 6 FTIR spectra of prepared (a) a-TNR and (b) TNR composites, as well as of bare a-TNR, TNR and GO samples. | ||
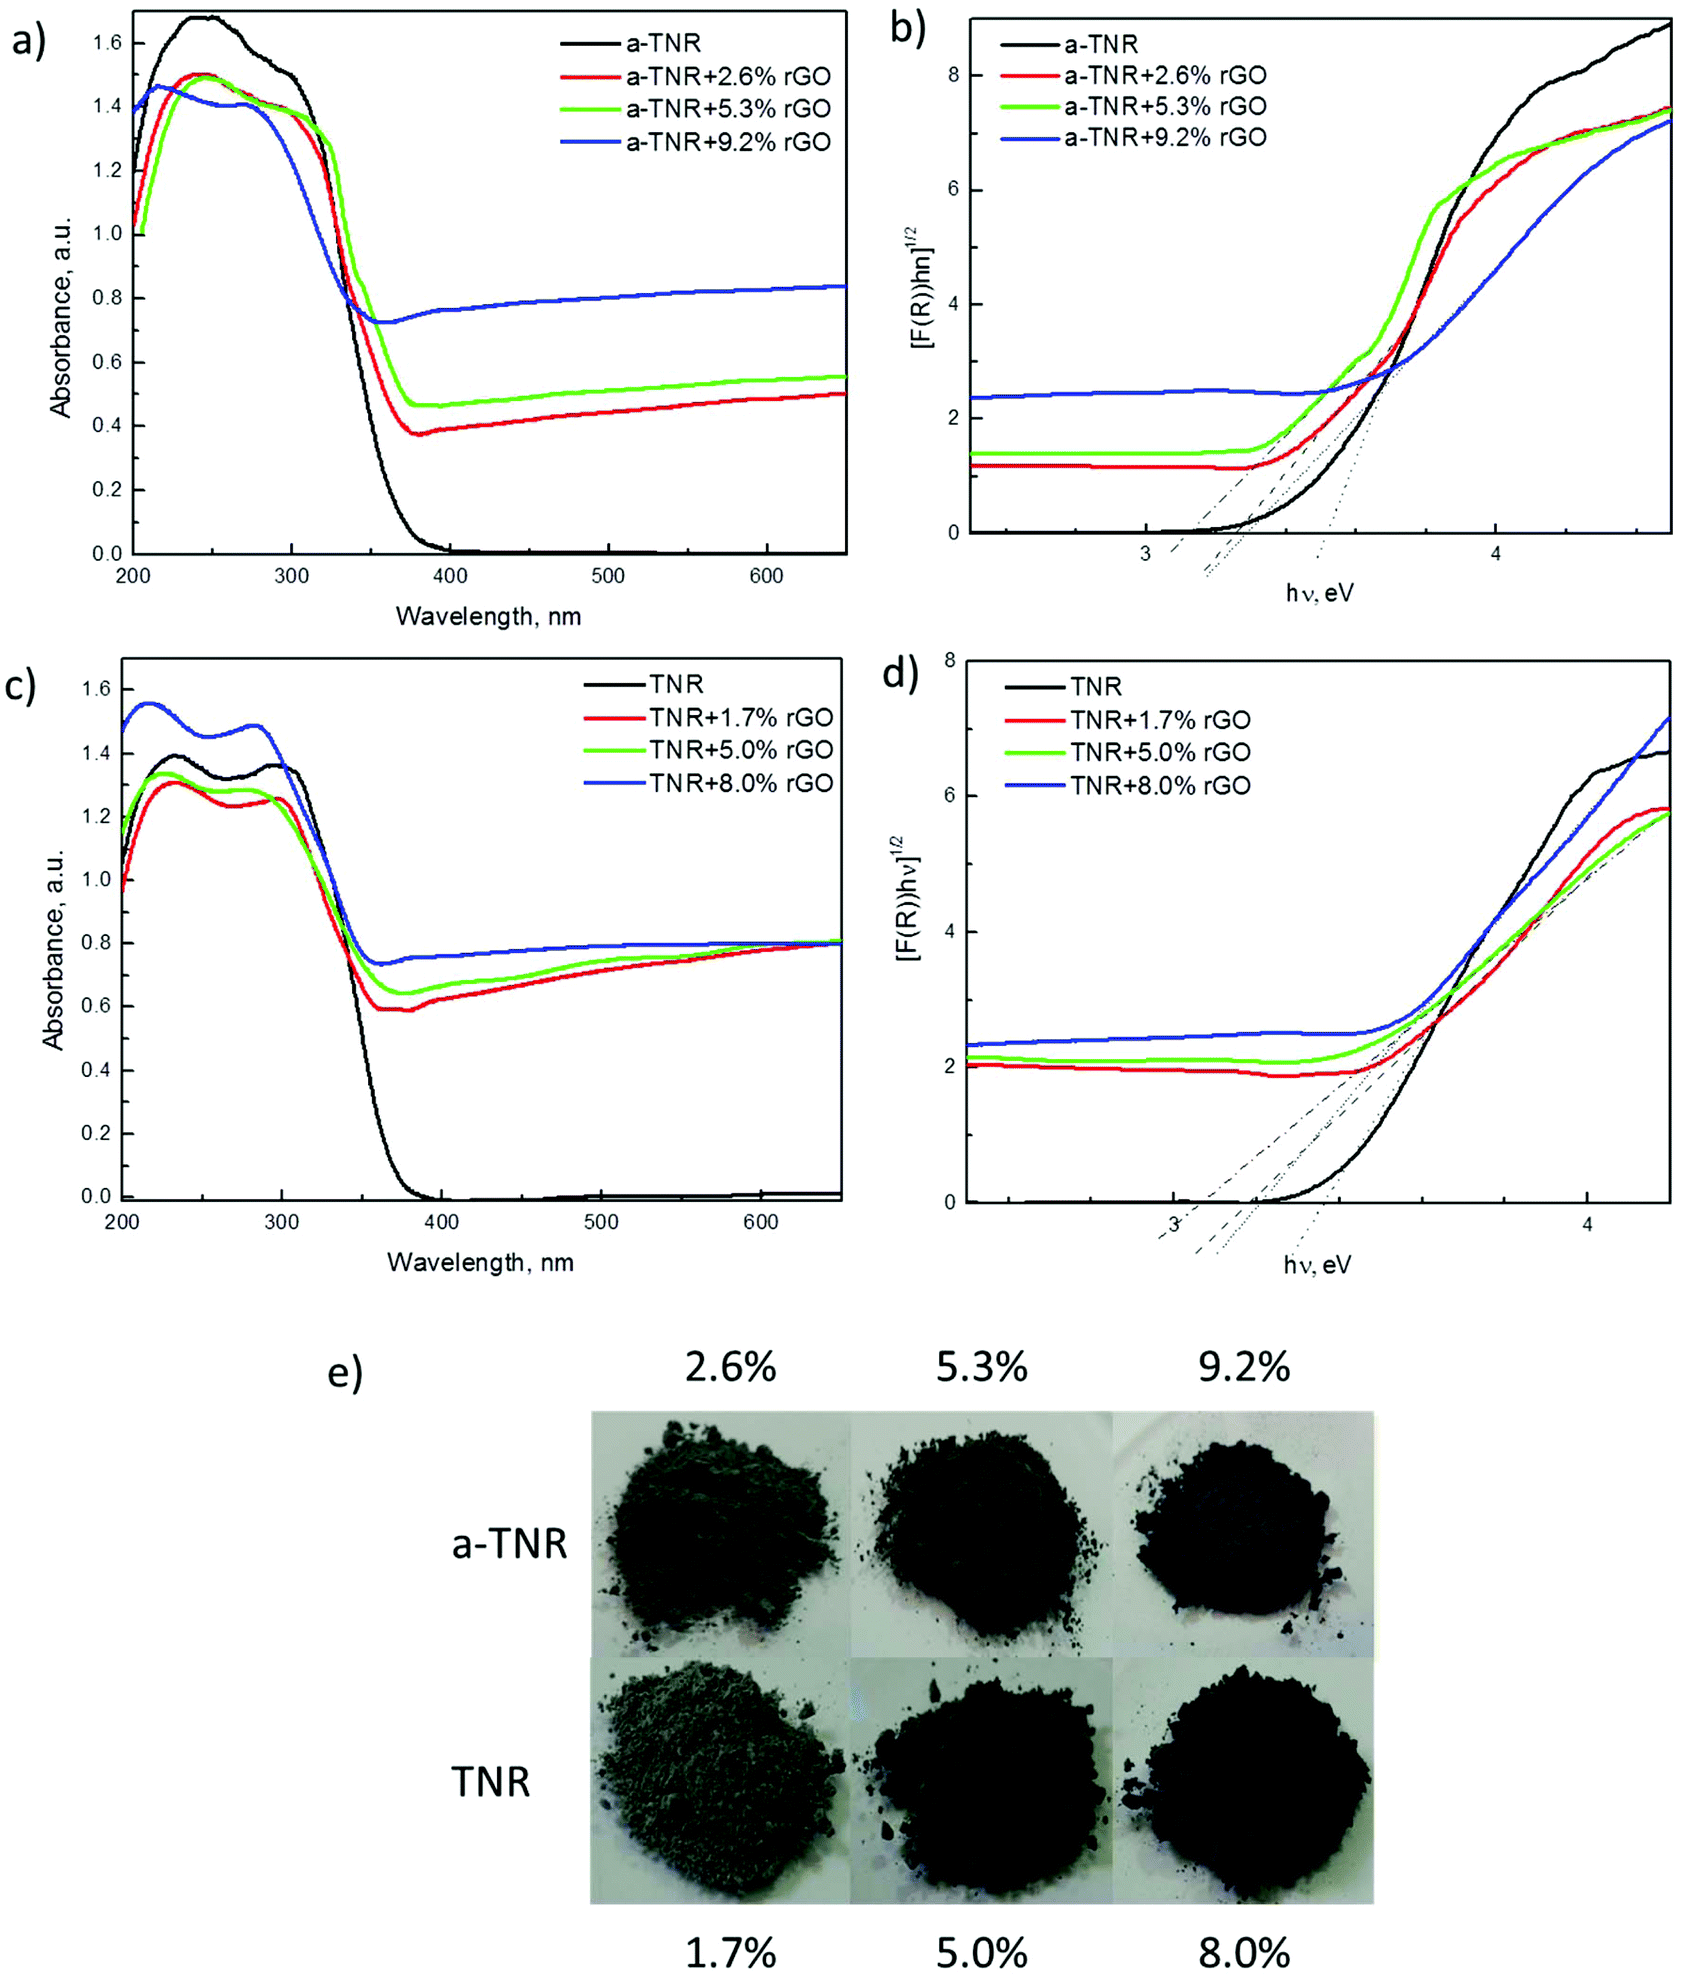 | ||
| Fig. 7 UV-Vis DRS spectra of (a) a-TNR and (c) TNR composites with different amounts of rGO and Tauc plot analysis of the obtained data (b,d). (e) The pictures show that with increasing amounts of rGO in the TiO2 + rGO composites the color of the composites becomes darker. | ||
| Catalyst | Band gap, eV |
|---|---|
| a-TNR | 3.5 |
| a-TNR + 2.6% rGO | 3.2 |
| a-TNR + 5.3% rGO | 3.1 |
| a-TNR + 9.2% rGO | 3.3 |
| TNR | 3.4 |
| TNR + 1.7% rGO | 3.2 |
| TNR + 5.0% rGO | 3.1 |
| TNR + 8.0% rGO | 3.2 |
 | ||
| Fig. 8 XPS analysis of a-TNR and its composites with different rGO loadings: (a) Ti 2p spectra, (b) C 1s spectra, (c) O 1s spectra and (d) determination of VBM. Inset schematic illustration of band structure determination with XPS and UV-Vis DRS measurement. | ||
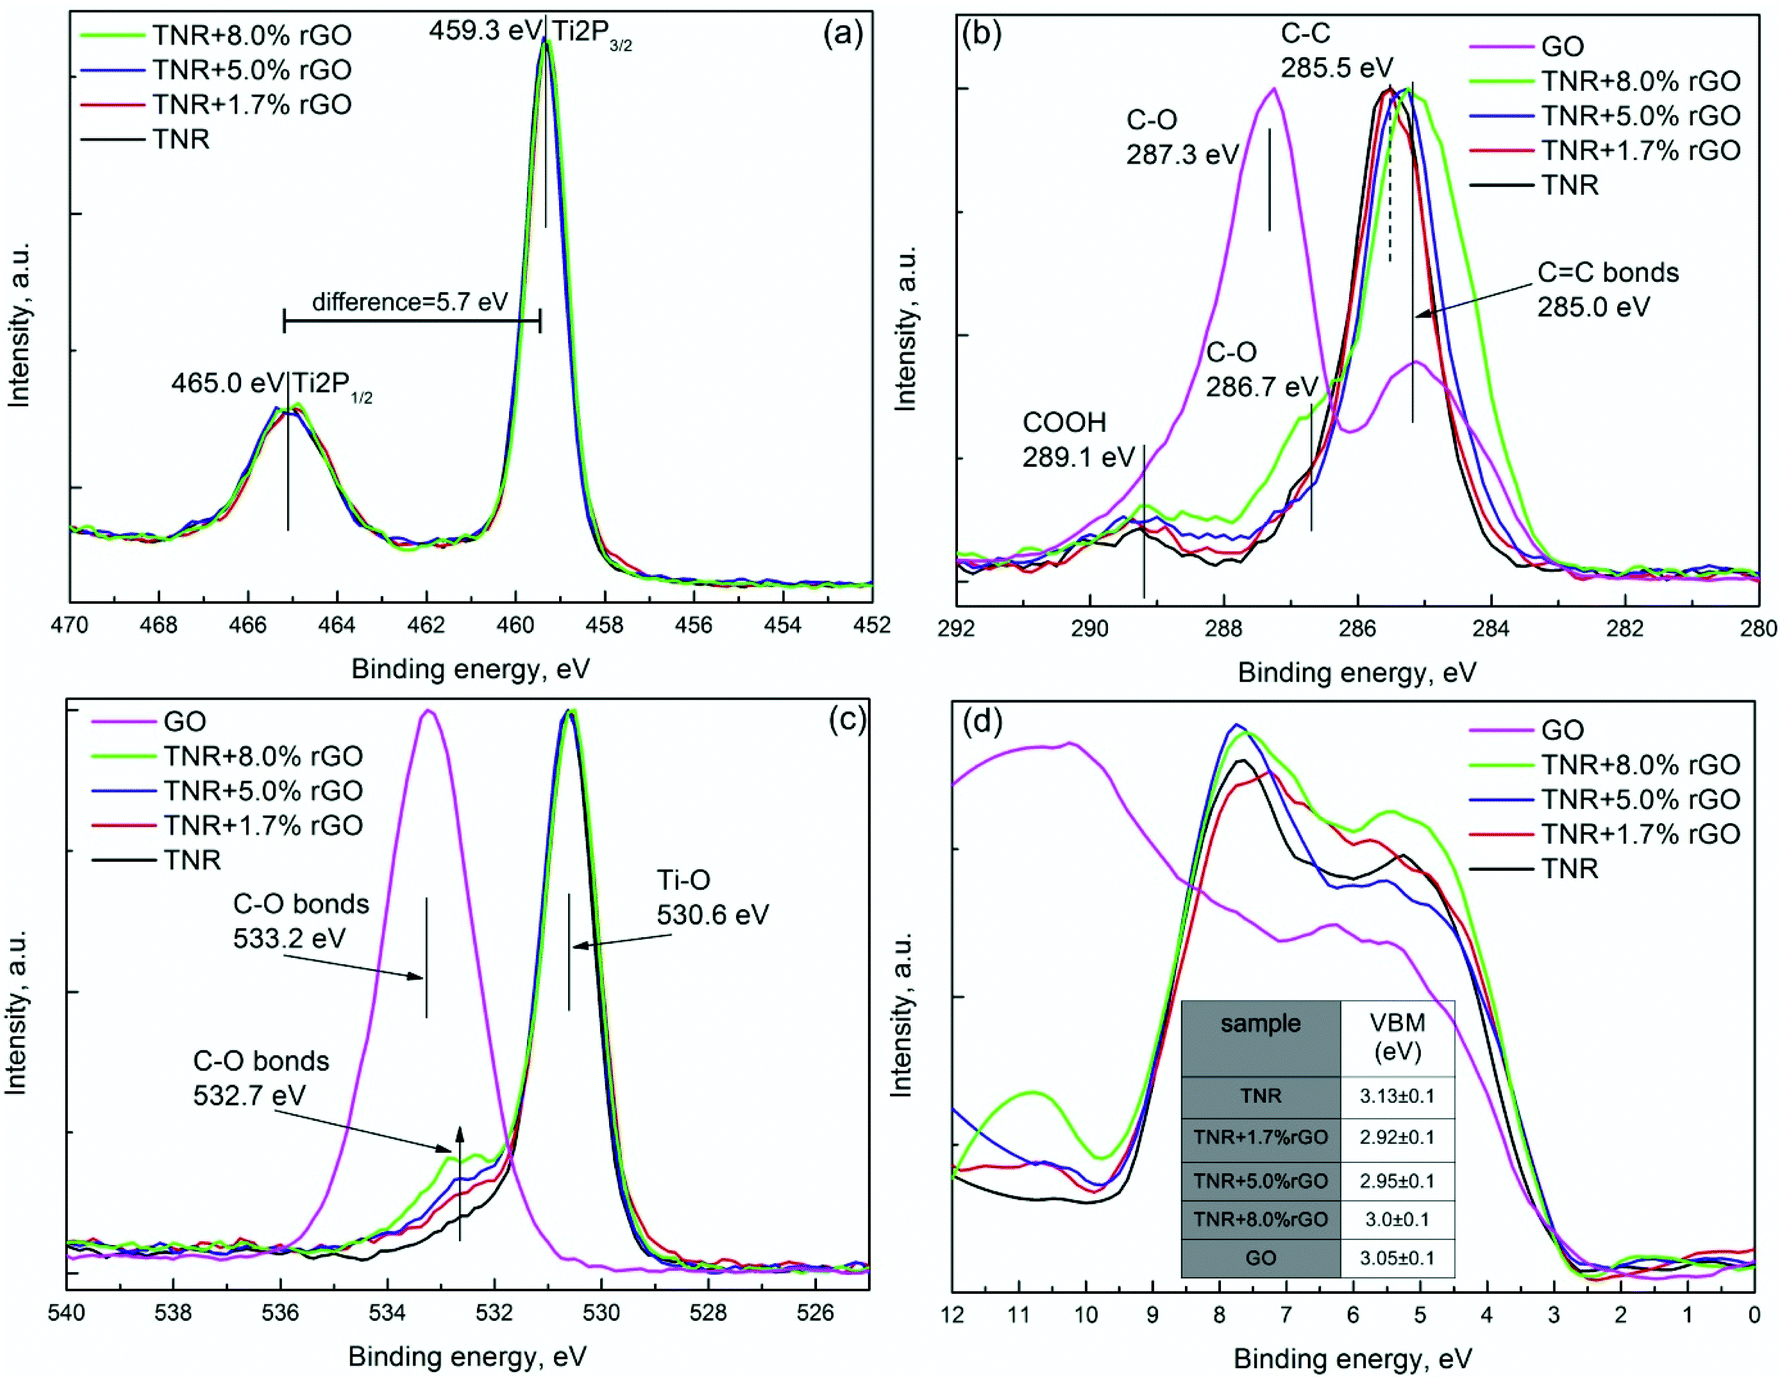 | ||
| Fig. 9 XPS analysis of TNR and its composites with different rGO loadings: (a) Ti 2p spectra, (b) C 1s spectra, (c) O 1s spectra and (d) determination of valence band maxima. | ||
All the composites show similar features for the Ti 2p spectrum except for the a-TNR sample, which is slightly shifted to the higher binding energies (Fig. 8a). Such a shift can be ascribed to the amorphous TiO2 shell, as observed from TEM analysis (Fig. 1c). Amorphous TiO2 has a different atomic environment compared to crystalline anatase, which can result in a shift in the Ti 2p spectrum.37 The Ti 2p spectra of a-TNR + rGO composites have Ti 2p1/2 and Ti 2p3/2 spin–orbital splitting of photoelectrons which are located at the binding energies of 465 and 459.3 eV, respectively, with a difference of ∼5.7 eV which corresponds to the pure bulk anatase phase. Although the XPS results of a-TNR sample for Ti 2p1/2 and Ti 2p3/2 are slightly shifted, the difference between them is identical to those of anatase (5.7 eV). This observation indicates that in the amorphous shell covering the anatase core (TEM image, Fig. 1c), the short range –O–Ti–O–Ti– network chains are organized in an anatase-like structure.37 This is the main reason why the anatase phase is formed in a-TNR + rGO composites under relatively mild hydrothermal conditions (130 °C). In Fig. 9a, all the composites including TNR show features which corresponds to the pure anatase phase.
The high resolution C 1s XPS spectrum for GO, a-TNR (TNR) and their rGO composites can be deconvoluted into three peaks as shown in Fig. 8b and 9b. The major peak with the binding energy around 285.1 eV is attributed to C–C and sp2 hybridized carbon (CC) as shown in Fig. 8b and 9b. In Fig. 9b, a small shift of the major peak was observed towards lower binding energies (280 eV) with an increasing content of rGO which corresponds to the increasing amount of sp2 hybridized CC bonds due to the addition of rGO in TNR composites. Additionally, oxygen functionalities attached to the carbon are visible at ∼287 ± 0.3 eV and are attributed to the epoxy C–O bond, while the broad peak centered at ∼289.1 eV is ascribed to the COOH group as shown in Fig. 8b and 9b. The deconvoluted XPS data for the C 1s electrons of the a-TNR and TNR based composites show a dramatic decrease of the signal originating from the C–O species in comparison to pure GO as seen in Fig. 8b and 9b. This suggests that the applied hydrothermal synthesis protocol significantly reduced the number of C–O bonds, thereby converting GO to graphene. It is evident that the peaks at 286.7 and 289.1 eV increased for TNR + 8% rGO and a-TNR + 9.2% rGO composites, meaning that GO is not completely reduced in these composites. In Fig. 8b and 9b, no peak appears at 281.0 eV corresponding to the Ti–C bond,38 which means that no Ti–C exists on the surface of the examined composites.
The strongest peak at 530.6 eV corresponds to the Ti–O bond of TiO2, which implies that the chemical state of oxygen resembles that of anatase TiO2 (Fig. 8c and 9c). The peak at ∼533 eV is assigned to the C–O bond which significantly decreased in composites (TiO2 + rGO) in comparison to pure GO (Fig. 8c and 9c), again confirming the reduction of GO to graphene. In Fig. 9c there is a shoulder appearing at 532.7 eV which is increasing with the increasing rGO content in the composites. This can be ascribed to the formation of the Ti–O–C functional group. The presence of such functional groups in the composites is also evident in FTIR measurements (Fig. 6a) and reveals the nature of bonding between both the constituents of the composites.
In order to reveal the information about the valence band maxima (VBM), calculated as described by Chambers et al.,39 data were smoothed with a Savitzky–Golay (SG) filter before analysis. This method uses a linear extrapolation of the leading edge of the valence photoemission by finding the intersection of a regression line that spans the linear portion of the X-ray photoelectron valence band leading edge with the background between the VBM and the “Fermi level”.39 More details are available in the ESI (Fig. S7†). The VBM results of a-TNR (TNR) and their rGO composites are shown in Fig. 8d and 9d. Taking into account the band gap (Eg) values from UV-Vis DRS measurement (Table 2), the band structure can be determined as illustrated in the inset of Fig. 8d.
It is difficult to precisely measure Eg for rGO from the utilized UV-Vis DRS technique due to its dark color. However, the literature values vary from 3.5–1.15 eV, depending on the reducing protocol.40 The Eg value corresponding to the hydrothermally reduced GO is around 3.0 eV. The VBM value for GO was found to be 3.05 eV, which is very close to the VBM values of, a-TNR and TNR, as shown in the table in Fig. 8d and 9d.
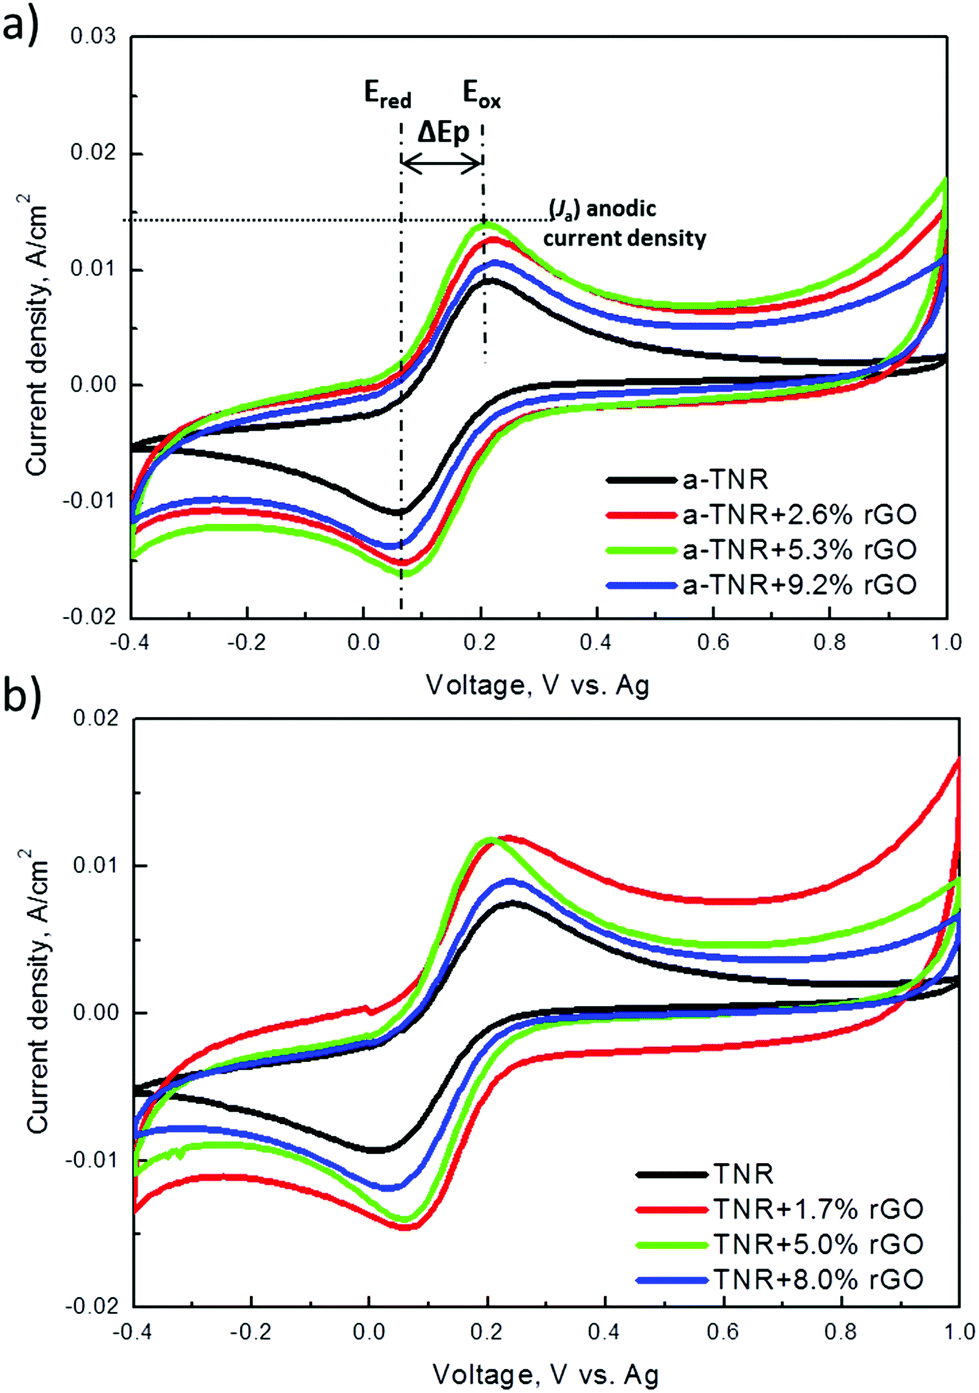 | ||
| Fig. 10 Cyclic voltammograms recorded for the (a) a-TNR and (b) TNR composites with different amounts of rGO. | ||
3.2. Photocatalytic BPA oxidation
Fig. 11 and 12 show BPA degradation curves obtained in the presence of a-TNR + rGO and TNR + rGO composites. The experiments were first conducted in the dark for 30 min in order to determine the adsorption equilibrium. The decrease of BPA concentration in the reaction suspension due to the adsorption of BPA on the surface of a-TNR + rGO composites was negligible and was not influenced by the amount of GO present in the composites. The extent of photocatalytic BPA degradation importantly shows that when a-TNR were loaded with rGO, the degradation of BPA was improved in comparison to pure a-TNR (initial BPA disappearance rate over this solid equals 0.53 mg (gcat min)−1). The maximum degradation activity was achieved in the presence of a-TNR + 5.3% rGO composites (initial BPA disappearance rate: 2.85 mg (gcat min)−1). Also, the half-lives of BPA degradation decreased significantly from 150 min (for a-TNR) to 28 min (measured in the case of a-TNR + 5.3% rGO sample) and then increased slightly for the a-TNR + 9.2% rGO solid (41 min). Fig. 13 presents TOC removal data (i.e. extent of total mineralization of the parent organic matter), which were obtained after 240 min of UVA irradiation of aqueous BPA solution in the presence of a-TNR + rGO composites. The measured TOC data for a-TNR + rGO composites resemble the trends of BPA degradation activities (Fig. 11). The extent of BPA mineralization and its reaction intermediates increases with the increasing amount of rGO in the composites until 5.3 wt% of rGO loading is reached. | ||
| Fig. 11 Photocatalytic degradation of BPA in the presence of a-TNR composites with different rGO loadings irradiated with UVA light for 240 min. The catalyst concentration used in the performed experiments was 62.5 mg l−1. | ||
 | ||
| Fig. 12 Photocatalytic degradation of BPA in the presence of TNR composites with different rGO loadings irradiated with UVA light for 120 min. The catalyst concentration used in the experiments performed was 31.25 mg l−1. | ||
 | ||
| Fig. 13 Comparison of TOC removal data obtained under UVA light assisted photocatalytic BPA oxidation after 240 min in the case of a-TNR + rGO composites (black bars), and after 120 min in the case of TNR + rGO composites (red bars). | ||
Fig. 12 shows temporal BPA degradation curves obtained over TNR + rGO composites. Compared to the runs performed with the a-TNR + rGO composites (Fig. 11), lower catalyst loadings were utilized in this case because the TNR + rGO composites exhibited substantially higher activity per unit mass. As before, we can see that after 30 min of darkness, the concentration of BPA in the reaction suspension did not change significantly. This implies that the data presented in Fig. 12 are not influenced by adsorption effects. The obtained BPA degradation curves demonstrate that introducing GO into TNR + rGO composites increases the photocatalytic activity compared to pure TNR. In the case of TNR + rGO composites, the maximum degradation activity was also achieved with the composite containing 5 wt% rGO (Fig. 12; initial BPA disappearance rate: 17 mg (gcat min)−1), as was already seen in the case of a-TNR + rGO composites. The extent of TOC removal, achieved in 120 min of reaction time in the presence of TNR + rGO composites, is illustrated in Fig. 12. The measured TOC data for TNR + rGO composites resemble very well the obtained trends of BPA degradation activities presented in Fig. 12. The highest extent of mineralization of BPA and its reaction intermediates was obtained over the TNR composites containing 5 wt% of rGO.
Fig. 14 shows a schematic of a proposed model for improved charge separation and migration for enhanced photodegradation of BPA over TNR + rGO composites. Several factors influence the photocatalytic activity of the studied composites, such as efficient light harvesting (related to bandgap energy), tendency of different surface TiO2 crystalline planes for electron and hole accumulation,43 prolonged charge carrier separation (supported by high electron conductivity of the rGO component), specific surface area and efficient generation of radical species which ultimately perform the catalytic conversion. Based on CV measurements, rGO sheets enable more electrons to be transferred from TNRs compared to rGO scrolls in a-TNRs, resulting in a higher amount of efficiently separated charge carriers (thus suppressing the recombination events), which supports the photocatalytic degradation of BPA. The TiO2 nanorods attached to the graphene sheets inject their excited electrons to the graphene due to band alignment and eliminate the radiative electron–hole recombination. The graphene sheets act as a web for the electron percolation mechanism and significantly improve the electron migration.44,45 Based on these results we can assume that both electrons and holes can interact with O2 and water to form superoxide and hydroxyl radicals, as shown in Fig. 14. In addition, both composites expose different TiO2 surface crystalline planes, namely: more reactive (001) planes in TiO2 nanorods (TNR composites) and more stable (101) planes in square bi-pyramidal TiO2 crystallites of a-TNR composites. It was previously substantiated that (001) planes of TiO2 preferentially accumulate in the photogenerated holes,43 which upon contact with water generate highly active hydroxyl radicals. As a result of these favorable properties TNR + rGO based composites enable up to 6-fold higher BPA degradation activity.
 | ||
| Fig. 14 Graphical illustration of TNR + rGO composites and possible mechanism for improved charge separation and migration. | ||
4. Conclusions
In the synthesized a-TNR nanorods, the core of anatase TiO2 is covered by an approximately 8 nm thick layer of amorphous TiO2. With the calcination of a-TNR in air for 2 h at 500 °C, we obtained nanorod shaped single crystals composed of anatase TiO2 (TNR). During hydrothermal reduction treatment at 130 °C, which was used to combine a-TNR and rGO, crystallization of the amorphous TiO2 layer into crystalline anatase TiO2 occurred. In the case of a-TNR + rGO composites a-TNR were interconnected with multilayered rGO scrolls, whereas in TNR + rGO composites, TNRs were uniformly dispersed on rGO sheets. The results of XPS and FTIR show that GO reduction during the hydrothermal procedure was successful (except in the composites containing the highest GO content), and there is a perfect band alignment between TiO2 and rGO, and Ti–O–C bonds were formed linking both components of the composites. This information is of crucial importance and enables the transfer of charge carriers from TiO2 to rGO under UVA light illumination. This consequently retards the electron–hole recombination, which implies that more electrons and holes can participate in the catalytic reaction. A hindered electron–hole recombination in TiO2 + rGO composites in comparison to pure TiO2 was also confirmed by cyclic voltammetry measurements. The electron–hole recombination is progressively hindered with increasing rGO loading up to 5 wt%, whereas further increase of the rGO content accelerates their recombination. In very good agreement with these findings are the photocatalytic oxidation tests which show that in both series of composites the highest BPA degradation activity was achieved with the 5 wt% rGO composite. A precisely tuned amount of rGO in the TiO2 + rGO composites is of crucial importance for achieving optimal photocatalytic activity in BPA decomposition.Acknowledgements
The authors gratefully acknowledge the financial support of the Ministry of Education, Science and Sport of the Republic of Slovenia through Research Program No. P2-0150. The authors thank Dr Eva Menart from the National Institute of Chemistry, Ljubljana, Slovenia, for conducting the CV measurements.References
- A. Kudo and Y. Miseki, Heterogeneous photocatalyst materials for watersplitting, Chem. Soc. Rev., 2009, 38, 253–278 RSC.
- A. Corma and H. Garcia, Photocatalytic reduction of CO2 for fuel production: Possibilities and challenges, J. Catal., 2013, 308, 168–175 CrossRef CAS.
- R. Kaplan, B. Erjavec, G. Dražić, J. Grdadolnik and A. Pintar, Simple synthesis of anatase/rutile/brookite TiO2 nanocomposite with superior mineralization potential for photocatalytic degradation of water pollutants, Appl. Catal., B, 2016, 181, 465–474 CrossRef CAS.
- J. L. Wang and L. J. Xu, Advanced oxidation processes for wastewater treatment: formation of hydroxyl radical and application, Crit. Rev. Environ. Sci. Technol., 2012, 42, 251–325 CrossRef CAS.
- K. Hashimoto, H. Irie and A. Fujishima, TiO2 photocatalysis: A historical overview and future prospects, Jpn. J. Appl. Phys., 2005, 12, 8269–8285 CrossRef.
- J. Zhang, Q. Xu, Z. Feng, M. Li and C. Li, Importance of the Relationship between Surface Phases and Photocatalytic Activity of TiO2, Angew. Chem., Int. Ed., 2008, 9, 1766–1769 CrossRef PubMed.
- G. K. Mor, H. E. Prakasam, O. K. Varghese, K. Shanker and C. A. Grimes, Vertically Oriented Ti−Fe−O Nanotube Array Films: Toward a Useful Material Architecture for Solar Spectrum Water Photoelectrolysis, Nano Lett., 2007, 7, 2356–2364 CrossRef CAS PubMed.
- Z. Jiang, F. Yang, N. J. Luo, B. T. T. Chu, D. Sun, H. H. Shi, T. C. Xiao and P. Edwards, Solvothermal synthesis of N-doped TiO2 nanotubes for visible-light-responsive photocatalysis, Chem. Commun., 2008, 47, 6372–6374 RSC.
- R. Asahi, T. Morikawa, T. Ohwaki, K. Aoki and Y. Taga, Visible-light photocatalysis in nitrogen-doped titanium oxides, Science, 2001, 293, 269–271 CrossRef CAS PubMed.
- C. Wang, J. C. Zhao, X. Wang, B. X. Mai, G. Y. Sheng, P. A. Peng and J. M. Fu, Preparation, characterization and photocatalytic activity of nano-sized ZnO/SnO2 coupled photocatalysts, Appl. Catal., B, 2002, 39, 269–279 CrossRef CAS.
- S. Anandan and M. Yoon, Photocatalytic activities of the nano-sized TiO2-supported Y-zeolites, J. Photochem. Photobiol., C, 2003, 4, 5–18 CrossRef CAS.
- A. K. Geim and K. S. Novoselov, The rise of graphene, Nat. Mater., 2007, 6, 183–191 CrossRef CAS PubMed.
- K. S. Novoselov, A. K. Geim, S. V. Morozov, D. Jiang, Y. Zhang, S. V. Dubonos, I. V. Grigorieva and A. A. Firsov, Electric Field Effect in Atomically Thin Carbon Films, Science, 2004, 306, 666–669 CrossRef CAS PubMed.
- P. Gao, A. Lib, D. Delai Suna and W. Jern Nga, Effects of various TiO2 nanostructures and graphene oxide on photocatalytic activity of TiO2, J. Hazard. Mater., 2014, 279, 96–104 CrossRef CAS PubMed.
- K. Woan, G. Pyrgiotakis and W. Sigmund, Photocatalytic carbon-nanotube–TiO2 composites, Adv. Mater., 2009, 21, 2233–2239 CrossRef CAS.
- D. A. Dikin, S. Stankovich, E. J. Zimney, R. D. Piner, G. H. B. Dommett, G. Evmenenko, S. T. Nguyen and R. S. Ruoff, Preparation and characterization of graphene oxide paper, Nature, 2007, 448, 2277–2289 CrossRef PubMed.
- T. Cassagneau and J. H. Fendler, Preparation and Layer-by-Layer Self-Assembly of Silver Nanoparticles Capped by Graphite Oxide Nanosheets, J. Phys. Chem., 1999, 103, 1789–1793 CrossRef CAS.
- H.-J. Shin, K. K. Kim, A. Benayad, S.-M. Yoon, H. K. Park, I.-S. Jung, M. H. Jin, H.-K. Jeong, J. M. Kim, J.-Y. Choi and Y. H. Lee, Efficient Reduction of Graphite Oxide by Sodium Borohydride and Its Effect on Electrical Conductance, Adv. Funct. Mater., 2009, 19, 1987–1992 CrossRef CAS.
- Q. Xiang, J. Yu and M. Jaroniec, Enhanced photocatalytic H2-production activity of graphene-modified titania nanosheets, Nanoscale, 2011, 3, 3670–3678 RSC.
- X.-Y. Zhang, H.-P. Li, X.-L. Cui and Y. Lin, Graphene/TiO2 nanocomposites: synthesis, characterization and application in hydrogen evolution from water photocatalytic splitting, J. Mater. Chem., 2010, 20, 2801–2806 RSC.
- G. P. Sing, K. M. Shrestha, A. Nepal, K. J. Klabunde and C. M. Sorensen, Graphene supported plasmonic photocatalyst for hydrogen evolution in photocatalytic water splitting, Nanotechnology, 2014, 26, 265701–265712 CrossRef PubMed.
- Y. Liu, Hydrothermal synthesis of TiO2-RGO composites and their improved photocatalytic activity in visible light, RSC Adv., 2014, 4, 36040–36045 RSC.
- D. Wang, X. Li, J. Chen and X. Tao, Enhanced photoelectron catalytic activity of reduced graphene oxide/TiO2 composite film for dye degradation, Chem. Eng. J., 2012, 198–199, 547–554 CrossRef CAS.
- R. M. Mohamed, UV-assisted photocatalytic synthesis of TiO2-reduced graphene oxide with enhanced photocatalytic activity in decomposition of sarin in gas phase, Desalin. Water Treat., 2002, 50, 1–10 Search PubMed.
- F. Wang and K. Zhang, Reduced graphene oxide-TiO2 nanocomposite with high photocatalytic activity for the degradation of rhodamine B, J. Mol. Catal. A: Chem., 2011, 345, 101–107 CrossRef CAS.
- Y. Zhang, Z.-R. Tang, X. Fu and Y.-J. Xu, TiO2-graphene nanocomposites for gas-phase photocatalytic degradation of volatile aromatic pollutants: Is TiO2-graphene truly different from other TiO2-carbon composite materials?, ACS Nano, 2010, 12, 7303–7314 CrossRef PubMed.
- P. Chen, K. G. Linden, D. E. Hinton, S. Kashiwada, E. J. Resenfeldt and S. W. Kullman, Biological assessment of bisphenol A degradation in water following direct photolysis and UV advanced oxidation, Chemosphere, 2006, 65, 1094–1102 CrossRef CAS PubMed.
- D. C. Marcano, D. V. Dmitry, J. M. Berlin, A. Sinitski, Z. Sun, A. Slesarev, L. B. Alemany, W. Lu and J. M. Tour, Improved synthesis of graphene oxide, ACS Nano, 2010, 4, 4806–4814 CrossRef CAS PubMed.
- C. J. Howard, T. M. Sabine and F. Dickson, Structural and thermal parameters for rutile and anatase, Acta Crystallogr., Sect. B: Struct. Sci., 1991, 47, 462–468 CrossRef.
- B. Erjavec, T. Tišler, R. Kaplan and A. Pintar, Titanate nanotubes as a novel catalyst for removal of toxicity and estrogenicity of bisphenol A in the CWAO process, Ind. Eng. Chem. Res., 2013, 52, 12559–12566 CrossRef CAS.
- A. Trapalis, N. Todorova, T. Giannakopoulou, N. Boukos, T. Speliotis, D. Dimotikali and J. Yu, TiO2/graphene composite photocatalysis for NOx removal: A comparison of surfactant-stabilized graphene and reduced graphene oxide, Appl. Catal., B, 2016, 180, 637–647 CrossRef CAS.
- T.-D. Nguyen-Phan, V. H. Pham, E. W. Shin, H.-D. Pham, S. Kim, J. S. Chung, E. J. Kim and S. H. Hur, The role of graphene oxide content on adsorption-enhanced photocatalysis of titanium dioxide/graphene oxide composites, Chem. Eng. J., 2011, 170, 226–232 CrossRef CAS.
- B. Erjavec, R. Kaplan and A. Pintar, Effects of heat and peroxide treatment on photocatalytic activity of titanate nanotubes, Catal. Today, 2015, 241, 15–24 CrossRef CAS.
- P. T. N. Nguyen, C. Salim, W. Kurniawan and H. Hinode, A non-hydrolytic sol-gel synthesis of reduced graphene oxide/TiO2 microsphere photocatalysis, Catal. Today, 2014, 230, 166–173 CrossRef CAS.
- D. Liang, C. Cui, H. Hu, Y. Wang, S. Xu, B. Ying, P. Li, B. Lu and H. Shen, One-step hydrothermal synthesis of anatase TiO2/reduced graphene oxide nanocomposites with enhanced photocatalytic activity, J. Alloys Compd., 2014, 582, 236–240 CrossRef CAS.
- H. Dang, H. Dong, Y. Dong and J. Huang, Facile and green synthesis of tinanate nanotube/graphene nanocomposites for photocatalytic H2 generation from water, Int. J. Hydrogen Energy, 2013, 38, 9178–9185 CrossRef CAS.
- P. Kluson, P. Kacer, T. Cajthamlb and M. Kalajic, Preparation of titania mesoporous materials using a surfactant-mediated sol-gel method, J. Mater. Chem., 2001, 11, 644–651 RSC.
- O. Akhavana, M. Abdolahadb, Y. Abdib and S. Mohajerzadehb, Synthesis of titania/carbon nanotube heterojunction arrays for photoinactivation of E. coli in visible light irradiation, Carbon, 2009, 47, 3280–3287 CrossRef.
- S. A. Chambers, T. Droubay, T. C. Kaspar and M. Gutowski, Experimental determination of valence band maxima for SrTiO3, TiO2, and SrO and the associated valence band offsets with Si(001), J. Vac. Sci. Technol., B, 2004, 22, 2205–2215 CAS.
- M. A. Velasco-Soto, S. A. Pérez-Garcíaa, J. Alvarez-Quintana, Y. Caoc, L. Nyborgc and L. Licea-Jiméneza, Selective band gap manipulation of graphene oxide by its reduction with mild reagents, Carbon, 2015, 93, 967–973 CrossRef CAS.
- X. Pan, Y. Zhao, S. Liu, C. L. Korzeniewski, S. Wang and Z. Fan, Comparing graphene-TiO2 nanoparticle composite photocatalysts, ACS Appl. Mater. Interfaces, 2012, 3944–3950 CAS.
- Y. Fan, H.-T. Lu, J.-H. Liu, C.-P. Yang, Q.-S. Jing, Y.-X. P. Zhang, X.-K. Yang and K.-J. Huang, Hydrothermal preparation and electrochemical sensing properties of TiO2-graphene nanocomposite, Colloids Surf., B, 2011, 78–82 CrossRef CAS PubMed.
- J. Yu, J. Low, W. Xiao, P. Zhou and M. Jaroniec, Enhanced photocatalytic CO2-reduction activity of anatase TiO2 by coexposed {001} and {101} Facets, J. Am. Chem. Soc., 2014, 136, 8839–8842 CrossRef CAS PubMed.
- A. Adán-Más and D. Wei, Photoelectrochemical Properties of Graphene and Its Derivatives, Nanomaterials, 2013, 3, 325–356 CrossRef.
- P. Dong, Y. Wang, L. Guo, B. Liu, S. Xin, J. Zhang, Y. Shi, W. Zenga and S. Yinb, A facile one-step solvothermal synthesis of graphene/rod-shaped TiO2 nanocomposite and its improved photocatalytic activity, Nanoscale, 2012, 4(15), 4641–4649 RSC.
Footnote |
| † Electronic supplementary information (ESI) available. See DOI: 10.1039/c7nr00704c |
| This journal is © The Royal Society of Chemistry 2017 |