 Open Access Article
Creative Commons Attribution 3.0 Unported Licence
Suppression of electrical conductivity and switching of conduction mechanisms in ‘stoichiometric’ (Na0.5Bi0.5TiO3)1−x(BiAlO3)x (0 ≤ x ≤ 0.08) solid solutions
Fan
Yang
 *,
Patrick
Wu
and
Derek C.
Sinclair
 *
*
Department of Materials Science & Engineering, University of Sheffield, Mappin Street, Sheffield, S1 3JD, UK. E-mail: fan.yang@sheffield.ac.uk; d.c.sinclair@sheffield.ac.uk
First published on 27th June 2017
Abstract
(Na0.5Bi0.5TiO3)1−x(BiAlO3)x (0 ≤ x ≤ 0.08) solid solutions were prepared by a solid state reaction and their electrical properties were established by ac impedance spectroscopy and electromotive force transport number measurements. Incorporation of BiAlO3 (BA) decreases the electrical conductivity of Na0.5Bi0.5TiO3 (NBT) and sequentially changes the conduction mechanism with increasing x from predominant oxide-ion conduction to mixed ionic–electronic conduction and finally to predominant electronic conduction. The suppressed oxide-ion conduction by BA incorporation significantly reduces the dielectric loss at elevated temperatures and produces excellent high-temperature dielectric materials for high BA contents. The possible reasons for the suppressed oxide-ion conduction in the NBT–BA solid solutions have been discussed and we propose that the local structure, especially trapping of oxygen vacancies by Al3+ on the B-site, plays a key role in oxide-ion conduction in these apparently ‘stoichiometric’ NBT-based solid-solution perovskite materials.
Introduction
Sodium bismuth titanate, Na0.5Bi0.5TiO3 (NBT), is considered a promising lead-free piezoelectric material to replace lead zirconate titanate (PZT) because of its high Curie temperature (Tc ∼ 325 °C), relatively high remnant polarization (Pr = 38 μC cm−2) and piezoelectric constant (d33 = 73 pC N−1).1–3 NBT was first reported in the 1960s and has been receiving increasing attention in recent years driven by the surge in developing lead-free materials.4 One major drawback of NBT as a piezoelectric/dielectric material can be its high electrical conductivity which leads to high dielectric loss (tan![[thin space (1/6-em)]](https://www.rsc.org/images/entities/char_2009.gif) δ) and leakage currents at elevated temperatures.1 Many studies have been carried out to modify the electrical properties of NBT by forming solid solutions with other perovskites,5–13 among which the NBT–BiAlO3 system has been reported to present excellent ferroelectric and piezoelectric properties compared with NBT.12,13
δ) and leakage currents at elevated temperatures.1 Many studies have been carried out to modify the electrical properties of NBT by forming solid solutions with other perovskites,5–13 among which the NBT–BiAlO3 system has been reported to present excellent ferroelectric and piezoelectric properties compared with NBT.12,13
BiAlO3 (BA) is a relatively new lead-free ferroelectric material with a high Tc.14–16 Its large ferroelectric polarization and piezoelectricity were first predicted using density functional theory reported by Baettig et al.14 and later confirmed by experiments.15,16 BiAlO3 has a rhombohedral perovskite-type structure at room temperature with Al3+ on an octahedral site. It has a Tc > 520 °C, d33 = 28 pC N−1, and Pr = 9.5 μC cm−2 at room temperature which increases to 26.7 μC cm−2 at 225 °C.15 BiAlO3 can only be prepared under high pressure (e.g., 6 GPa), and it decomposes around 550 °C; however, it can be partially stabilized by forming solid solutions with other perovskite materials such as BaTiO317 and NBT12,13,18,19 to modify the structure and properties of the host.
(NBT)1−x(BA)x solid solutions have been studied by several researchers. Yu and Ye12 reported that the NBT–BA system can remain single phase up to x = 0.08. They found that incorporation of BA into NBT enhanced Pr and d33, decreased Ec and significantly reduced the dielectric loss at elevated temperatures. Watanabe et al.18 also reported a solid solution limit of 8% for BA in NBT and an increased d33 with increasing x. Ullah et al.13 reported optimised ferroelectric and piezoelectric properties at x = 0.05 and a rhombohedral to pseudocubic phase transition at x = 0.075. Manotham et al.19 compared the properties of (NBT)0.94(BA)0.06 ceramics prepared by two-step sintering and conventional sintering. Peng et al.20 combined the results from dielectric measurements and transmission electron microscopy to suggest the co-existence of ferroelectric and anti-ferroelectric phases in (NBT)0.92(BA)0.08 ceramics. The above studies focus mainly on the improvement of the ferroelectric/piezoelectric properties of NBT by BA incorporation. There is little information about the effect of BA on the electrical conductivity and conduction mechanism of NBT, which are critical to the dielectric loss and leakage current of NBT.21–23
Our previous studies have shown that NBT displays a variety of electrical behaviour.21–24 The nominally stoichiometric NBT (nominal Na0.5Bi0.5TiO3; NB0.50T) presents high conductivity with an oxide-ion transport number tion ∼ 0.9 at 600–800 °C. As tion is the fraction of the total current carried by oxygen ions, such a high tion suggests that the electrical conduction is dominated by oxygen ions. The predominance of oxide-ion conduction (as opposed to sodium ion or electronic conduction) in NB0.50T has been further confirmed by 18O tracer diffusion measurements. The high oxide-ion conductivity in NB0.50T is attributed to oxygen vacancies generated through low levels of Bi2O3 loss during ceramic processing according to the Kroger–Vink equation,
 | (1) |
Mixed ionic–electronic conduction followed by low levels of electronic conduction and therefore an excellent high temperature dielectric behaviour was also observed for Nb-doped NBT. This study was based on Nb-replacing Ti on the B-sites with incorporation of excess oxygen ‘filling’ the oxygen vacancies associated with Bi2O3 loss during processing.23 Based on the magnitude of bulk conductivity, σb and tion values, we concluded that undoped NBT and Nb-doped NBT can exhibit three types of electrical behaviour: type I, predominant oxide-ion conduction, high σb, tion ∼ 0.9; type II, mixed ionic–electronic conduction, intermediate σb, tion ∼ 0.5; type III, predominant electronic conduction, low σb, tion < 0.1. These three types of electrical behaviour can be clearly distinguished from the tan![[thin space (1/6-em)]](https://www.rsc.org/images/entities/char_2009.gif) δ–T relationship (measured at 1 MHz). Type I NBT shows a sharp rise of tan
δ–T relationship (measured at 1 MHz). Type I NBT shows a sharp rise of tan![[thin space (1/6-em)]](https://www.rsc.org/images/entities/char_2009.gif) δ with increasing temperature and tan
δ with increasing temperature and tan![[thin space (1/6-em)]](https://www.rsc.org/images/entities/char_2009.gif) δ exceeds 0.2 at ∼350 °C. In contrast, type III presents low tan
δ exceeds 0.2 at ∼350 °C. In contrast, type III presents low tan![[thin space (1/6-em)]](https://www.rsc.org/images/entities/char_2009.gif) δ in a wide temperature range (<0.02 from 300 to 600 °C), making it an excellent high-temperature dielectric material. In between types I and III, type II shows low tan
δ in a wide temperature range (<0.02 from 300 to 600 °C), making it an excellent high-temperature dielectric material. In between types I and III, type II shows low tan![[thin space (1/6-em)]](https://www.rsc.org/images/entities/char_2009.gif) δ in a narrow temperature range and a steep rise above ∼500 °C to exceed 0.1 at 600 °C.
δ in a narrow temperature range and a steep rise above ∼500 °C to exceed 0.1 at 600 °C.
The above findings not only reveal the electrical conduction mechanisms of NBT but also show the flexibility in tailoring the properties of NBT for various applications such as piezoelectric/dielectric devices, oxide-ion conductors and mixed ionic–electronic conductors. Here, the electrical conductivity and conduction mechanism of (NBT)1−x(BA)x (0 ≤ x ≤ 0.08) solid solutions were studied by impedance spectroscopy and electromotive force measurements. The purpose is not only to investigate the effect of BA on the electrical conductivity of NBT, but also to further understand the factors that control the oxide-ion conduction in NBT to tailor its electrical properties. The results show that BA incorporation decreases the electrical conductivity of NBT and changes the conduction mechanism from predominantly oxygen-ion conduction to mixed ionic–electronic conduction and then to predominantly electronic conduction with increasing BA content. The suppressed conductivity and changes in conduction mechanisms significantly reduce the dielectric loss at elevated temperatures to make NBT an excellent high-temperature dielectric material. This study provides an alternative approach to fine-tune the electrical properties of NBT as opposed to manipulating the A-site Na/Bi non-stoichiometry in undoped materials or by B-site Nb donor doping.
Experimental
(Na0.5Bi0.5TiO3)1−x(BiAlO3)x (0 ≤ x ≤ 0.08) solid solutions were prepared by a solid-state reaction method using Na2CO3 (99.5%, Fisher chemical, UK), Bi2O3 (99.9%, Acros Organics, USA), TiO2 (99.9%, Sigma Aldrich, UK) and Al2O3 (99.95%, Alfa Aesar, UK) as starting materials. Prior to weighing, the raw powders were dried overnight at 300 °C for Na2CO3 and Bi2O3, 800 °C for TiO2 and 900 °C for Al2O3. Appropriate amounts of each precursor were weighed and mixed thoroughly in iso-propanol using yttria-stabilised zirconia grinding media for 6 h. The mixture was dried at 85 °C overnight, sieved and calcined at 850 °C for 2 h. The resultant powder was subjected to a second round of ball milling, drying, sieving and calcined at 900 °C for 2 h. After a third round of milling, drying and sieving, the final powder was compacted into pellets by uni-axial cold pressing followed by isostatic pressing at 200 MPa. Pellets were embedded in sacrificial powder of the same composition and sintered at 1175 °C for 2 h in air. For pure NBT, powder was calcined at 800 °C twice and the pellet was sintered at 1150 °C. After sintering, pellets were ground on SiC sand paper to remove the sacrificial powder. Pellets of ∼0.85 cm in diameter and ∼0.15 cm in thickness were used for impedance and LCR measurements.Ceramic density was measured by the Archimedes' method and compared to the theoretical X-ray density. Phase purity was examined by X-ray diffraction on crushed pellets using a high-resolution STOE STADI-P diffractometer (STOE & Cie GmbH, Darmstadt, Germany) operating with CuKα1 radiation with a linear position-sensitive detector. Before measurements, the crushed pellets were annealed at 400 °C for 4 h to eliminate any residual stress caused by crushing and grinding. Structural refinement was carried out for reflections in the range of 20° ≤ 2θ ≤ 80° using EXPGUI.27,28 Ceramic microstructures were observed by scanning electron microscopy on thermally-etched surfaces using a Philips XL30 SEM. Compositions were obtained by energy-dispersive X-ray spectroscopy (EDS) on carbon-coated polished surfaces (without thermal etching). Raman spectroscopy measurements were carried out using a 514 nm Ar laser line in a Renishaw inVia Raman microscope.
Electrical properties of the pellets were obtained from ac impedance spectroscopy using an Agilent E4980A impedance analyser (Agilent Technologies Inc, Palo Alto, CA; frequency range 1 MHz to 20 Hz) and/or a Solartron 1260 system (Solartron Analytical, UK; frequency range 1 MHz to 0.1 Hz). Before measurements, Au paste was painted to cover both surfaces of the pellets and then fired at 800 °C for 2 h to serve as electrodes. Measurements were carried out in flowing N2, air and O2 from 400 to 800 °C at increments of 50 °C. The equilibrium time between each measurement was 30 minutes. Equivalent circuit fitting was performed using ZView software (Scribner Associates, Inc, Southern Pines, NC). Dielectric properties were measured using an LCR meter (Agilent E4980 Precision LCR Meter, Agilent Technologies) with an applied ac voltage of 100 mV. Data points were collected every 60 s from room temperature (RT) to 800 °C using a non-inductively wound tube furnace at a ramping rate of 1 °C min−1. Oxygen-ion transport number measurements were performed using a ProboStat system (NorECs Norwegian Electro Ceramics AS, Oslo, Norway). A sample of ∼1.7 cm in diameter and ∼0.2 cm in thickness was sealed onto an YSZ tube using a commercial glass frit. Before that, Pt electrodes of ∼1.0 cm in diameter were coated onto the centre of the pellet surfaces and fired at 900 °C for 2 h. An oxygen partial pressure (pO2) difference was created across the ceramic by flowing N2 into the YSZ tube and leaving the outside of the ceramic in air. The pO2 difference was monitored by measuring the voltage across the inner and outer electrodes using the YSZ tube. The voltage was measured using a Keithley 182 sensitive digital voltmeter. More details of transport number measurements can be found in ref. 21.
Results
Phase, composition and microstructure
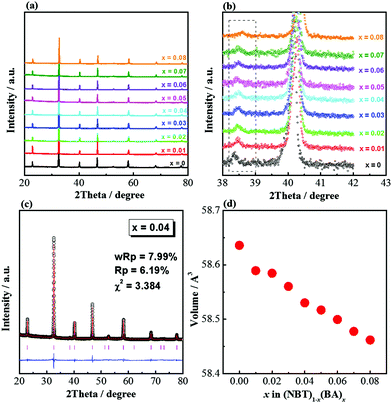
(NBT)1−x(BA)x (0 ≤ x ≤ 0.08) solid solutions are phase-pure based on XRD patterns (Fig. 1a). An expanded view of the 2θ range between 38 and 42° shows the superlattice reflection of a rhombohedral structure for all compositions (Fig. 1b). The structure could be refined to a rhombohedral cell (space group R3c; Fig. 1c). The pseudo-cubic cell volume decreases with increasing x (Fig. 1d). The relative density of sintered ceramics was >95%, as listed in Table 1.| Composition x | Density | ||
|---|---|---|---|
| Theoretical (g cm−3) | Experimental (g cm−3) | Relative (%) | |
| 0 | 6.00 | 5.72 | 95.3 |
| 0.01 | 6.03 | 5.91 | 98.0 |
| 0.02 | 6.05 | 5.98 | 98.8 |
| 0.03 | 6.07 | 5.95 | 98.0 |
| 0.04 | 6.09 | 5.88 | 96.6 |
| 0.05 | 6.12 | 5.99 | 97.9 |
| 0.06 | 6.14 | 5.87 | 95.6 |
| 0.07 | 6.16 | 6.06 | 98.4 |
| 0.08 | 6.18 | 5.87 | 95.0 |
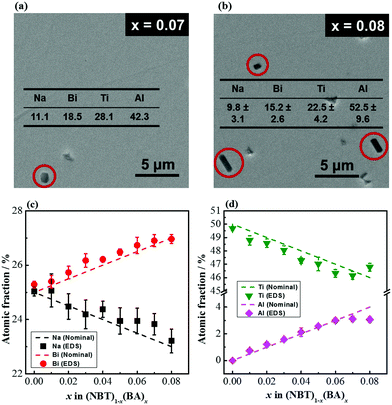
Although these samples are phase-pure based on the XRD patterns, SEM micrographs of polished surfaces for x = 0.07 and 0.08 showed the presence of small amounts of an Al-rich secondary phase (Fig. 2a and b). EDS analysis of the solid solutions shows that the atomic fractions of the A-site (Na, Bi) cations are close to their nominal values (Fig. 2c); the atomic fractions of Al3+ on the B-site slightly deviate from their nominal values for x = 0.07 and 0.08 because of the presence of the Al-rich secondary phase (Fig. 2d).
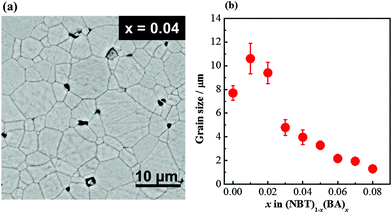
A typical SEM micrograph of a thermally-etched surface of a solid solution is shown in Fig. 3a. Average grain sizes of the solid solutions decrease with increasing x from ∼10 μm for x = 0.01 to ∼1.5 μm for x = 0.08. Undoped NBT has smaller grains compared to x = 0.01 and 0.02, which may be due to the lower sintering temperature (1150 °C) compared to 1175 °C for the solid solutions.
Raman spectroscopy
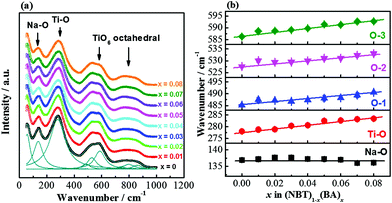
Room-temperature Raman spectra of (NBT)1−x(BA)x (0 ≤ x ≤ 0.08) solid solutions are shown in Fig. 4a. The spectrum of NBT is consistent with previous reported data29–32 and the spectra of NBT–BA solid solutions show similar features, where broad bands are observed due to the A-site Na/Bi disorder and overlapping Raman modes. Between 100 and 1000 cm−1, there are four main regions, from low to high wavenumbers, attributing to Na–O (∼135 cm−1), Ti–O (∼280 cm−1) and TiO6 octahedral (400–1000 cm−1) vibrations/rotations, respectively. The spectra can be deconvoluted into eight peaks using Lorentzian functions, and the evolution of the peak positions of the main modes as a function of x is shown in Fig. 4b. There is no clear frequency shift of the Na–O band with increasing x; whereas the Ti–O and TiO6 octahedral bands show a systematic shift to a higher frequency with increasing x. Raman frequency, ω, is determined by , where k is the force constant and μ is the reduced mass based on the harmonic oscillator approximation. The ionic radius of Al3+ (0.535 Å, 6-fold co-ordination) is smaller than that of Ti4+ (0.605 Å, 6-fold co-ordination), resulting in a shorter bond length and thus a higher force constant k.33 The relative atomic mass of Al (26.98) is also lower than Ti (47.87). Because of the smaller ionic size and atomic mass of Al, the Ti–O band shifts to a higher frequency with increasing x. The TiO6 octahedral bands are dominated by vibrations involving mainly oxygen displacement, and thus are expected to be unaffected by the mass of the cations. The shift to a higher frequency of these bands is due to an increased force constant k caused by the smaller ionic size of Al3+. Raman spectra further confirm the formation of NBT–BA solid solutions, and the Ti–O band shift to high frequency gives evidence that Al3+ goes to the Ti-site of NBT as desired.
Electrical properties
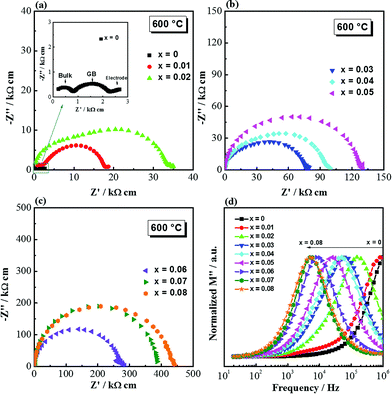
Complex impedance plane (Z*) plots of (NBT)1−x(BA)x (0 ≤ x ≤ 0.08) solid solutions measured at 600 °C are shown in Fig. 5a–c. The Z* plot for NBT shows three well-resolved arcs (inset of Fig. 5a), from high to low frequency, corresponding to responses from bulk, grain boundary and electrode effects, respectively. This is consistent with our previous report.21,23 For the NBT–BA solid solutions, the Z* plots show the following evolution with increasing BA concentration: (1) the magnitude of impedance, for both the bulk and grain boundary regions, increases with increasing x; (2) the two responses from the bulk and grain boundaries become less well-resolved with increasing x (0.01 ≤ x ≤ 0.05) and eventually merge into a single arc for x ≥ 0.06. The associated capacitance of the single arc is ∼7 × 10⁻¹¹ F cm−1, corresponding to a relative permittivity (εr) of ∼800, which agrees with the value for paraelectric NBT materials at this temperature. Therefore, the single arc in the Z* plots for x ≥ 0.06 represents the bulk response. The decreasing resolution for the two arcs on the Z* plots for 0.01 ≤ x ≤ 0.05 is attributed to the closer time constant (τ) for the bulk and the grain boundary components with increasing x. The impedance data are also presented as M′′–log![[thin space (1/6-em)]](https://www.rsc.org/images/entities/char_2009.gif) f spectroscopic plots (Fig. 5d). M is the electric modulus and its complex form is defined as M* = jωC0Z*, where ω is the angular frequency, C0 is the capacitance of an empty cell and Z* is the complex impedance. For easy comparison, M′′ (the imaginary component of M*) was normalized to its peak maximum and it shows a systematic peak shift to a lower frequency with increasing x. The M′′ peak position, fmax = 1/(2πRC), is an intrinsic property of a material. As C does not show significant change with composition, a peak shift to a lower frequency indicates a decrease in conductivity (and therefore an increase in resistance).
f spectroscopic plots (Fig. 5d). M is the electric modulus and its complex form is defined as M* = jωC0Z*, where ω is the angular frequency, C0 is the capacitance of an empty cell and Z* is the complex impedance. For easy comparison, M′′ (the imaginary component of M*) was normalized to its peak maximum and it shows a systematic peak shift to a lower frequency with increasing x. The M′′ peak position, fmax = 1/(2πRC), is an intrinsic property of a material. As C does not show significant change with composition, a peak shift to a lower frequency indicates a decrease in conductivity (and therefore an increase in resistance).
For 0 ≤ x ≤ 0.02, the relatively well-resolved impedance spectra were fitted by an equivalent circuit of three series-connected R-CPE elements to obtain the resistances Rb, Rgb and Rtot (Rtot = Rb + Rgb). For 0.03 ≤ x ≤ 0.08, the bulk resistance was calculated from the M′′ peak frequency and peak maximum, and the total resistance was obtained from the Z′ intercept on Z* plots. This is to avoid large errors from equivalent circuit fitting due to the less well-resolved impedance responses from the bulk and grain boundary components. Rb and Rtot were converted to σb (= 1/Rb) and σtot (= 1/Rtot) and presented in Arrhenius plots (Fig. 6), where systematic decreases of σb and σtot with increasing x can be observed.
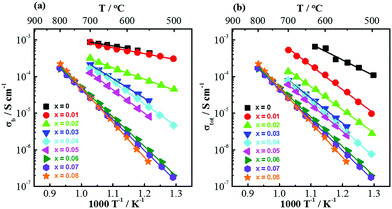 | ||
| Fig. 6 Arrhenius plots for (a) bulk conductivity and (b) total conductivity of the (NBT)1−x(BA)x (0 ≤ x ≤ 0.08) solid solutions measured in air. | ||
Activation energies (Ea) for σb and σtot are listed in Table 2. For σb, there is a notable change in the activation energy (Ea) with increasing x from ≪1 eV for 0 ≤ x ≤ 0.02, ∼1.2 eV for x = 0.04, 0.05 and to >1.6 eV for 0.06 ≤ x ≤ 0.08. Ea for σtot also increases with x from ∼0.9 eV for x = 0, 1.3–1.5 eV for 0.01 ≤ x ≤ 0.05 to >1.6 eV for 0.06 ≤ x ≤ 0.08.
| Composition x | E a (eV) | |
|---|---|---|
| Bulk | Total | |
| 0 | 0.31 ± 0.03 | 0.87 ± 0.08 |
| 0.01 | 0.32 ± 0.02 | 1.31 ± 0.03 |
| 0.02 | 0.63 ± 0.02 | 1.26 ± 0.03 |
| 0.03 | 1.07 ± 0.01 | 1.37 ± 0.01 |
| 0.04 | 1.21 ± 0.03 | 1.54 ± 0.01 |
| 0.05 | 1.28 ± 0.01 | 1.48 ± 0.01 |
| 0.06 | 1.62 ± 0.02 | 1.62 ± 0.02 |
| 0.07 | 1.67 ± 0.01 | 1.67 ± 0.01 |
| 0.08 | 1.90 ± 0.01 | 1.90 ± 0.01 |
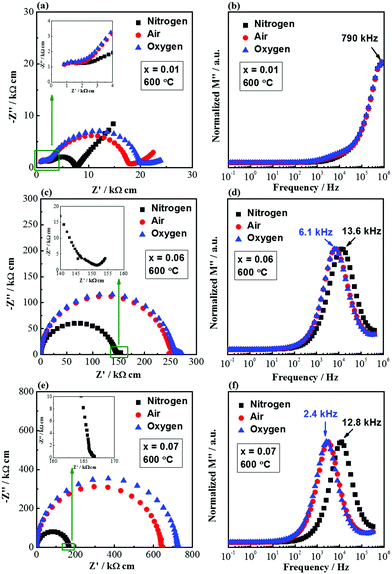
Fig. 7 shows the impedance spectra measured in flowing nitrogen, air and oxygen for selected compositions showing the effect of pO2. For x = 0.01, the bulk response does not change with pO2, as shown in the inset of Fig. 7a and the overlapping peaks in the M′′–log![[thin space (1/6-em)]](https://www.rsc.org/images/entities/char_2009.gif) f spectroscopic plots (Fig. 7b). This suggests that bulk conduction is dominated by ionic species. The grain boundary impedance is dependent on pO2: it is the lowest in N2 and the highest in O2, indicating the presence of n-type electronic conduction. It is also noteworthy to mention that the low-frequency electrode spike is most prominent in N2 and least prominent in O2, suggesting the presence of oxide-ion conduction. For x = 0.06, the Z* plots show the smallest single arc in N2 and the largest arc in O2 (Fig. 7c), and the M′′–log
f spectroscopic plots (Fig. 7b). This suggests that bulk conduction is dominated by ionic species. The grain boundary impedance is dependent on pO2: it is the lowest in N2 and the highest in O2, indicating the presence of n-type electronic conduction. It is also noteworthy to mention that the low-frequency electrode spike is most prominent in N2 and least prominent in O2, suggesting the presence of oxide-ion conduction. For x = 0.06, the Z* plots show the smallest single arc in N2 and the largest arc in O2 (Fig. 7c), and the M′′–log![[thin space (1/6-em)]](https://www.rsc.org/images/entities/char_2009.gif) f spectroscopic plots show a peak shift towards high frequency in N2 (Fig. 7d). The low-frequency electrode spike is still present in N2, as shown in the inset of Fig. 7c. The pO2-dependent impedance and the low frequency spike suggest a mixed ionic–electronic conduction mechanism. The conducting species are electrons and oxygen ions. For x = 0.07, the Z* and M′′–log
f spectroscopic plots show a peak shift towards high frequency in N2 (Fig. 7d). The low-frequency electrode spike is still present in N2, as shown in the inset of Fig. 7c. The pO2-dependent impedance and the low frequency spike suggest a mixed ionic–electronic conduction mechanism. The conducting species are electrons and oxygen ions. For x = 0.07, the Z* and M′′–log![[thin space (1/6-em)]](https://www.rsc.org/images/entities/char_2009.gif) f plots show a similar pO2-dependence as x = 0.06; however, the low-frequency electrode spike is less apparent (inset of Fig. 7e). This suggests that the bulk conduction is dominated by an n-type electronic conduction mechanism.
f plots show a similar pO2-dependence as x = 0.06; however, the low-frequency electrode spike is less apparent (inset of Fig. 7e). This suggests that the bulk conduction is dominated by an n-type electronic conduction mechanism.
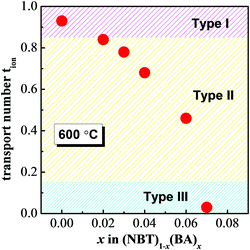
Oxygen-ion transport number, tion, at 600 °C for selected compositions of x is shown in Fig. 8. tion drops from >0.9 for NBT (x = 0), to 0.4–0.8 for 0.02 ≤ x ≤ 0.06 and to <0.1 for x = 0.07. This agrees with the information extracted from Fig. 7. According to the classification proposed in our previous study,23 the electrical conduction of NBT–BA solid solutions also displays three types of behaviour: type I: tion > 0.85, predominantly oxide-ion conduction; type II, 0.15 ≤ tion ≤ 0.85, mixed ionic–electronic conduction; type III, tion < 0.15, electronic conduction. Incorporation of BA into NBT is an alternative approach to tune the electrical conduction mechanism and conductivity of NBT-based materials as opposed to solely manipulating the A-site nonstoichiometry (Na/Bi ratio) or the B-site Nb doping.23
Dielectric properties
The permittivity–temperature (εr–T) profiles for selected compositions of the NBT–BA solid solutions are shown in Fig. 9a. The permittivity maximum decreases slightly with increasing x, from ∼3000 for NBT to ∼2700 for x = 0.07. The temperature where permittivity shows its maximum, Tm, also decreases with increasing x from ∼325 °C for NBT to ∼290 °C for x = 0.07. Incorporation of BA into NBT has a much more significant effect on the dielectric loss–temperature profile (Fig. 9b). NBT (x = 0) shows a sharp rise of tan![[thin space (1/6-em)]](https://www.rsc.org/images/entities/char_2009.gif) δ with increasing temperature and tan
δ with increasing temperature and tan![[thin space (1/6-em)]](https://www.rsc.org/images/entities/char_2009.gif) δ exceeds 0.2 at ∼350 °C. In contrast, x = 0.07 exhibits very low tan
δ exceeds 0.2 at ∼350 °C. In contrast, x = 0.07 exhibits very low tan![[thin space (1/6-em)]](https://www.rsc.org/images/entities/char_2009.gif) δ over a wide temperature range (<0.02 from 300 to 700 °C). Compositions in between x = 0 and 0.07 show low tan
δ over a wide temperature range (<0.02 from 300 to 700 °C). Compositions in between x = 0 and 0.07 show low tan![[thin space (1/6-em)]](https://www.rsc.org/images/entities/char_2009.gif) δ in a narrower temperature range and a steep rise above ∼600 °C, exceeding 0.1 at 650 °C.
δ in a narrower temperature range and a steep rise above ∼600 °C, exceeding 0.1 at 650 °C.
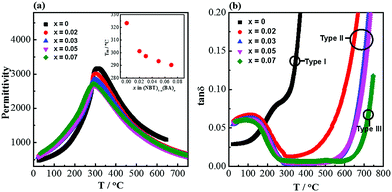 | ||
| Fig. 9 Dielectric spectroscopy for selected compositions of (NBT)1−x(BA)x (0 ≤ x ≤ 0.08) solid solutions: (a) permittivity at 1 MHz versus temperature. The inset figure shows the change of Tm as function of x. (b) Dielectric loss (1 MHz) versus temperature. Type I, II and III behaviour as defined in ref. 23. | ||
Discussion
The electrical conductivity of (NBT)1−x(BA)x (0 ≤ x ≤ 0.08) solid solutions decreases with increasing x and the conduction mechanism changes from predominantly oxygen-ion conduction via mixed ionic–electronic conduction to predominantly electronic conduction with a continuous drop of tion from >0.9 for x = 0 to <0.1 for x = 0.07. Incorporation of BA into NBT suppresses the oxide-ion conduction in NBT and makes it an excellent high-temperature dielectric material. Possible reasons for the suppressed oxide-ion conduction are discussed below.For a single type of charge carrier, the electrical conductivity is determined by σ = c·q·μ, where c, q and μ are the concentration, charge and mobility of the charge carriers, respectively. As the oxide-ion conduction is suppressed by BA incorporation, there is either a decrease in the concentration and/or a decrease in the mobility of the oxygen vacancies.
The oxide-ion conductivity of NBT originates from the oxygen vacancies generated through a small amount of Bi2O3-loss during ceramic processing as described in eqn (1). Our previous study24 showed that 0.5–1% donor (Nb) doping on the B-site of NBT can fill up the oxygen vacancies and significantly decrease the electrical conductivity. Therefore, the oxygen vacancy concentration in NBT is estimated to be in the range of 0.25–0.5%, corresponding to a Bi2O3-loss of 0.17–0.33%. Such a small loss of Bi2O3 is “accidental” and therefore difficult to control in a reproducible manner.24 With BA incorporation into NBT, the defect chemistry can be described by the following Kroger–Vink equation:
 | (2) |
Average structures
From general structural considerations, oxide-ion conductivity in a perovskite is often predicted by the following four empirical parameters:(1) Goldschmidt tolerance factor, t:34
 | (3) |
(2) The lattice free volume, Vsf:35
 | (4a) |
| V = [2.15rB + 2.72 − 1.40(s − 1)]3, | (4b) |
 | (4c) |
(3) The critical radius, rC, defined by Kilner and Brook:36
 | (5) |
(4) The average metal–oxygen bond energy, Eb, derived via a Born–Haber cycle:37
 | (6) |
The tolerance factor, t, describes the lattice distortion in the perovskite structure. A small t represents large lattice distortion and thus is detrimental to oxide-ion conduction.38 The specific free volume, Vsf, describes the free space inside a unit cell and a large Vsf is beneficial for the migration of oxygen ions. Hayashi et al.35 summarized the electrical conductivity data from literature and found an optimum t of 0.96 to obtain the maximum conductivity in perovskites. They attributed the maximized conductivity to a compromise between t and Vsf. The critical radius, rC, describes the saddle point formed by two A-site and one B-site cations. The larger the rC, the easier it is for the oxygen ions to pass through the saddle point. The average metal–oxygen bond energy, Eb, was found to have a linear relationship with the activation energy for oxygen migration: the smaller the absolute Eb, the lower the activation energy.37
The values of these four parameters of the NBT–BA solid solutions were calculated and are listed in Table 3. Thermodynamic data of the corresponding oxides and metals used to calculate Eb were obtained from ref. 39. With increasing BA content, Vsf, and rC decrease while t and the absolute value of Eb increase. These are all detrimental to oxide-ion conduction in perovskites. However, it should be noted that the change of these parameters with increasing x is quite small. Such a small change in the average structure is unlikely to result in such a dramatic change in conductivity.
| x | t | V sf | r C (Å) | E b (kJ mol−1) |
|---|---|---|---|---|
| 0 | 0.9841 | 0.2012 | 0.9074 | −240.24 |
| 0.01 | 0.9845 | 0.2006 | 0.9072 | −240.33 |
| 0.02 | 0.9848 | 0.2000 | 0.9069 | −240.43 |
| 0.03 | 0.9851 | 0.1995 | 0.9066 | −240.52 |
| 0.04 | 0.9855 | 0.1989 | 0.9063 | −240.61 |
| 0.05 | 0.9858 | 0.1984 | 0.9061 | −240.70 |
| 0.06 | 0.9862 | 0.1978 | 0.9058 | −240.79 |
| 0.07 | 0.9865 | 0.1972 | 0.9055 | −240.88 |
| 0.08 | 0.9869 | 0.1967 | 0.9052 | −240.97 |
Local structure
Compared to the average structure, the local structure has a more significant impact on the oxygen ion diffusion in NBT, as revealed by first-principles calculations.40–42 These calculations showed the lowest energy barriers for oxygen ion migration occur in saddle points between Bi–Bi–Ti ions (0.22 eV), whereas higher barriers are observed for Na–Bi–Ti (0.6–0.85 eV) and Na–Na–Ti (1.0–1.3 eV) saddle points. Experimentally there is no evidence for the long-range ordering of the A-site cations in NBT, and therefore the Na–Bi–Ti saddle points are considered as the rate-limiting step in the overall oxygen ion migration in NBT. For the NBT–BA solid solution, there is no evidence for the ordering of the A-site cations with BA incorporation: no additional XRD peaks or sharpening of Raman peaks were observed. Instead, the peak width of the ∼135 cm−1 band (Na–O vibration) increases with increasing x, as shown in Fig. 10. Consequently, the Na–Bi–Ti(Al) saddle points are considered to dominate the energy barrier for oxygen ion migration. As Al3+ is much smaller than Ti4+ and its polarizability is much smaller, i.e. αAl = 0.79 Å3![[thin space (1/6-em)]](https://www.rsc.org/images/entities/char_2009.gif) 43 compared to αTi = 2.93 Å3,43 it is more difficult for oxygen ions to pass through the Na–Bi–Al saddle point. With increasing x, the number of Na–Bi–Al saddle points increases and therefore the oxygen ion mobility is decreased. However, as the polarizability of Bi3+ (6.12 Å3
43 compared to αTi = 2.93 Å3,43 it is more difficult for oxygen ions to pass through the Na–Bi–Al saddle point. With increasing x, the number of Na–Bi–Al saddle points increases and therefore the oxygen ion mobility is decreased. However, as the polarizability of Bi3+ (6.12 Å3![[thin space (1/6-em)]](https://www.rsc.org/images/entities/char_2009.gif) 43) is much higher than Ti4+ and Al3+, local deformation at the saddle point when an oxygen ion is passing through should come mainly from Bi3+. The low polarizability of Al3+ may not be the determining factor for the suppressed conductivity.
43) is much higher than Ti4+ and Al3+, local deformation at the saddle point when an oxygen ion is passing through should come mainly from Bi3+. The low polarizability of Al3+ may not be the determining factor for the suppressed conductivity.
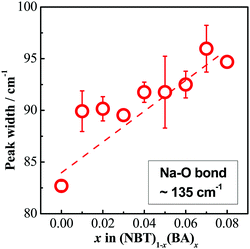 | ||
| Fig. 10 Peak width of the ∼135 cm−1 band as a function of x in (NBT)1−x(BA)x (0 ≤ x ≤ 0.08) solid solutions. | ||
To further understand the importance of the ionic radius and polarizability of the B-site “dopant”, (NBT)1−x(BiGaO3)x (BG, x = 0.02, 0.04, 0.06 and 0.08) solid solutions were prepared. NBT–BG shows a very similar behaviour as that of NBT–BA: the bulk conductivity also decreased with increasing x (unpublished results). Ga3+ has a comparable size (0.62 Å, 6-fold co-ordination) to Ti4+, indicating that the ionic size is not a critical factor.
The decreased mobility of charge carriers can originate from trapping of oxygen vacancies. As also revealed in ref. 41, substitution of Ti4+ by acceptor-type dopants (e.g., Mg2+) may significantly increase the oxygen migration barrier due to binding between negatively charged  and positively charged
  , even at temperatures >1000 K. In the case of NBT–BA solid solution,
  can trap
  to form the defect complex
  , which reduces the mobility of
  and thus decreases the ionic conductivity. The concentration of
  required to trap all
  for each composition (based on the formation of only the defect complex
  ) was estimated by
  and is listed in Table 4. When the BA content is low, i.e., x = 0.01, to trap 0.5%
  , 50% of the B-sites must be occupied by Al3+, which is much higher than the actual Al3+ occupancy (1%). The possibility of trapping
  is low; therefore the mobility of
  remains high. With increasing BA content, the
  decreases significantly and the difference between
  and the actual
  becomes smaller. The possibility of trapping
  becomes higher with increasing x, and consequently the mobility of
  decreases and there is a significant increase in Ea for the bulk conduction across the solid solution. For x ≤ 0.06,
  (based on
  ),
),  are not fully trapped, therefore there is still a contribution from oxide-ion conduction and the materials remain as mixed conductors. For x = 0.07 and 0.08,
  , all
, all  can be trapped by Al3+. This agrees with the σ–x and tion–x relationships as shown in Fig. 6 and 8 and with the effective concentration of Al traps available
  as a function of x (Table 4). Therefore, trapping of
  is a more important factor for the suppressed oxide-ion conduction in the NBT–BA solid solution. Although recent density-functional-theory (DFT) calculations44 suggest that the association of
  and
and  in Mg-doped NBT is significant only at a low temperature range (i.e., <400 °C), it is possible that
  has a stronger ability to trap
  as the Al–O binding strength (∼502 kJ mol−1
![[thin space (1/6-em)]](https://www.rsc.org/images/entities/char_2009.gif) 45) is significantly higher than that of Mg–O (358 kJ mol−1
45) is significantly higher than that of Mg–O (358 kJ mol−1![[thin space (1/6-em)]](https://www.rsc.org/images/entities/char_2009.gif) 45), and therefore the
45), and therefore the  complex can be stable at higher temperatures.
 (estimated value according to ref. 24),
  in (NBT)1−x(BA)x (0.01 ≤ x ≤ 0.08) solid solutions, and the concentration of
  required to trap all
Pinning of the oxygen vacancies by grain boundaries may be another possibility and/or an additional factor that contributes to the reduced mobility of the oxygen vacancies in the ceramics. Fig. 3b shows the decrease in grain size with increasing x, therefore the number of grain boundary increases with increasing x and consequently a higher chance to pin the oxygen vacancies. Grain boundaries have much more complicated defect chemistry than the bulk and therefore need further investigation.
Na/Bi ratio
Our previous studies22,23 show that the electrical conductivity and bulk conduction mechanisms of NBT are highly sensitive to low levels of the A-site nonstoichiometry. When Na/Bi ≥ 1, i.e., Na-rich or Bi-deficient, NBT is predominantly an oxide-ion conductor with high σb (>1.0 × 10⁻³ S cm−1 at 600 °C); when Na/Bi < 1, i.e., Bi-rich or Na-deficient, NBT exhibits predominantly electronic conduction with very low σb (∼2.0 × 10⁻⁶ S cm−1 at 600 °C). As shown in Fig. 11, a dramatic change in the bulk conductivity of around three orders of magnitude is observed at the vicinity of Na/Bi = 1 at 600 °C due to this switch in the conduction mechanism. The bulk conductivity of the NBT–BA solid solution also shows a dependence on the Na/Bi ratio (Fig. 11). In contrast to the sharp change observed for undoped NBT, a continuous drop of conductivity with decreasing Na/Bi ratio is observed, which is attributed primarily to the change of oxygen vacancy mobility. This result indicates that a Bi-rich, A-site environment is not necessarily good for the oxide-ion conduction even though the polarizability of Bi3+ is high. Trapping of the oxygen vacancies by B-site acceptor-type dopants plays a more important role in the oxide-ion conduction of the NBT-based material, even at high temperatures.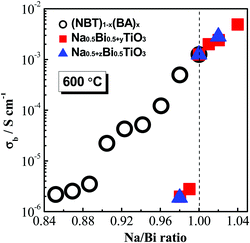 | ||
| Fig. 11 Effect of the A-site Na/Bi ratio on the bulk conductivity of (NBT)1−x(BA)x (0 ≤ x ≤ 0.08) solid solutions (this work), Na0.5+yBi0.5TiO3 (y = −0.01, 0, 0.01)22 and Na0.5Bi0.5+zTiO3 (z = −0.02, −0.01, −0.005, 0, 0.005, 0.01).23 | ||
Conclusions
(NBT)1−x(BA)x (0 ≤ x ≤ 0.08) solid solutions are prepared by a solid-state reaction and their electrical properties studied by ac impedance spectroscopy and electromotive force transport number measurements. Incorporation of BA decreases the electrical conductivity of NBT and changes the conduction mechanism with increasing x from predominantly oxide-ion conduction (type I) to mixed ionic–electronic conduction (type II) and finally to predominantly electronic conduction (type III). The suppression of oxide-ion conductivity significantly reduces the dielectric loss at elevated temperatures and consequently transforms the NBT–BA solid solution higher end members into excellent high-temperature dielectric materials. The suppressed oxide-ion conduction with increasing BA content is attributed mainly to a decrease in oxygen vacancy mobility associated with Al acceptor trapping. Although we cannot rule out the influence of grain boundaries as a source of trapping centres, the close correlation between the expected oxygen vacancy concentration and the level of BA doping (see Table 4 for details) provides compelling evidence for an alternative approach to fine-tune the electrical conductivity and conduction mechanism of NBT, viz. the trapping of oxygen vacancies using B-site acceptor dopants (i.e. Al3+) as opposed to the filling of oxygen vacancies using B-site donor dopants (i.e. Nb5+). This study not only presents an alternative approach to fine-tune the electrical conductivity and conduction mechanism of NBT, but also reveals the importance of local structures, especially defect association, on the oxide-ion conduction mechanisms in NBT-based materials.Acknowledgements
We thank the EPSRC for funding EP/L027348/1.References
- E. Aksel and J. L. Jones, Sensors, 2010, 10, 1935 CrossRef CAS PubMed.
- D. Damjanovic, N. Klein, J. Lin and V. Porokhonskky, Funct. Mater. Lett., 2010, 3, 5 CrossRef CAS.
- K. Reichmann, A. Feteira and M. Li, Materials, 2015, 8, 8467 CrossRef.
- M. Davies, E. Aksel and J. L. Jones, J. Am. Ceram. Soc., 2011, 94, 1314 CrossRef CAS.
- T. Takenaka, K. Maruyama and K. Sakata, Jpn. J. Appl. Phys., 1991, 30, 2236 CrossRef CAS.
- T. Wada, K. Toyoike, Y. Imanaka and Y. Matsuo, Jpn. J. Appl. Phys., 2001, 40, 5703 CrossRef CAS.
- J. R. Gomah-Pettry, S. Said, P. Marchet and J. P. Mercurio, J. Eur. Ceram. Soc., 2004, 24, 1165 CrossRef CAS.
- E. Venkata Ramana, B. V. Bahuguna Saradhi, S. V. Suryanarayana and T. Bhima Sankaram, Ferroelectrics, 2005, 324, 55 CrossRef.
- Y. Hiruma, K. Yoshii, H. Nagata and T. Takenaka, Ferroelectrics, 2007, 346, 114 CrossRef CAS.
- Y. Hiruma, H. Nagata and T. Takenaka, J. Appl. Phys., 2008, 104, 124106 CrossRef.
- R. Selvamani, G. Singh, V. Sathe, V. S. Tiwari and P. K. Gupta, J. Phys.: Condens. Matter, 2001, 23, 055901 CrossRef PubMed.
- H. Yu and Z. Ye, Appl. Phys. Lett., 2008, 93, 112902 CrossRef.
- A. Ullah, C. Ahn, K. Jang, A. Hussain and I. Kim, Ferroelectrics, 2010, 404, 167–172 CrossRef CAS.
- P. Baettig, C. Shelle, R. LeSar, U. Waghmare and N. Spaldin, Chem. Mater., 2005, 17, 1376 CrossRef CAS.
- A. Belik, T. Wuernisha, T. Kamiyama, K. Mori, M. Maie, T. Nagai, Y. Matsui and E. Takayama-Muromachi, Chem. Mater., 2006, 18, 133 CrossRef CAS.
- R. V. K. Mangalam, S. V. Bhat, A. Iyo, Y. Tanaka, A. Sundaresan and C. N. R. Rao, Solid State Commun., 2008, 146, 435 CrossRef CAS.
- H. Yu and Z. Ye, J. Appl. Phys., 2008, 103, 034114 CrossRef.
- Y. Watanabe, Y. Hiruma, H. Nagata and T. Takenaka, Key Eng. Mater., 2009, 388, 229 CrossRef CAS.
- S. Manotham, C. Kruea-In and G. Rujijanagul, Ferroelectrics, 2014, 458, 152 CrossRef CAS.
- W. Peng, C. Mao, Z. Liu, X. Dong, F. Cao and G. Wang, Appl. Phys. Lett., 2005, 106, 092903 CrossRef.
- M. Li, M. J. Pietrowski, R. A. De Souza, H. Zhang, I. M. Reaney, S. N. Cook, J. A. Kilner and D. C. Sinclair, Nat. Mater., 2014, 13, 31 CrossRef CAS PubMed.
- M. Li, H. Zhang, S. N. Cook, L. Li, J. A. Kilner, I. M. Reaney and D. C. Sinclair, Chem. Mater., 2015, 27, 629 CrossRef CAS.
- L. Li, M. Li, H. Zhang, I. M. Reaney and D. C. Sinclair, J. Mater. Chem. C, 2016, 4, 5779 RSC.
- M. Li, L. Li, J. Zang and D. C. Sinclair, Appl. Phys. Lett., 2015, 106, 102904 CrossRef.
- D. Schütz, M. Deluca, W. Krauss, A. Feteira, T. Jackson and K. Reichmann, Adv. Funct. Mater., 2012, 22, 2285 CrossRef.
- M. Bousquet, J.-R. Duclère, E. Orhan, A. Boulle, C. Bachelet and C. Champeaux, J. Appl. Phys., 2010, 107, 104107 CrossRef.
- A. C. Larson and R. B. Von Dreele, General Structure Analysis System (GSAS). Los Alamos National Laboratory Report LAUR 1994, pp. 86–748.
- B. H. Toby, J. Appl. Crystallogr., 2001, 34, 210 CrossRef CAS.
- E. Aksel, J. S. Forrester, B. Kowalski, M. Deluca, D. Damjanovic and J. L. Jones, Phys. Rev. B: Condens. Matter Mater. Phys., 2012, 85, 024121 CrossRef.
- M. K. Niranjan', T. Karthik, S. Asthana', J. Pan and U. V. Waghmare, J. Appl. Phys., 2013, 113, 194106 CrossRef.
- J. Kreisel, A. M. Glazer, G. Jones, P. A. Thomas, L. Abello and G. Lucazeau, J. Phys.: Condens. Matter, 2000, 12, 3267 CrossRef CAS.
- L. Luo, W. Ge, J. Li, D. Viehland, C. Farley, R. Bodnar, Q. Zhang and H. Luo, J. Appl. Phys., 2011, 109, 113507 CrossRef.
- O. Chaix-Pluchery and J. Kreisel, Phase Transitions, 2011, 84, 542 CrossRef CAS.
- V. M. Goldschmidt, T. Barth, G. Lunde and W. Zachariasen, Pt. VII Skrifter Norske Videnskabs-Akademi, Oslo, 1926, p. 117 Search PubMed.
- H. Hayashi, H. Inaba, M. Matsuyama, N. G. Lan, M. Dokiya and H. Tagawa, Solid State Ionics, 1999, 122, 1 CrossRef CAS.
- J. A. Kilner and R. J. Brook, Solid State Ionics, 1982, 6, 237 CrossRef CAS.
- R. L. Cook and A. F. Sammells, Solid State Ionics, 1991, 45, 311 CrossRef CAS.
- J. Ranløv, N. Bonanos, F. W. Poulsen and M. Mogensen, Solid State Phenom., 1994, 39–40, 219 CrossRef.
- L. V. Guivich, I. V. Beyts and C. B. Alcock, Thermodynamic Properties of Individual Substances, CRC Press, Boca Raton, FL, 4th edn, 1994, vol. 3 Search PubMed.
- J. A. Dawson, H. Chen and I. Tanaka, J. Mater. Chem. A, 2015, 3, 16574 CAS.
- X. He and Y. Mo, Phys. Chem. Chem. Phys., 2015, 17, 18035 RSC.
- M. S. Islam, J. Mater. Chem., 2000, 10, 1027 RSC.
- N. M. Grimes and R. W. Grimes, J. Phys.: Condens. Matter, 1998, 10, 3029 CrossRef CAS.
- K. Meyer and K. Albe, J. Mater. Chem. A, 2017, 5, 4368 CAS.
- Y. R. Luo, Comprehensive handbook of chemical bond energies, CRC Press, Boca Raton, FL, 2007 Search PubMed.
| This journal is © The Royal Society of Chemistry 2017 |

