Pee power urinal – microbial fuel cell technology field trials in the context of sanitation†
Ioannis Andrea
Ieropoulos
*ab,
Andrew
Stinchcombe
a,
Iwona
Gajda
a,
Samuel
Forbes
a,
Irene
Merino-Jimenez
a,
Grzegorz
Pasternak
ac,
Daniel
Sanchez-Herranz
a and
John
Greenman
ab
aBristol BioEnergy Centre, BRL, University of the West of England, Frenchay Campus, Bristol, BS16 1QY, UK. E-mail: ioannis.ieropoulos@brl.ac.uk
bBiological, Biomedical and Analytical Sciences, University of the West of England, Frenchay Campus, Bristol, BS16 1QY, UK
cWroclaw University of Technology, Wroclaw, 50-370, Poland
First published on 5th January 2016
Abstract
This paper reports on the pee power urinal field trials, which are using microbial fuel cells for internal lighting. The first trial was conducted on Frenchay Campus (UWE, Bristol) from February–May 2015 and demonstrated the feasibility of modular MFCs for lighting, with University staff and students as the users; the next phase of this trial is ongoing. The second trial was carried out during the Glastonbury Music Festival at Worthy Farm, Pilton in June 2015, and demonstrated the capability of the MFCs to reliably generate power for internal lighting, from a large festival audience (∼1000 users per day). The power output recorded for individual MFCs is 1–2 mW, and the power output of one 36-MFC-module, was commensurate of this level of power. Similarly, the real-time electrical output of both the pee power urinals was proportional to the number of MFCs used, subject to temperature and flow rate: the campus urinal consisted of 288 MFCs, generating 75 mW (mean), 160 mW (max) with 400 mW when the lights were connected directly (no supercapacitors); the Glastonbury urinal consisted of 432 MFCs, generating 300 mW (mean), 400 mW (max) with 800 mW when the lights were connected directly (no supercapacitors). The COD removal was >95% for the campus urinal and on average 30% for the Glastonbury urinal. The variance in both power and urine treatment was due to environmental conditions such as temperature and number of users. This is the first time that urinal field trials have demonstrated the feasibility of MFCs for both electricity generation and direct urine treatment. In the context of sanitation and public health, an independent power source utilising waste is essential in terms of both developing and developed world.
Water impactIn general, 28% of UK clean water consumption is attributed to commercial urinals, with similar consumption rates across the developed world. MFCs host a sustainable microbial community that transforms urine into power, water and minerals. Urine is an abundant resource and a highly effective feedstock for MFCs, deployment of which will reduce dependency on fossil fuels, decarbonisation of water management processes and elemental recycling. |
Introduction
Microbial fuel cells (MFCs) have been receiving increased attention from the scientific community, even though the technology has been viewed with scepticism, at different levels of society. MFCs generate electrical energy directly from the break-down of organic matter via the metabolism of inhabitant microbes, with the rates of reaction being dictated by the microbial metabolic state.1 Electrical output is therefore thermodynamically limited by the carbon-energy metabolism of the constituent cells of the biofilm community (mono- or mixed-culture) colonising the electrode.2–4 Microbial reaction rates are inherently lower than chemical or even purely enzymatic reactions, and therefore the magnitude of the absolute power output at any given time, is typically orders of magnitude lower than those generated from conventional chemical fuel cells.5,6 Be that as it may, electricity generated in a MFC comes directly from waste or wastewater material, which in the break-down/utilisation process is rendered cleaner and potentially suitable for direct discharge to the environment.7–9 This is a competitive advantage that largely compensates for the lower levels of power.Over the years, a wide range of organic substrates has been shown to work as fuels in MFCs. Without being exhaustive, these are: types of food waste such as rotten fruit and prawn shells;10 various types of wastewater from the paper industry, agriculture, dairy farms, municipal treatment plants, oil industry, wine distilleries and breweries, and tanning industry;11 more recently, biodegradable materials12,13 as well as human urine and septic tank content, have also been shown to work very well as fuels for electricity generation.14–17 The application of low cost ceramic membranes allowed to decrease the cost of structural material, which is separating the anode and the cathode, to as low as 4.14 GBP per m2.18 Utilising human waste directly and decreasing the cost of MFCs by the use of ceramic membranes has allowed the technology to be exploited in the context of sanitation, especially in countries of the developing world, which lack the basic infrastructure for clean water and sewerage.19 More than 2.5 billion people lack access to an improved sanitation facility while 1 billion practice open defecation.20 Inadequate drinking water, sanitation and hygiene (WASH) are important risk factors where diarrhoeal disease burden relies on access to water and sanitation facilities rather than water quality. The importance of improving water and sanitation is therefore the key for the prevention of diarrhoeal diseases.21 In addition to the philanthropic dimension that the MFC approach has, sanitation in the developing world offers the grounds for step-wise scale up field trials, to evaluate the technology in the real world environment and thus assess its feasibility.
The efficient utilization of urine through MFCs incorporated in stacks/modules would no longer require conventional energy intensive treatment by the wastewater companies and also result in better balanced fertiliser.14 Efficient energy harvesting electronics for direct MFC usage, is also a major challenge for scale up and implementation.22 So far, there have been a few MFC field trials, like for example: a ceramic cascade temporarily installed in a municipal wastewater treatment plant,35 a multi electrode MFC system for contaminant removal23 as well as for winery wastewater treatment,24 wireless sensors25 and more recently, floating MFCs at the Nosedo, Milan wastewater treatment plant.26
The present study is based on previously reported novel ceramic designs developed as single MFCs, showing high power performance with catholyte production and an ability to operate practical applications, including direct LED lighting27 and recharging a mobile phone via a single MFC unit.28 The design gives the advantage of simplicity and functionality by utilising multiple MFCs submerged in the same feedstock tank. The multiplication of units in parallel would form a module, which could then be connected in series or parallel with other modules, to scale-up into a flexible and robust stack. The study reported herewith, funded by the Bill & Melinda Gates Foundation and Oxfam, had the following aims: (i) evaluate the modular approach of stacking MFCs in a pilot scale trial for energy generation; (ii) integrate the technology with the toilets that Oxfam uses in refugee camps and disaster areas to demonstrate utility in terms of indoor lighting; (iii) scale-up of the urinal, at a systems level, for testing during the Glastonbury Music Festival 2015 and (iv) assess the efficacy of urine treatment.
Methods
MFC construction
MFC units were constructed using closed at one end terracotta caves (Weston Mill Pottery, UK) as previously described.27 The dimensions of the ceramic cylinders used in this work were 150 mm long, 48 mm outside and 42 mm inside diameter. Anode electrodes were made of 30 g m−2 carbon fibre veil (PRF Composites, UK) with dimensions 600 × 260 mm and folded in half along the length. The carbon veil was then wrapped around the ceramic cylinder and tied with a 0.5 mm diameter stainless steel wire to secure the anode in place and to provide a connection to the external circuit. Cathode electrodes were prepared using activated carbon and PTFE mixture as previously described and inserted inside the ceramic cylinder27 as a single sheet of 130 × 140 mm dimensions. Stainless steel crocodile clips were then used to connect the cathode to the electrical circuit.MFC module design & inoculation
Thirty six MFCs were fitted into a plastic container with dimensions 70 (length) × 30 (width) × 16 cm (depth). The anodes and cathodes were connected electrically in parallel using aluminium bus bars and stainless steel wire, nuts and washers. The container was inoculated with a mixture of activated sewage sludge (Cam Valley, Wessex Water Scientific Laboratory, Saltford, UK) and fresh urine and operated in batch mode for the preliminary test. The total liquid capacity was 25 litres. Urine was collected from healthy individuals with no known previous medical conditions, and pooled together before using as a feedstock. The pH was on average 6.4. No pH control was applied to the MFC stacks in both urinals.Pee power Oxfam urinal – UWE campus
Eight modules (288 MFCs in total) as the ones described above were fluidically connected using plastic elbow connectors and pipes to create a series loop and air gaps between the boxes. This was to allow the 8 modules to be connected electrically in series. They were inserted under the men's urinal unit installed at the Frenchay Campus, University of the West of England, as shown in Fig. 1. The structure was built to accommodate two urinal bowls directly feeding the MFC modules fitted underneath the structure. The urinal on the University campus resembles toilets produced by Oxfam and used in refugee camps to make the trial as realistic as possible. Inside the cubicle, LED light modules were fitted to be powered by the MFC stack via a capacitor bank consisting of 4 × 3000 F capacitors in a series-parallel configuration (BCAP3000 p270, Maxwell Technologies). The lighting consisted of 4 × 4.5 W modified LED modules (dial MR16-3H-WH-A1 12 V-50 Hz 530 mA 4.5 W 14 W 20). The purpose of modification was to reduce the LED forward voltage from ∼12 V to ∼3 V and so better suit the requirements of the MFC system. With this modification, the 4 LED modules were consuming approximately 1.2 W. The switching of the LED lights was controlled using a low power passive-infra-red (PIR) sensor and a low power microcontroller (microchip PIC24F16KA102). This also allowed for a 3 V backup power supply in the case of MFC system failure. The holding tank was fitted as the initial (inlet/buffer) tank at the beginning of the stack, providing feedstock for the MFC modules. There was also a collection tank fitted at the outlet of the MFC stack. The operational time was 3 months starting on 05/03/15 and finishing on 31/05/15 and the analytical data presented herein were collected over the period of 5 weeks to assess power production and organic load removal. Urine was donated voluntarily by the campus student and staff population.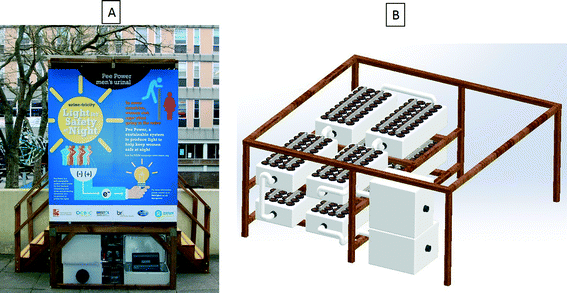 | ||
| Fig. 1 (A) Pee power field trial funded by Oxfam at the UWE campus in February–May 2015; (B) 3D representation of the MFC stack with the inlet and outlet tanks underneath the urinal. | ||
Pee power field trial – Glastonbury
A field trial was performed at the Glastonbury Music Festival, England, between 22/06/15–30/06/15. A specially adapted urinal (Dunster House, UK) was installed in the “Sacred Space” (aka “Stone Circle”) field. The urinal structure was fitted with 3 troughs, which collected the urine from festival-goers and was used to ‘feed’ the MFC modules. Next to the urinal, an educational information point was used to interact with the public explaining the ideas and the technology behind the project. The men's urinal was installed as shown in Fig. 2, where 12 MFC modules (8 from the Oxfam pee power urinal + 4 new ones) were installed giving in total 432 MFCs in the stack and 300 litres of working volume. Similar to the previous trial, supercapacitors (10 × 3000 F in a series parallel configuration giving 7500 F) were used for energy storage. The same LEDs, as the ones used in the Oxfam system, but a higher number (6 in total), were used, due to the larger urinal facility. The total power consumption of the 6 LED modules was 1.8 W. Due to the high number of users (between 825–1000 per day) the estimated flow rate was approximately 330 l per day and the hydraulic retention time was 0.9 days.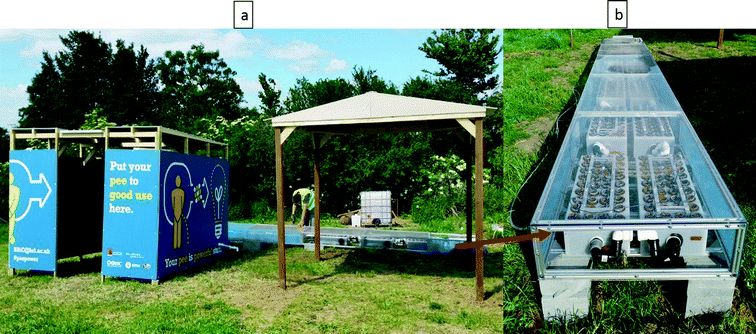 | ||
| Fig. 2 (a) Pee power field trial in Glastonbury Music Festival, June 2015; (b) urinal assembly and MFC stack arranged in 12 modules. | ||
Analysis
Power performance was monitored with a multi-channel Agilent 34972A, LXI Data Acquisition Unit (Farnell, UK) and were then processed using the Microsoft Excel and GraphPad Prism software packages. Parameters such as pH and conductivity were measured with a Hanna 8424 pH meter (Hanna, UK) and 470 Jenway conductivity meter (Camlab, UK) respectively. Dry weight was determined by drying 1 mL of catholyte over 72 h in ambient temperature and weighing the dry mass.Chemical oxygen demand (COD) was analysed using the potassium dichromate oxidation method (COD HR test vials, Camlab, UK) with an MD 200 photometer (Lovibond, UK) where 0.2 mL samples were taken before and during MFC treatment and filter-sterilised prior to analysis. Total nitrogen (TN) was measured using MD 500 colorimeter (Lovibond, UK) and Vario Tube Test (0.5–25 mg L−1) on diluted samples. The concentration of anions in the anolyte (inlet, outlet) and catholyte samples was determined by ion chromatography using a 930 Compact IC Flex (Metrohm, UK). The samples were diluted with ultrapure water before they were collected by the 858 professional sample processor and introduced into the ion chromatograph.
Results and discussion
Initial MFC module testing
A single box assembled with 36 MFCs was initially tested under laboratory conditions. After inoculation the MFC module was connected to a fixed resistor load and it was supplemented with fresh and/or old urine daily. The resistor load was adjusted between 2.3 and 3.3 Ω with stable performance achieved under a 3.3 Ω load. The module reached steady state performance at 40 mW, however, when the resistor was adjusted to 2.3 and with some modification and improvement of the cathode current collector, the peak power reached 62 mW (Fig. 3), which is consistent with the individual ceramic MFC performance of up to 2.58 mW under controlled conditions. Multiple individual MFC units were also previously tested in series and parallel configurations. These preliminary experiments constituted the first tests of multiple MFC units in the same anodic feedstock, which simplified the realisation of an MFC collective.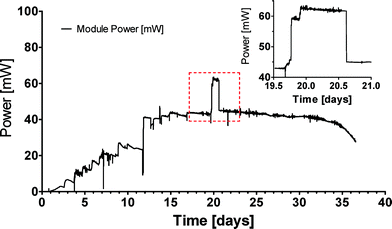 | ||
| Fig. 3 Real time power output from a single module of 36 MFCs connected in parallel. Inset graph is a magnification of the marked area, where the load was changed to 2.3 Ω for approximately 24 hours. | ||
Campus (Oxfam) trial
The pilot field trial ran for a total of three months. After inoculation with 1![[thin space (1/6-em)]](https://www.rsc.org/images/entities/char_2009.gif) :
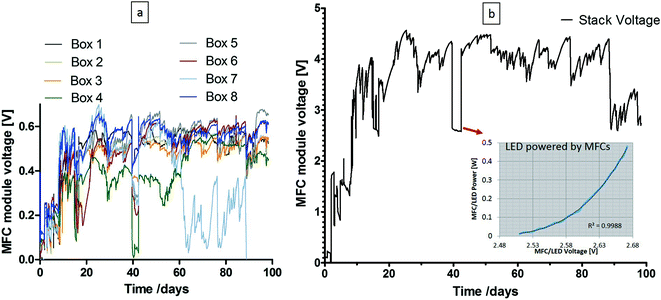
:![[thin space (1/6-em)]](https://www.rsc.org/images/entities/char_2009.gif) 1 activated sludge and urine mix, MFC modules were installed in the urinal and fed with neat fresh urine. The MFC voltage output of all eight modules is shown in Fig. 4(a) and the capacitor voltage in Fig. 4(b), where the inset presents the calibration curve for the LED lights directly connected to the MFC stack (i.e. by-passing the supercapacitors); during this time, the maximum power generated by the MFCs to power the lights was 0.4 W for 75 hours. As can be seen from the graph on the left, 7 of the 8 MFC boxes were more consistent, in terms of performance, for the majority of time (with the exception of when the LEDs were powered directly by the MFCs) and even with 1 of the boxes underperforming, the system was still operational without any polarity reversal; this demonstrated the robustness of the collective MFC modules under adverse conditions. As a joint project with Oxfam, it was hoped that electricity generated by MFCs will provide light for cubicles in refugee camps. The successful trial demonstrated that MFCs have got this capability (the campus pee power urinal has been re-started and it was still running successfully at the point of submitting this paper). Over the three month period, there was an estimated 5–10 users per day, which resulted in the processing of 2.5–5 L of urine daily. The hydraulic retention time for the whole stack was estimated to range between 2–3 weeks. The total catholyte synthesised27 during the 3-month period for the 288 MFCs of 100 mL internal volume was ca. 34 L.
1 activated sludge and urine mix, MFC modules were installed in the urinal and fed with neat fresh urine. The MFC voltage output of all eight modules is shown in Fig. 4(a) and the capacitor voltage in Fig. 4(b), where the inset presents the calibration curve for the LED lights directly connected to the MFC stack (i.e. by-passing the supercapacitors); during this time, the maximum power generated by the MFCs to power the lights was 0.4 W for 75 hours. As can be seen from the graph on the left, 7 of the 8 MFC boxes were more consistent, in terms of performance, for the majority of time (with the exception of when the LEDs were powered directly by the MFCs) and even with 1 of the boxes underperforming, the system was still operational without any polarity reversal; this demonstrated the robustness of the collective MFC modules under adverse conditions. As a joint project with Oxfam, it was hoped that electricity generated by MFCs will provide light for cubicles in refugee camps. The successful trial demonstrated that MFCs have got this capability (the campus pee power urinal has been re-started and it was still running successfully at the point of submitting this paper). Over the three month period, there was an estimated 5–10 users per day, which resulted in the processing of 2.5–5 L of urine daily. The hydraulic retention time for the whole stack was estimated to range between 2–3 weeks. The total catholyte synthesised27 during the 3-month period for the 288 MFCs of 100 mL internal volume was ca. 34 L.
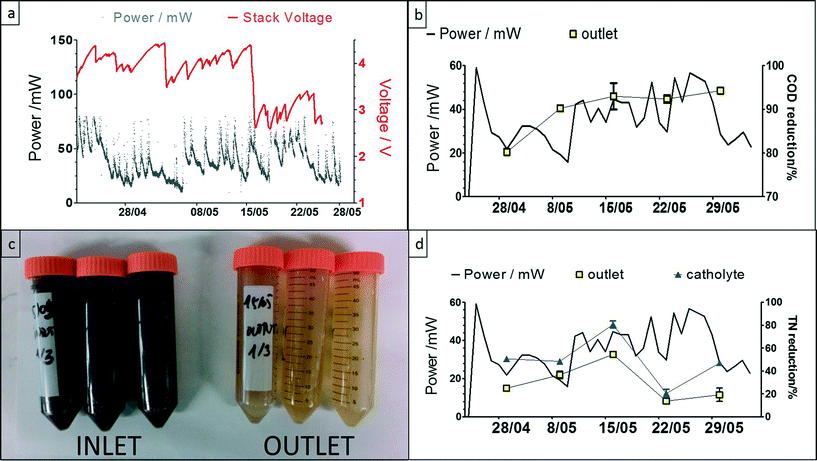
The power behaviour in Fig. 5a demonstrates the dynamic nature of the system, and the response to the lights switching ON when people were entering the urinal, and OFF after a period of 3 minutes (based on a PIR sensor, also powered by the MFC stack). The peak values during this 5 week period were reaching, on average 75 mW, and the highest value recorded was ca. 160 mW; the variation in performance was due to natural temperature conditions as well as frequency of uses. The COD reduction is shown to be >90% reaching a maximum of 98%, which was mainly due to the long HRT, and this high reduction level was maintained throughout the trial. This is also evident from the colour of the inlet and outlet samples collected (Fig. 5c), which clearly showed that the urine was being treated during the process. The highest total nitrogen reduction was >50% for the anolyte and the lowest was <20%, which was the same for the in-situ synthesised catholyte (Fig. 5d). For the catholyte, the maximum total nitrogen reduction was approximately 80%. Increased TN reduction in the catholyte was probably due to the MFC electrochemical operation effecting a pH increase in the cathodic chamber (ESI,† Fig. S1a) that allowed ammonia stripping15 and more efficient nitrogen removal.
Glastonbury trial
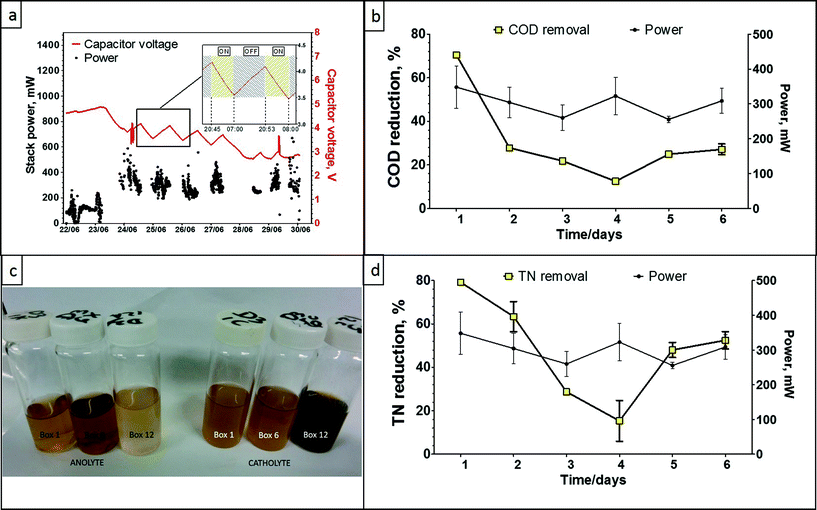
The data presented in Fig. 6a shows the stack power performance over the period of 8 days. The first two days of data show the system in charging mode only, in preparation for the festival. On the 23rd of June the light module in the cubicle was switched on (also controlled by a PIR sensor) and it is represented by the supercapacitor voltage drop. From this point onwards, the lighting system was disabled during daytime (Fig. 6a, inset) to allow the system to recharge and then reinstated during nighttime. Stack power had increased from the system start date until the 24th of June (first day of the festival) reaching up to 400 mW total power output and showed good and stable power performance through the time of the festival due to high usage and constant fast flow of fresh feedstock. The long decrease in capacitor voltage between the 27th–28th June is when the lights were intentionally left ON for 24 hours. As can be seen, at the end of this 24 h period, the system had almost reached equilibrium (MFC power-in = LED power-out). The spike between the 29th–30th June is when the supercapacitors were disconnected and the data following this (going into the 30th June) are from when the MFCs were directly powering the lights. The peak power output was up to 800 mW, which is equivalent to 19.2 W h over 24 h, and showed a mean output of 1.85 mW per MFC, which is consistent with the laboratory data. Power output is significantly higher than the power levels recorded for the campus pee power Oxfam trial, which might be due to the increased number of modules (from 8 to 12), very high flow rate at the festival and elevated temperature due to the direct sunlight exposure. The catholyte generated during this trial was approximately 43 litres as each of the MFC units produced 0.1 L of catholyte. The very high flow rate and reduced HRT, did however affect the COD reduction capability of the system as a whole, recording a maximum of ca. 70%, a minimum of 15% and a mean of 25%. The same effect was observed for the total nitrogen reduction of the system, where the maximum recorded was 79% and the minimum was 6%. The high usage did however result in struvite accumulation inside the connecting pipes, as a result of the inlet tank not holding urine for the required amount of time. The colour of the collected (anolyte) inlet and outlet samples, also confirmed the reduced treatment performance.MFC electrochemical treatment is actively changing the chemistry of the treated substrate favouring pH and ion separation (see ESI†), which leads to the recovery of slow-release fertiliser and electricity from urine (Zang et al., 2012). Porous terracotta has been reported to allow ionic movement from the anodic chamber to the cathode surface,29 however when the cathode is exposed as part of an outside surface (as opposed to a secluded inner surface used in the pee power examples), this might also lead to chemical scaling (salt deposition) and consequently biofouling30 of the outer cathode.
Ceramic is a cost effective replacement for the cation exchange membrane18,31,32 and it proved once again to be a valid building block for MFCs. Moreover, it is a functional medium for the electroosmotic flow of ions induced by the MFC electric field.27 It promotes extraction and ion separation, which are both essential for elemental recovery and recycling. This electro-kinetic function of MFCs depends on power performance,33 which implies that the more efficiently the systems perform, the more improved the elemental extraction with the added advantage of direct monitoring of effluent quality.34 Environmental sustainability is an integral part of the design, maintenance and operation of a urinal facility, promoting the awareness of environmental issues, whilst providing the tools and incentives to address them. Such field trials are essential so that the technology can be further advanced and applied at larger scale.
The decreased treatment performance of the Glastonbury pee power urinal can easily be rectified with the appropriate fluidic arrangements, to allow the same number of users, but elongate the hydraulic retention time of the collective MFCs, so that higher COD and TN reduction efficiencies can be achieved. This was not done in this case, due to the timing and location constraints of the MFC stack, which was mainly for demonstration purposes. The high number of users, resulting in a high throughput, implies that a further scaled-up pee power urinal will be more efficient in treating higher urine volumes and at the same time maintain a high level of power performance.
Conclusions
The provision of safe water, adequate sanitation and hygiene, is critically important for promoting individual and community-level health in the developing world. MFC based technologies prove to be a sustainable solution even in remote locations, improving sanitation and hygiene, and opening the way to elemental recycling. The pee power urinals are perhaps one example of how these can be achieved.Acknowledgements
This work was funded by Oxfam UK and the Bill & Melinda Gates Foundation, grant number OPP1094890. The Authors would like to thank Dr. Andy Bastable from Oxfam for the useful discussions and financial support, as well as Dunster House Ltd. for donating both the urinal structures and further supporting the trials – in particular Mr. Carl Dolby. The Authors would like to thank Mrs. Clare Backman for organising the field trials and Dr. Benjamin Taylor for assisting in the Glastonbury trial. Sincere thanks also go to Jane Healy (Glastonbury Sanitation Manager) and the Glastonbury Organisers, for hosting and supporting the field trial during the Glastonbury Festival, 2015. The artwork for the urinals, part of which is included in the graphical abstract, was created by Enna Guggi and the UWE Marketing Department, for which the authors are grateful.References
- P. Ledezma, J. Greenman and I. Ieropoulos, Maximising electricity production by controlling the biofilm specific growth rate in microbial fuel cells, Bioresour. Technol., 2012, 118, 615–618 CrossRef CAS PubMed.
- N. Kim, Y. Choi, S. Jung and S. Kim, Effect of initial carbon sources on the performance of microbial fuel cells containing Proteus vulgaris, Biotechnol. Bioeng., 2000, 70(1), 109–114 CrossRef CAS PubMed.
- B. C. Jong, B. H. Kim, I. S. Chang, P. W. Y. Liew, Y. F. Choo and G. S. Kang, Enrichment, Performance, and Microbial Diversity of a Thermophilic Mediatorless Microbial Fuel Cell, Environ. Sci. Technol., 2006, 40(20), 6449–6454 CrossRef CAS PubMed.
- I. Ieropoulos, C. Melhuish and J. Greenman, Artificial gills for robots: MFC behaviour in water, Bioinspiration Biomimetics, 2007, 2(3), S83–S93 CrossRef CAS PubMed.
- A. Kirubakaran, S. Jain and R. K. Nema, A review on fuel cell technologies and power electronic interface, Renewable Sustainable Energy Rev., 2009, 13(9), 2430–2440 CrossRef CAS.
- S. Mekhilef, R. Saidur and A. Safari, Comparative study of different fuel cell technologies, Renewable Sustainable Energy Rev., 2012, 16(1), 981–989 CrossRef CAS.
- J. Winfield, I. Ieropoulos and J. Greenman, Investigating a cascade of seven hydraulically connected microbial fuel cells, Bioresour. Technol., 2012, 110, 245–250 CrossRef CAS PubMed.
- P. Ledezma, J. Greenman and I. Ieropoulos, MFC-cascade stacks maximise COD reduction and avoid voltage reversal under adverse conditions, Bioresour. Technol., 2013, 134, 158–165 CrossRef CAS PubMed.
- W. Habermann and E. Pommer, Biological fuel cells with sulphide storage capacity, Appl. Microbiol. Biotechnol., 1991, 35(1), 128–133 CrossRef CAS.
- I. Ieropoulos and C. Melhuish, EcoBot-II: An artificial agent with a natural metabolism, J. Adv. Robot. Syst., 2005, 2(4), 295–300 Search PubMed.
- D. Pant, G. van Bogaert, L. Diels and K. Vanbroekhoven, A review of the substrates used in microbial fuel cells (MFCs) for sustainable energy production, Bioresour. Technol., 2010, 101(6), 1533–1543 CrossRef CAS PubMed.
- J. Winfield, I. Ieropoulos, J. Rossiter, J. Greenman and D. Patton, Biodegradation and proton exchange using natural rubber in microbial fuel cells, Biodegradation, 2013, 24(6), 733–739 CrossRef CAS PubMed.
- J. Winfield, L. D. Chambers, J. Rossiter, J. Greenman and I. Ieropoulos, Urine-activated origami microbial fuel cells to signal proof of life, J. Mater. Chem. A, 2015, 3(13), 7058–7065 CAS.
- I. Ieropoulos, I. Gajda, J. You and J. Greenman, Urine—Waste or Resource? The Economic and Social Aspects, Rev. Adv. Sci. Eng., 2013, 2(3), 192–199 CrossRef.
- P. Kuntke, K. M. Smiech, H. Bruning, G. Zeeman, M. Saakes, T. H. J. Sleutels, H. V. M. Hamelers and C. J. N. Buisman, Ammonium recovery and energy production from urine by a microbial fuel cell, Water Res., 2012, 46(8), 2627–2636 CrossRef CAS PubMed.
- I. Ieropoulos, J. Greenman and C. Melhuish, Urine utilisation by microbial fuel cells; energy fuel for the future, Phys. Chem. Chem. Phys., 2012, 14(1), 94–98 RSC.
- H. Yazdi, L. Alzate-Gaviria and Z. J. Ren, Pluggable microbial fuel cell stacks for septic wastewater treatment and electricity production, Bioresour. Technol., 2015, 180, 258–263 CrossRef CAS PubMed.
- G. Pasternak, J. Greenman and I. Ieropoulos, Comprehensive study on ceramic membranes for low cost microbial fuel cells, ChemSusChem, 2016, 9(1), 88–96 CrossRef CAS PubMed.
- UNESCO, “Water in a Changing World” The Third edition of the United Nations World Water Development Report (WWDR3), 2009 Search PubMed.
- World Health Organisation, WHO | UN-water global analysis and assessment of sanitation and drinking-water (GLAAS) 2014 - report; World Health Organization, 2014 Search PubMed.
- A. Prüss-Ustün, J. Bartram, T. Clasen, J. M. Colford, O. Cumming, V. Curtis, S. Bonjour, A. D. Dangour, J. De France and L. Fewtrell, et al. Burden of disease from inadequate water, sanitation and hygiene in low- and middle-income settings: a retrospective analysis of data from 145 countries, Trop. Med. Int. Health, 2014, 19(8), 894–905 CrossRef PubMed.
- H. Wang, J. Park and Z. J. Ren, Practical Energy Harvesting for Microbial Fuel Cells: A Review, Environ. Sci. Technol., 2015, 49(6), 3267–3277 CrossRef CAS PubMed.
- E. S. Heidrich, S. R. Edwards, J. Dolfing, S. E. Cotterill and T. P. Curtis, Performance of a pilot scale microbial electrolysis cell fed on domestic wastewater at ambient temperatures for a 12 month period, Bioresour. Technol., 2014, 173, 87–95 CrossRef CAS PubMed.
- R. D. Cusick, B. Bryan, D. S. Parker, M. D. Merrill, M. Mehanna, P. D. Kiely, G. Liu and B. E. Logan, Performance of a pilot-scale continuous flow microbial electrolysis cell fed winery wastewater, Appl. Microbiol. Biotechnol., 2011, 89(6), 2053–2063 CrossRef CAS PubMed.
- C. Donovan, A. Dewan, D. Heo and H. Beyenal, Batteryless, wireless sensor powered by a sediment microbial fuel cell, Environ. Sci. Technol., 2008, 42(22), 8591–8596 CrossRef CAS PubMed.
- E. Martinucci, F. Pizza, D. Perrino, A. Colombo, S. P. M. Trasatti, A. Lazzarini Barnabei, A. Liberale and P. Cristiani, Energy balance and microbial fuel cells experimentation at wastewater treatment plant Milano-Nosedo, Int. J. Hydrogen Energy, 2015, 40(42), 14683–14689 CrossRef CAS.
- I. Gajda, J. Greenman, C. Melhuish and I. Ieropoulos, Simultaneous electricity generation and microbially-assisted electrosynthesis in ceramic MFCs, Bioelectrochemistry, 2015, 104, 58–64 CrossRef CAS PubMed.
- I. Gajda, A. Stinchcombe, J. Greenman, C. Melhuish and I. Ieropoulos, Ceramic MFCs with internal cathode producing sufficient power for practical applications, Int. J. Hydrogen Energy, 2015, 40(42), 14627–14631 CrossRef.
- A. N. Ghadge and M. M. Ghangrekar, Development of low cost ceramic separator using mineral cation exchanger to enhance performance of microbial fuel cells, Electrochim. Acta, 2015, 166, 320–328 CrossRef CAS.
- A. N. Ghadge and M. M. Ghangrekar, Performance of low cost scalable air-cathode microbial fuel cell made from clayware separator using multiple electrodes, Bioresour. Technol., 2015, 182, 373–377 CrossRef CAS PubMed.
- J. Winfield, J. Greenman, D. Huson and I. Ieropoulos, Comparing terracotta and earthenware for multiple functionalities in microbial fuel cells, Bioprocess Biosyst. Eng., 2013, 36(12), 1913–1921 CrossRef CAS PubMed.
- M. Behera, P. S. Jana and M. M. Ghangrekar, Performance evaluation of low cost microbial fuel cell fabricated using earthen pot with biotic and abiotic cathode, Bioresour. Technol., 2010, 101(4), 1183–1189 CrossRef CAS PubMed.
- I. Gajda, J. Greenman, C. Melhuish, C. Santoro, B. Li, P. Cristiani and I. Ieropoulos, Electro-osmotic-based catholyte production by Microbial Fuel Cells for carbon capture, Water Res., 2015, 86, 108–115 CrossRef CAS PubMed.
- J. Chouler and M. di Lorenzo, Water Quality Monitoring in Developing Countries; Can Microbial Fuel Cells be the Answer?, Biosensors, 2015, 5(3), 450–470 CrossRef PubMed.
- I. Ieropoulos, J. Winfield, I. Gajda, A. Walter, G. Papaharalabos, I. Merino-Jimenez, G. Pasternak, J. You, A. Tremouli, A. Stinchcombe, S. Forbes and J. Greenman, The Practical Implementation of Microbial Fuel Cell Technology, in Microbial Electrochemical and Fuel Cells: Fundamentals and Applications, ed. K. Scott and E. H. You, 2015, ch. 12, pp. 357–380 Search PubMed.
Footnote |
| † Electronic supplementary information (ESI) available. See DOI: 10.1039/c5ew00270b |
| This journal is © The Royal Society of Chemistry 2016 |

