Three-dimensional ultrathin In2O3 nanosheets with morphology-enhanced activity for amine sensing

Yang Cao a, Xiaoxi Huangb, Yuanyuan Wua, Yong-Cun Zoua, Jun Zhaoc, Guo-Dong Li*a and Xiaoxin Zou*a
aState Key Laboratory of Inorganic Synthesis and Preparative Chemistry, International Joint Research Laboratory of Nano-Micro Architecture Chemistry, College of Chemistry, Jilin University, 2699 Qianjin Street, Changchun 130012, China. E-mail: xxzou@jlu.edu.cn; chemistryzouxx@gmail.com; lgd@jlu.edu.cn
bDepartment of Chemistry and Chemical Biology, Rutgers, The State University of New Jersey, Piscataway, New Jersey 08854, USA
cCollege of Science, Hebei University of Science and Technology, Shijiazhuang 050018, China

Received 15th May 2015 , Accepted 6th July 2015

First published on 7th July 2015


Abstract

Ultrathin materials have a wide range of applications in catalysis and sensing owing to their very large surface to volume ratio and great amount of exposed active sites. Herein, we report the synthesis of three dimensional (3D) In2O3 materials with a high surface area composed of ultrathin nanosheets, ca. 2 nm, using indium glycerolate as the precursor. The structural evolution process of the indium glycerolate precursor was monitored by thermogravimetric analysis, infrared spectroscopy and transmission electron microscopy. The resulting In2O3 nanosheets show excellent amine sensing performance at room temperature because ultrathin nanosheets offer a large amount of active sites on the surface and the 3D structure adds an additional advantage of avoiding aggregation and facilitating the diffusion of the target gas. In addition, the gas sensing mechanism is also proposed in this study.

1. Introduction

Of all the recent research in materials science, the exploration of two-dimensional (2D) materials, such as graphene, molybdenum sulfide, boron nitride, has already drawn extensive attention thanks to their unique and interesting properties.1,2 This family of materials can be easily transformed into ultrathin structures with single atomic or few atoms' thickness, which could offer distinct characteristics compared with their bulk counterparts. For example, they possess a very high percentage of surface atoms, resulting in a large amount of exposed active sites as well as some particular facet planes.2,3 Layered compounds could be made into ultrathin 2D materials mainly thanks to the intrinsic driving force for 2D anisotropic growth. On the contrary, non-layered compounds are very challenging to make into ultrathin nanosheets because the difficulty in destructing their strong in-plane connections and the absence of spontaneous ability for 2D anisotropic growth, just as the cubic Co3O4, CeO2, or zinc-blende ZnSe.4–6 Despite the merits the 2D materials have, they prefer to stack with each other to reduce the overall surface energy. This would be undesirable for their application since the advantages of ultrathin structure would be weakened to some extent.7–10 One way to overcome this problem is to develop new synthetic approach to allow the assembling of ultrathin nanosheets into a three dimensional (3D) structure, which can not only retain the ultrathin morphology but also avoid aggregation between the nanosheets.

On the basis of the aforementioned interesting and important properties the nanosheet assembled hierarchical materials have, significant endeavours have been made to explore novel and facile synthetic approaches to obtain such nanosheets' materials with single atomic or a few atomic layers. For the synthesis of nanosheets-based In2O3, a very useful materials widely employed in the sensing of NO2,11–13 CO,14 H2S,15,16 volatile organic compounds,17–20 the precursor-mediated method has been proven to be very effective. Generally, an indium precursor with nanosheet morphology, such as InOOH,21–24 In(OH)3(ethylenediamine)2,25 or indium–glycerol complex,26 was first prepared, and then the resulting indium-containing precursor was treated in air to form the In2O3 material with the sheet-like morphological preservation. Another way to make In2O3 nanosheets was thermal oxidation of indium metal in tube furnace.27 However, the In2O3 nanosheets obtained by these methods are usually too thick, at least more than 5 nm. On the other hand, 0.9 nm In2O3 nanosheets have been successfully synthesized recently from ultrathin In(OH)3 nanosheets,28 but the resulting material doesn't assemble into a 3D structure.

In this report, we present a facile route to obtain 3D In2O3 nanomaterial built by ultrathin nanosheets using indium glycerolate as the precursor (Scheme 1), without employing additional expensive additives or templates. Of note, most of the above mentioned methods for the synthesis of In2O3 nanosheets require adding compounds like D-fructose, urea, ethylenediamine, NaOH, or sodium oleate et al.21–28 While in our case, only indium source, glycerol and solvent are needed for the synthesis. The formation mechanism of the resulting 3D ultrathin nanosheets material is investigated in detail. Although the indium glycerolate has been employed as the precursor to make In2O3, the resulting nanosheets have a thickness of 10.5 to 15.5 nm,26 which is much thicker than the one (ca. 2 nm) we prepared here. Furthermore, the gas sensing properties toward flammable and toxic organic amines were evaluated to study the relevance between morphology and sensing performance. Compared with the In2O3 nanoparticles, the 3D In2O3 nanosheets exhibit much better performance toward amine sensing, by providing abundant active sites along with the enhanced gas diffusion. The significantly increased sensing response is comprehensively discussed by the adsorption mechanism with the target gas and improved utilization of surface atoms.


image file: c5ra09063f-s1.tif
Scheme 1 Schematic representation of the synthesis procedure for In-glycerol nanosheets, and the generation of In2O3 nanosheets through calcination.

2. Experimental

2.1 Chemicals and reagents

Indium(III) nitrate hydrate was purchased from the Aladding Industrial Corporation. Glycerol was purchased from Sinopharm Chemical Reagent Co. Ltd. Isopropanol and ethanol were purchased from Beijing Chemical Works. All the above chemicals were used without further purification and deionized water was used in all experiments.

2.2 Synthesis of indium glycerolate (In-gly) nanosheets

The synthesis route of In-gly nanosheets was followed by previous reports for the synthesis of metal alkoxide with minor modifications.20,29–31 Generally, 0.3 g (0.785 mmol) In(NO3)3·4.5H2O and 10 g (109 mmol) glycerol were dissolved in 30 ml isopropanol, followed by vigorously stirring for at least 3 h until a transparent solution was obtained. The solution was then transferred into a 60 ml Teflon-lined autoclave and treated at 180 °C for 6 h. For comparative purpose, the solvothermal reactions were also conducted for 1 h and 2 h and the resultant sample (1 h) was denoted as In-gly microspheres. After cooling to room temperature naturally, the white solid was collected by centrifugation, washed by ethanol for several times and then dried in an oven overnight at 60 °C in air.

2.3 Synthesis of In2O3 nanosheets from indium glycerolate

The In2O3 nanosheets were prepared by calcination of the In-gly nanosheets precursor in air for 3 h at 350 °C with a heating rate of 2 °C min. For comparison, the porous In2O3 microspheres were obtained after the same thermal treatment of the In-gly microspheres.

2.4 Material characterizations

The powder X-ray diffraction (XRD) patterns were conducted on a Rigaku D/Max 2550 X-ray diffractometer using CuKα radiation (λ = 1.5418 Å) operated at 200 mA and 50 kV. The scanning electron microscopic (SEM) images were acquired on a JEOL JSM 6700F electron microscope. The transmission electron microscopy (TEM) and high-resolution TEM (HRTEM) images were taken on a Philips-FEI Tecnai G2S-Twin. The infrared (IR) spectra were measured on a Bruker IFS 66V/S FTIR spectrometer using KBr pellets. The thermal gravimetric analysis curve was recorded on a NETZSCH STA 449C TG thermal analyzer from 25 to 800 °C at a heating rate of 10 °C min−1 using air as the flow gas. BET surface area and BJH pore diameter were determined by a Micromeritics ASAP 2020M system.

2.5 Sensor fabrication and measurement

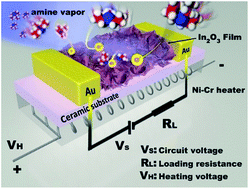
The gas sensor device was fabricated according to our previous reports.20,30 The sensor device is composed of a ceramic tube with two gold electrodes and four platinum wires on both sides, in which a nickel–chromium heating wire is located to control the operation temperature (Scheme 2). A commercial CGS-8 Gas Sensing Measurement System obtained from Beijing Elite Tech Company Limited was employed to perform all the gas sensing measurement.
image file: c5ra09063f-s2.tif
Scheme 2 Schematic illustration of the structure of the sensor device for the detection of amine.

Gas sensing properties were evaluated using a static test system which included a one liter test chamber. For the measurement, first the target gas was put into the test chamber using a microsyringe and wait for about 10 min to achieve a homogenous atmosphere with a relative humidity of ca. 25%, then the sensor was placed inside the chamber to get a stable reading of resistance Rg. To recover the sensor after the desired Rg was obtained, the sensor was incubated with fresh air. The resistance of sensor was measured in an environmental air with a relative humidity similar to test chamber, denoted as Ra. Finally, the response of the sensors was represented as Ra/Rg.

3. Results and discussion

Fig. 1A and B shows the representative SEM images of this In-gly precursor, which is composed of numerous 3D nanostructure assembled by a lot of nanosheets. To further examine the thickness of In-gly nanosheets, TEM images of In-gly were recorded (Fig. 1C and D). It is clearly shown in Fig. 1C and D that these nanosheets are very thin, with a typical thickness ranging from 1.8 to 2.4 nm. In order to understand the formation of such a structure composed of ultrathin nanosheets during the solvothermal process, the reaction was conducted for different times, namely, 1 h, 2 h, 3 h, 3.5 h and 4 h. As shown in the TEM images (Fig. 2), the resulting material was spherical in shape, nonporous particle with a diameter of approximate 380 nm at the early stage (1 h). When the reaction time was prolonged to 2 h, some very thin nanosheets were grown from the surface of spherical particle to the outside, and the contrast of the particles' inner part seemed less dense compared with the one obtained for 1 h. Prolonging the reaction time to 3 h, until 4 h, it's seen that the void inner space became more and more obvious. By increasing the reaction time to 6 h, the product composed of ultrathin nanosheets formed. The overall diameter of this 3D nanosheet sample was around 880 nm, which is much larger than the size of the spheres formed in shorter time. This process could be classified as a “self-template” as reported previously,32 during which the In-gly microspheres serve as both a template and the precursor for the generation of final 3D nanosheets materials. In addition to the TEM observation, XRD, FTIR and TGA were employed to explore the structure and composition of In-gly microspheres and nanosheets. Based on the XRD result (Fig. S1), In-gly microspheres are an amorphous structure as we previously reported.20 In contrast, In-gly nanosheets give a typical XRD pattern similar to the indium–glycerolate complex reported before.26 The FTIR spectra (Fig. S2) of the In-gly microspheres and nanosheets are similar. Both of them show very sharp absorption peak at ca. 2867 cm−1 due to the C–H stretching mode, indicating the presence of glycerol or other organic compounds in the composites. The broad signal centered at 3386 and 1593 cm−1 are attributed to the hydroxyl groups and adsorbed water molecules. The formation of In-gly is further confirmed by the C–O stretching vibration located at 1057 cm−1, which moved to higher wavenumbers, implying the coordination of C–O to metal cations.26 The TGA results for In-gly microspheres and nanosheets are shown in Fig. S3. At the lower temperature range, from 30 °C to 100 °C, In-gly microspheres display 3.86% weight loss ascribed to the adsorbed or entrapped organic solvent and water. However, the In-gly nanosheets do not show obvious weight loss in this temperature range. This result indicates that there should be some organic species that are not coordinated with indium ions in In-gly microspheres.
image file: c5ra09063f-f1.tif
Fig. 1 SEM (A and B), and TEM (C and D) images of the In-glycerol nanosheets.

image file: c5ra09063f-f2.tif
Fig. 2 TEM images of the In-glycerol materials for different reaction times. The scale bar is 100 nm in all the images.

Regarding to the conversion of nanomaterials into complex structures, some mechanisms, such as Kirkendall diffusion and Ostwald ripening,33,34 are usually applied to explain the possible reasons. Based on the results we discussed above, a possible growth mechanism could be proposed here: at the early stage, the glycerol and In3+ cation along with the counter anion could construct an interconnected network with some free organic molecules entrapped inside the particles. When the reaction time is prolonged to 6 h, the In3+ tends to form metal alkoxide, where the hydrogen atoms on hydroxyl groups are directly replaced by the In3+. It has been reported that Co and Mn could form plate-like materials with glycerol,35 and the indium hydroxide nanoparticles can also react with glycerol to form nanoplate.26 The formation of nanosheet starts from the surface of spherical particles since the inter space is very restricted for the nanosheet growth, and the interior In3+ can gradually diffuse to the outside area, as explained by the Kirkendall effect.32,34 After the complete growth of nanosheet structure, the center cavity become empty and the overall particle size increase significantly.

Fig. 3 shows the XRD patterns of the material after annealing in air at 350 °C, all the diffraction peaks can be assigned to cubic In2O3 (PDF#65-3170), demonstrating the complete transformation of In-gly to In2O3. The structure and morphology of the as-obtained In2O3 was investigated by SEM and HRTEM. As shown in Fig. 4, the obtained materials inherited the original shape of In-gly nanosheets, exhibiting 3D structure composed of nanosheets. The thickness for In2O3 nanosheets are all less than 2 nm, even smaller than the precursor In-gly nanosheets. In addition, the two sets of lattice fringes in the HRTEM image (Fig. 4D) give two interplanar distances of 0.255 and 0.289 nm, corresponding to those of (400) and (222) planes for cubic In2O3, respectively. The angle of 54.8° is also close to the theoretical value (54.7°) for the angle between the (400) and (222) planes. These results indicate that the orientation of this nanosheet is along the (011) direction, similar with previous report for cubic In2O3 nanosheets.28 The strategy we employed here to make cubic compounds into an ultrathin nanosheet based material includes two steps: (1) preparation of an In-gly precursor with ultrathin nanosheets; (2) transformation of this precursor into final materials (In2O3) which can inherit the original morphology. The above results demonstrate the importance of In-gly precursor for the synthesis of ultrathin cubic In2O3 nanosheets. Although the indium glycerolate has been used as the precursor to make In2O3, such thin nanosheets are not obtained in previous reports.26 It may be related with the extra base decomposed from formamide in their reaction system,26 leading to the formation of non-layered In(OH)3 at the very beginning. On the contrary, the generation of In(OH)3 is very limited in our preparation process since there are no sufficient amount of base (like urea or formamide) and also very small amount of water. Therefore, the use of glycerol and isopropanol as solvent system is one of the crucial factors for the formation of such 3D In2O3 materials.


image file: c5ra09063f-f3.tif
Fig. 3 XRD patterns of the In2O3 nanosheets.

image file: c5ra09063f-f4.tif
Fig. 4 SEM (A and B), TEM (inset of 4A) and HRTEM (C and D) images of the In2O3 nanosheets.

Fig. 5 demonstrates the nitrogen gas adsorption/desorption isotherms and BJH pore size distribution curves. As shown in Fig. 5A, the N2 adsorption/desorption isotherms of the In2O3 nanosheets are of typical type-IV with an H1-type hysteresis loop, indicating the presence of a mesoporous/macroporous structure. The corresponding BJH pore-size distribution (Fig. 5B) shows a wide pore-size distribution ranging from 2 to 100 nm. The broad pore-size distribution should be associated with the interspaces formed by the adjacent ultrathin nanosheets. This material has a BET surface area of 107 m2 g−1, which is much higher than other reports for In2O3 (normally between 25 to 40 m2 g−1),21,24,25 also higher than our previous report about In2O3 microspheres (57 m2 g−1).20


image file: c5ra09063f-f5.tif
Fig. 5 Nitrogen gas adsorption/desorption isotherms (A) and pore size distribution (B) of the In2O3 nanosheets.

In order to evaluate the gas sensing performance, the sensor device was fabricated as shown in Scheme 2 by using the In2O3 nanosheets as sensing materials, and tri-n-propylamine (denoted as TPA) was selected as the probe molecule. Upon exposing in 100 ppm TPA gas at room temperature (RT), the resistance dropped very quickly at the beginning and then decreased gradually from ca. 500 to 1500 s, finally the signal became stable after 1500 s (Fig. 6A). The change of the resistance originates from the interaction of organic amine with this kind of n-type semiconductor. Metal oxide surface could have some unsaturated metal cations to serve as Lewis site to coordinate with the amine groups,36,37 as shown in the inset of Fig. 6A. At the same time, the reducing gas organic amine offer the electrons to decrease the depletion layer thickness on the surface of metal oxide and result in the decrease of resistance. The sensing property toward TPA is further confirmed after interacting with different concentrations of TPA from 0.1 to 100 ppm. The results depict that the sensing response (Ra/Rg) increase with the increase of gas concentrations (Fig. 6B). Moreover, best sensing response was recorded towards TPA compared with n-propylamine (PA) and di-n-propylamine (DPA) after 500 s interaction (Fig. 6C). This is associated with the electron donating effect of alkyl groups connected with nitrogen, the more alkyl groups, the stronger it can offer electrons to decrease the electron depletion layer. Additional experiment on the selectivity of In2O3 nanosheets was performed in the presence of 100 ppm different gases (ethanol, methane, formaldehyde, hydrogen, carbon monoxide, N,N-dimethylformamide, TPA, acetone, ethylether, and ethyl acetate). It's appealing that none of the other gases reveal noticeable response, while 100 ppm TPA could give a response as high as 630. Aside from the aforementioned properties, we notice that the response time for In2O3 nanosheets towards 100 ppm TPA at room temperature is as long as 55 s and difficult to recover. In order to solve this problem, a higher operation temperature (230 °C) was selected to conduct the on and off repeatability measurements for detecting 5 ppm TPA (Fig. S5). It obvious that In2O3 nanosheets are durable as sensing materials and the response time is between 1 and 5 s, the recovery time is ca. 15 s in 20 cycles' measurements.


image file: c5ra09063f-f6.tif
Fig. 6 The sensing performance of the In2O3 nanosheets interacted with TPA at room temperature. (A) The change of resistance for In2O3 fabricated sensor upon interacting with 100 ppm of TPA, the inset shows the resistance from 500 to 2000 s and the schematic interaction of TPA with In2O3. (B) The responses for 0.1 ppm, 1 ppm, 10 ppm, 100 ppm TPA. The inset shows the response for 0.1 ppm to 10 ppm TPA. (C) The response for 100 ppm PA, DPA and TPA. (D) Comparison of the responses of the In2O3 nanosheets sensor towards several 100 ppm gases.

Furthermore, we compared the sensing performance of the In2O3 nanosheets with that of porous In2O3 microsphere (Fig. 7), which is prepared by thermal treatment of the spherical In-gly precursor at 350 °C (the precursor obtained after 1 h solvothermal reaction, see Experimental Section).20 Obviously, the In2O3 nanosheets exhibit much higher response toward TPA than the In2O3 microsphere. For example, the In2O3 nanosheets give response values of 20 and 630 respectively in the presence of 10 ppm and 100 ppm TPA, whereas porous In2O3 microsphere presents response values of 4.3 and 120 in the same conditions. The enhanced activity towards gas sensing by the In2O3 nanosheets might be mainly due to its larger surface area (107 m2 g−1 for the In2O3 nanosheets; 57 m2 g−1 for the porous In2O3 microsphere), the easy accessibility to inter-nanosheet space, and a large amount of exposed surface atoms originated from the ultrathin nanosheet structure.


image file: c5ra09063f-f7.tif
Fig. 7 Comparison of the sensing response to 10 ppm and 100 ppm TPA for the sensors fabricated by In2O3 microspheres and In2O3 nanosheets.

In order to investigate the sensing mechanism, the In2O3 nanosheets after adsorption with TPA were characterized with FTIR and TGA, the results are also compared with pure In2O3 nanosheets themself. FTIR is a powerful tool to measure the conduction band electrons in n-type semiconductors, and the absorbance in middle IR region has positive correlation with the number of conduction band electrons.38 Fig. 8A shows the FTIR spectra of In2O3 before and after adsorption with TPA. Both of the spectra depict the broad band located at 3442 cm−1 corresponding to the OH stretching vibrations along with in plane deformation vibrations at ca. 1633 and 1358 cm−1, which might be related with the adsorbed water vapour and hydroxyl groups on the surface of metal oxide. The strong absorbance below 650 cm−1 is associated with the In–O vibrations of In2O3.39 Besides these similarities, the sample after adsorption of TPA demonstrates some sharp peaks between 3200 to 2500 cm−1 related with C–H bond (Fig. 7A), same with the FTIR spectrum of TPA itself (Fig. S4), confirming the adsorption of TPA into the materials. In addition, the very intense absorption at middle IR region could be due to the increase amount of conduction band electrons,38 as represented in the red area in Fig. 8A. The results clearly indicate that the adsorption of TPA on In2O3 can increase the latter's conduction band electrons, and hence, the conductivity of In2O3 increase significantly. With the aid of TGA analysis for samples before and after adsorption of TPA, an estimation of the utilization factor of surface indium atoms could be made here. There are 8 indium atoms on (011) plane in the unit cell of In2O3, the dimensions of this unit cell are 1 × 1 × 1 nm3, so the area of (011) plane is about 1.414 nm2. If we assume that the surface of this material is mainly composed of (011) plane, based on the BET surface area (107 m2 g−1), the surface indium atoms on 1 g sample were found to be ca. 1 × 10⁻³ mol. According to the TGA results (Fig. 8B), we can see that 1 g of In2O3 can adsorb about 0.03 g (2.1 × 10⁻⁴ mol) of TPA. Therefore, the utilization factor of surface indium is ca. 21%. Considering the bulky alkyl groups, this value is very high and it confirms that the surface of In2O3 could participate into the sensing process to a large extent thanks to the 3D structure formed by ultrathin nanosheets.


image file: c5ra09063f-f8.tif
Fig. 8 Comparison of the FTIR spectra (A) and TGA results (B) for In2O3 before and after TPA adsorption.

4. Conclusions

In summary, we have reported the precursor-mediated synthesis of cubic In2O3 with 3D structure assembled by ultrathin nanosheets by using In-gly as the precursor. The formation process of In-gly was investigated in detail, which is associated with the tendency to form layered indium glycerolate as well as the Kirkendall effect. Compared with the In2O3 nanosheets reported previously, the obtained In2O3 possess a high surface area and ultrathin nanosheets morphology. The sensing property for detecting TPA was evaluated and the sensing mechanism was analyzed as well. This work can provide some insights to fabricate ultrathin nanosheets based materials, and also give some clues toward the design of reliable sensing materials with excellent performance.

Author contributions

The manuscript was written through contributions of all authors. All authors have given approval to the final version of the manuscript.

Acknowledgements

X. Zou and G.-D. Li gratefully acknowledge the financial assistance NSFC (21371070, 21401066, 21401016), Jilin province science and technology development projects (20150520003JH, 20140101041JC, 20130204001GX), Graduate Innovation Fund of Jilin University (2014083).

References

  1. C. N. R. Rao, H. S. S. R. Matte and U. Maitra, Graphene analogues of inorganic layered materials, Angew. Chem., Int. Ed., 2013, 52, 13162–13185 CrossRef CAS PubMed.
  2. Y. Sun, S. Gao, F. Lei, C. Xiao and Y. Xie, Ultrathin two-dimensional inorganic materials: new opportunities for solid state nanochemistry, Acc. Chem. Res., 2015, 48, 3–12 CrossRef CAS PubMed.
  3. J. Zhu, L. Bai, Y. Sun, X. Zhang, Q. Li, B. Cao, W. Yan and Y. Xie, Topochemical transformation route to atomically thick Co3O4 nanosheets realizing enhanced lithium storage performance, Nanoscale, 2013, 5, 5241–5246 RSC.
  4. Y. Sun, S. Gao, F. Lei, J. Liu, L. Liang and Y. Xie, Atomically-thin non-layered cobalt oxide porous sheets for highly efficient oxygen-evolving electrocatalysts, Chem. Sci., 2014, 5, 3976–3982 RSC.
  5. T. Yu, B. Lim and Y. Xia, Aqueous-phase synthesis of single-crystal ceria nanosheets, Angew. Chem., Int. Ed., 2010, 49, 4484–4487 CrossRef CAS PubMed.
  6. Y. Sun, Z. Sun, S. Gao, H. Cheng, Q. Liu, J. Piao, T. Yao, C. Wu, S. Hu, S. Wei and Y. Xie, Fabrication of flexible and freestanding zinc chalcogenide single layers, Nat. Commun., 2012, 3, 1057 CrossRef PubMed.
  7. Y. T. Pan, X. Yin, K. S. Kwok and H. Yang, Higher-order nanostructures of two-dimensional palladium nanosheets for fast hydrogen sensing, Nano Lett., 2014, 14, 5953–5959 CrossRef CAS PubMed.
  8. P. P. Wang, H. Sun, Y. Ji, W. Li and X. Wang, Three-dimensional assembly of single-layered MoS2, Adv. Mater., 2014, 26, 964–969 CrossRef CAS PubMed.
  9. J. S. Chen, Y. L. Tan, C. M. Li, Y. L. Cheah, D. Luan, S. Madhavi, F. Y. C. Boey, L. A. Archer and X. W. Lou, Constructing hierarchical spheres from large ultrathin anatase TiO2 nanosheets with nearly 100% exposed (001) facets for fast reversible lithium storage, J. Am. Chem. Soc., 2010, 132, 6124–6130 CrossRef CAS PubMed.
  10. S. Chen, G. Liu, H. Yadegari, H. Wang and S. Z. Qiao, Three-dimensional MnO2 ultrathin nanosheet aerogels for high-performance Li-O2 batteries, Nanoscale, 2015, 3, 2559–2563 CAS.
  11. M. Qazi, G. Koley, S. Park and T. Vogt, NO2 detection by adsorption induced work function changes in In2O3 thin films, Appl. Phys. Lett., 2007, 91, 043113 CrossRef PubMed.
  12. D. Zhang, Z. Liu, C. Li, T. Tang, X. Liu, S. Han, B. Lei and C. Zhou, Detection of NO2 down to ppb levels using individual and multiple In2O3 nanowire devices, Nano Lett., 2004, 4, 1919–1924 CrossRef CAS.
  13. W. Yang, P. Wan, X. Zhou, J. Hu, Y. Guan and L. Feng, Additive-free synthesis of In2O3 cubes embedded into graphene sheets and their enhanced NO2 sensing performance at room temperature, ACS Appl. Mater. Interfaces, 2014, 6, 21093–21100 CAS.
  14. A. Shanmugasundaram, P. Basak, S. V. Manorama, B. Krishna and S. Sanyadanam, Hierarchical mesoporous In2O3 with enhanced CO sensing and photocatalytic performance: distinct morphologies of In(OH)3 via self assembly coupled in situ solid-solid transformation, ACS Appl. Mater. Interfaces, 2014, 6, 21093–21100 Search PubMed.
  15. L. Xu, H. Song, B. Dong, Y. Wang, J. Chen and X. Bai, Preparation and bifunctional gas sensing properties of porous In2O3-CeO2 binary oxide nanotubes, Inorg. Chem., 2010, 49, 10590–10597 CrossRef CAS PubMed.
  16. V. D. Kapse, S. A. Ghosh, G. N. Chaudhari and F. C. Raghuwanshi, Nanocrystalline In2O3-based H2S sensors operable at low temperatures, Talanta, 2008, 76, 610–616 CrossRef CAS PubMed.
  17. H. J. Kim, H. M. Jeong, T. H. Kim, J. H. Chung, Y. C. Kang and J. H. Lee, Enhanced ethanol sensing characteristics of In2O3-decorated NiO hollow nanostructures via modulation of hole accumulation layers, ACS Appl. Mater. Interfaces, 2014, 6, 18197–18204 CAS.
  18. W. Yang, P. Wan, M. Jia, J. Hu, Y. Guan and L. Feng, A novel electronic nose based on porous In2O3 microtubes sensor array for the discrimination of VOCs, Biosens. Bioelectron., 2015, 64, 547–553 CrossRef CAS PubMed.
  19. R. Xing, L. Xu, J. Song, C. Zhou, Q. Li, D. Liu and H. W. Song, Preparation and gas sensing properties of In2O3/Au nanorods for detection of volatile organic compounds in exhaled breath, Sci. Rep., 2015, 5, 10717 CrossRef PubMed.
  20. Y. Cao, J. Zhao, X. Zou, P. P. Jin, H. Chen, R. Gao, L. J. Zhou, Y. C. Zou and G. D. Li, Synthesis of porous In2O3 microspheres as a sensitive material for early warning of hydrocarbon explosions, RSC Adv., 2015, 5, 5424–5431 RSC.
  21. W. H. Zhang and W. D. Zhang, Biomolecule-assisted synthesis and gas-sensing properties of porous nanosheet-based corundum In2O3 microflowers, J. Solid State Chem., 2012, 186, 29–35 CrossRef CAS PubMed.
  22. H. Dong, Z. Chen, L. Sun, L. Zhou, Y. Ling, C. Yu, H. H. Tan, C. Jagadish and X. Shen, Nanosheets-based rhombohedral In2O3 3D hierarchical microspheres: synthesis, growth mechanism, and optical properties, J. Phys. Chem. C, 2009, 113, 10511–10516 CAS.
  23. W. H. Zhang and W. D. Zhang, Synthesis and optical properties of nanosheet-based rh-In2O3 microflowers by triethylene glycol-mediated solvothermal process, J. Phys. Chem. Solids, 2013, 74, 1271–1274 CrossRef CAS PubMed.
  24. X. Xu, D. Wang, W. Wang, P. Sun, J. Ma, X. Liang, Y. Sun, Y. Ma and G. Lu, Porous hierarchical In2O3 nanostructures: hydrothermal preparation and gas sensing properties, Sens. Actuators, B, 2012, 171–172, 1066–1072 CrossRef CAS PubMed.
  25. H. Dong, Y. Liu, G. Li, X. Wang, D. Xu, Z. Chen, T. Zhang, J. Wang and L. Zhang, Hierarchically rosette-like In2O3 microspheres for volatile organic compounds gas sensors, Sens. Actuators, B, 2013, 178, 302–309 CrossRef CAS PubMed.
  26. C. Wang, D. Chen and X. Jiao, Flower-like In2O3 nanostructures derived from novel precursor: synthesis, characterization, and formation mechanism, J. Phys. Chem. C, 2009, 113, 7714–7718 CAS.
  27. H. Yang, R. Zhang, H. Dong, J. Yu, W. Yang and D. Chen, In situ growth of self-assembled and single In2O3 nanosheets on the surface of indium grains, Cryst. Growth Des., 2008, 8, 3154–3159 CAS.
  28. F. Lei, Y. Sun, K. Liu, S. Gao, L. Liang, B. Pan and Y. Xie, Oxygen vacancies confined in ultrathin indium oxide porous sheets for promoted visible-light water splitting, J. Am. Chem. Soc., 2014, 136, 6826–6829 CrossRef CAS PubMed.
  29. J. Zhao, Y. Liu, M. Fan, L. Yuan and X. Zou, From solid-state metal alkoxides to nanostructured oxides: a precursor-directed synthetic route to functional inorganic nanomaterials, Inorg. Chem. Front., 2015, 2, 198–212 RSC.
  30. J. Zhao, X. Zou, L. J. Zhou, L. L. Feng, P. P. Jin, Y. P. Liu and G. D. Li, Precursor-mediated synthesis and sensing properties of wurtzite ZnO microspheres composed of radially aligned porous nanorods, Dalton Trans., 2013, 42, 14357–14360 RSC.
  31. J. Zhao, X. Zou, S. J. Zhou, P. P. Wang, L. J. Zhou and G. D. Li, Synthesis and photocatalytic activity of porous anatase TiO2 microspheres composed of {010}-faceted nanobelts, Dalton Trans., 2013, 42, 4365–4368 RSC.
  32. J. Zhao, Y. Zou, X. Zou, T. Bai, Y. Liu, R. Gao, D. Wang and G. D. Li, Self-template construction of hollow Co3O4 microspheres from porous ultrathin nanosheets and efficient noble metal-free water oxidation catalysts, Nanoscale, 2014, 6, 7255–7266 RSC.
  33. C. C. Yec and H. C. Zeng, Synthesis of complex nanomaterials via Ostwald ripening, J. Mater. Chem. A, 2014, 2, 4843–4851 CAS.
  34. W. Wang, M. Dahl and Y. Yin, Hollow nanocrystals through the nanoscale Kirkendall effect, Chem. Mater., 2013, 25, 1179–1189 CrossRef CAS.
  35. D. Larcher, G. Sudant, R. Patrice and J.-M. Tarascon, Some insights on the use of polyols-based metal alkoxides powders as precursors for tailored metal-oxides particles, Chem. Mater., 2003, 15, 3543–3551 CrossRef CAS.
  36. C. Gadois, J. Swiatowska, S. Zanna and P. Marcus, Influence of titanium surface treatment on adsorption of primary amines, J. Phys. Chem. C, 2013, 117, 1297–1307 CAS.
  37. J. L. Lin, Y. C. Lin, B. C. Lin, P. C. Lai, T. E. Chien, S. H. Li and Y. F. Lin, Adsorption and reactions on TiO2: comparison of N,N-dimethylformamide and dimethylamine, J. Phys. Chem. C, 2014, 118, 20291–20297 CAS.
  38. N. Siedl, P. Gugel and O. Diwald, First combined electron paramagnetic resonance and FT-IR spectroscopic evidence for reversible O2 adsorption on In2O3-x nanoparticles, J. Phys. Chem. C, 2013, 117, 20722–20729 CAS.
  39. M. Pashchanka, R. C. Hoffmann, A. Gurlo and J. J. Schneider, Molecular based, chimie douce approach to 0D and 1D indium oxide nanostrucutres. Evaluation of their sensing properties towards CO and H2, J. Mater. Chem., 2010, 20, 8311–8319 RSC.

Footnotes

Electronic supplementary information (ESI) available: XRD patterns, IR spectra, TGA curves of In-gly precursor. IR spectrum of tri-n-propylamine. On and off sensing property. See DOI: 10.1039/c5ra09063f
These authors contributed equally.

This journal is © The Royal Society of Chemistry 2015
Click here to see how this site uses Cookies. View our privacy policy here.