DOI:
10.1039/D4TC02735C
(Paper)
J. Mater. Chem. C, 2024,
12, 17635-17646
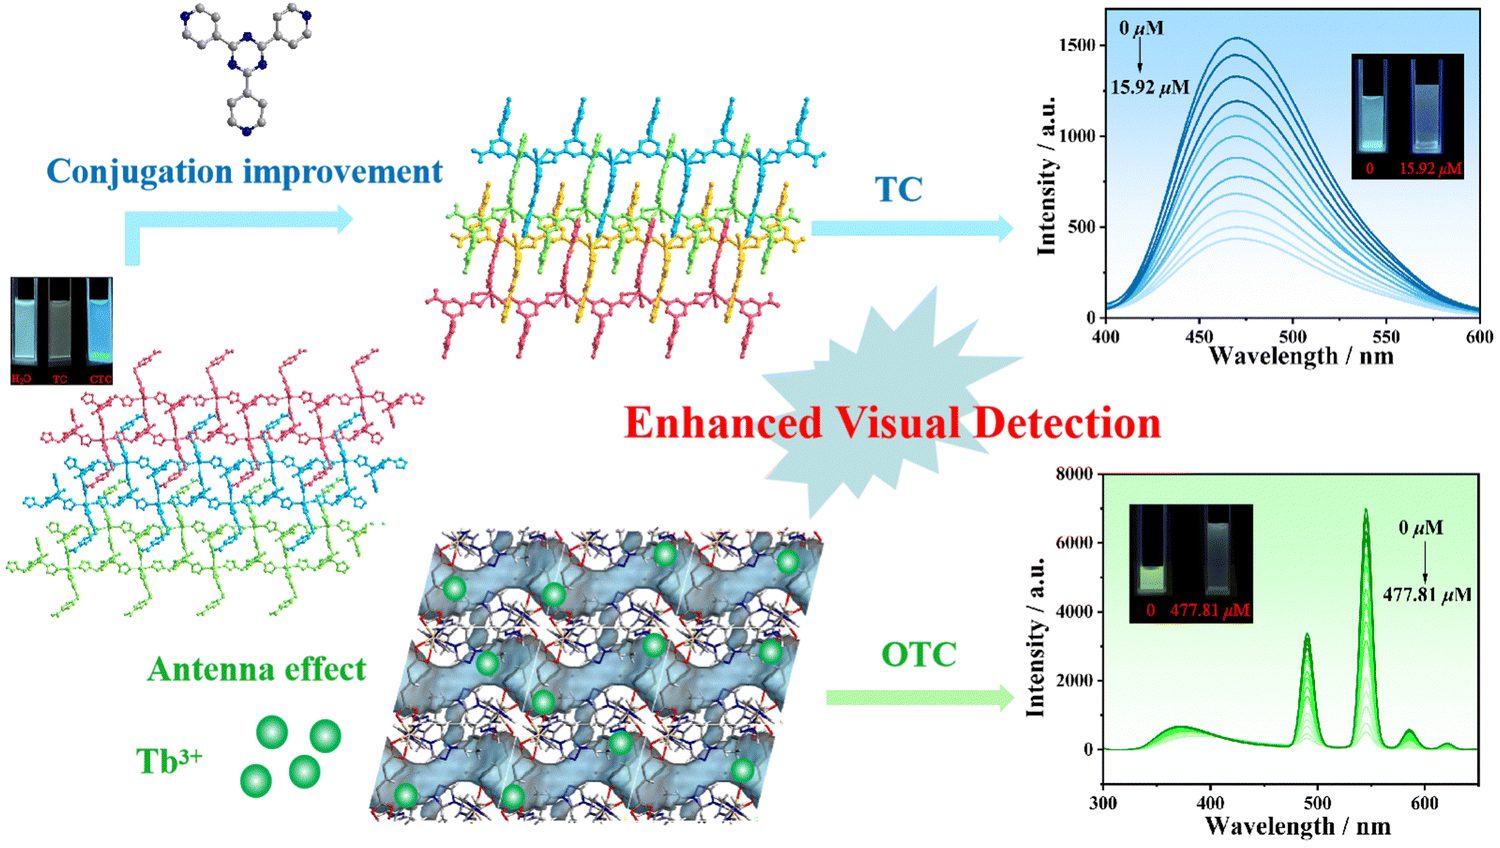
Enhancing visual luminescence detection of tetracycline antibiotics through regulation of nitrogen-containing ligand and antenna effect of Ln3+†
Received
28th June 2024
, Accepted 16th September 2024
First published on 18th September 2024
Abstract
Two fluorescent Cd-MOFs were obtained by a solvothermal process using a flexible carboxylic acid ligand of 4-(3,5-dicarboxylatobenzyloxy) benzoic acid (H3L) and flexible/rigid tripodal N-containing ligands of 1,3,5-tris(1,2,4-triazol-1-ylmethyl)-2,4,6-trimethylbenzene (ttytb) and 2,4,6-tris(4-pyridyl)-1,3,5-triazine (tpytz), namely, {[Cd(HL)(ttytb)]·DMF·3H2O}n (LCU-127) and {[Cd(HL)(tpytz)(H2O)]}n (LCU-128). LCU-127 and LCU-128 both display two-dimensional layered structures with an interesting intercalation mode. Due to the rigid conjugated rings in tpytz, LCU-128 showed stronger blue emission than LCU-127. Accordingly, although both LCU-127 and LCU-128 could detect tetracycline antibiotic tetracycline (TC) through luminescence quenching, the visualization effect under UV light irradiation was much improved in the suspensions of LCU-128, which demonstrated a limit of detection (LOD) of 0.18 μM. Simultaneously, LCU-127 exhibited higher selectivity and sensitivity toward Tb3+ due to stronger antenna effect. When Tb3+ was added to the suspension of LCU-127, the visual detection of oxytetracycline (OTC) was significantly improved with LOD of 45.51 μM. The rigidity or conjugation of the nitrogen-containing ligands may enhance the conjugation of the whole framework and further the electron transfer ability. Meanwhile, the antenna effect caused by the interaction between active sites in LCU-127 and Tb3+ could improve the luminescence performance. Furthermore, LCU-128 and Tb3+ + LCU-127 were effective in mixed matrix membranes (MMMs), which endows them with potential for application in rapid visual detection of antibiotics. The measurements conducted using real water samples revealed the recovery rates toward OTC and TC in the range of 94.7 to 103.0%. Our work indicates that visual detection could be achieved by the employment of more rigid conjugated moieties in the framework and introduction of Ln3+ emitters by the antenna effect.
1. Introduction
Antibiotics are routine and indispensable drugs for the prevention and treatment of serious diseases, as well as for the treatment of microbial diseases in living organisms. Tetracyclines are a class of broad-spectrum antibiotics that can kill certain bacteria and parasites. They are commonly used to treat infectious diseases and have made significant contributions to human medicine and health.1,2 For example, tetracycline (TC), one of the most commonly applied antibiotics in the world, was used as a drug to combat bacteria and a feed additive to promote animal physical development.3 Oxytetracycline hydrochloride (OTC), which is effective against Gram positive bacteria and some Gram negative bacteria, is a member of the tetracycline family and has broad-spectrum antibacterial properties.4–7 Unfortunately, antibiotics ingested cannot be completely metabolized, and only a few could be absorbed by living cells, posing a critical threat to ecosystems and human health. Some traditional detection methods (Raman spectroscopy, gas chromatography–mass spectrometry, and photometry) are expensive and inconvenient.8–10 Consequently, there is an urgent need to design a sensitive, efficient and economical detection method to detect TC and OTC.
Metal–organic frameworks (MOFs), which are also named as porous coordination polymers consisting of metal ions/polynuclear metal clusters and organic ligands linked through coordination bonds, are a group of organic–inorganic hybrid porous materials.11–14 Compared with traditional porous materials, MOFs are widely used in fields such as gas adsorption and separation,15–20 catalysis,19,21–23 proton conduction,24–26 sensing,27–34 drug delivery and bioimaging,35,36 due to their advantages of large specific surface area, high porosity, and tunable structure. Up to now, luminescent metal–organic frameworks (LMOFs) have been widely used for sensing cations, anions, organic small molecules, nitro explosives, antibiotics, and biomarkers, benefiting from their advantages of easy operation, high sensitivity, low detection limit, good accuracy and fast detection speed.37–48
Cadmium metal–organic frameworks have attracted wide attention for the application in detecting multifarious analytes due to their perfect luminescence properties and clear pores.49–51 Because of easy handling, high cost-effectiveness and rapid visual detection, luminescence detection of specific analytes is highly ideal. However, the emission of some MOFs often occurred in the ultraviolet region. Even though the luminescence is strong, it could not meet the requirements of visualization and is not convenient for material detection. Therefore, it is necessary to build novel MOFs or explore some strategies to realize and improve the visualization for detection.
In recent years, our group has been devoted to investigate luminescence materials and obtained a range of MOFs with outstanding sensing activities toward rare earth ions and antibiotics.31,32,52–54 For example, two Zn-MOFs (LCU-113 and LCU-114) showed luminescence quenching in NZF solution with detection limits of 0.35 and 0.46 μM, respectively.52 One Zn-MOF (LCU-123) exhibited excellent sensing activities toward tetracycline (TC).54 To extend our investigation on luminescence sensors, herein two novel Cd-MOFs, namely {[Cd(HL)(ttytb)]·DMF·3H2O}n (LCU-127) and {[Cd(HL)(tpytz)(H2O)]}n (LCU-128) (ttytb = 1,3,5-tris(1,2,4-triazol-1-ylmethyl)-2,4,6-trimethylbenzene, tpytz = 2,4,6-tris(4-pyridyl)-1,3,5-triazine) are reported, characterized and further used for the detection of OTC and TC in water. Both LCU-127 and LCU-128 have a three-dimensional layered intercalation structure and show a luminescence quenching behavior toward TC. The enhanced luminescence recognition of LCU-127 toward Tb3+ was attributed to the antenna effect due to weak interactions of uncoordinated N/O atoms within the pore structure. Interestingly, LCU-128 and Tb3+ + LCU-127 could be used to quantitatively detect TC and OTC via a luminescence quenching mechanism with enhanced visual detection (Scheme 1).
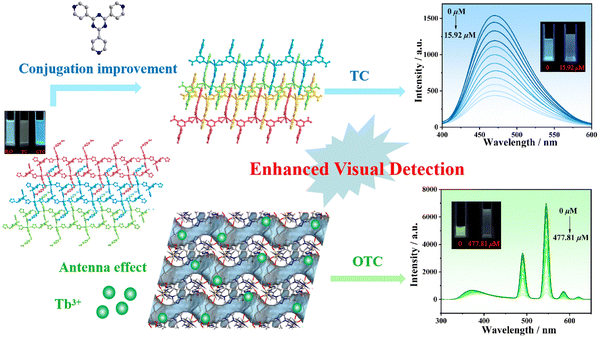 |
| | Scheme 1 Two strategies for improved luminescence visual detection of tetracycline antibiotics through regulation of nitrogen containing ligand and antenna effect of Ln3+. | |
2. Experimental section
2.1. Materials and characterization
All reagents were commercially purchased and used as received without further purification. Basic crystal structural information and structure refinement of the complexes are summarized, and selected bond lengths and angles are listed in Tables S1 and S2 (ESI†). The sensing, titration, anti-interference and recycling experimental processes of LCU-127/LCU-128 toward antibiotics and cations were included in the supporting information.
2.2. Synthesis of {[Cd(HL)(ttytb)]·DMF·3H2O}n (LCU-127)
H3L (0.0079 g, 0.025 mmol), Cd(NO3)2·4H2O (0.0308 g, 0.1 mmol) and ttytb (0.0091 g, 0.025 mmol) were introduced into a mixture of 6 mL DMF/H2O (v/v = 3![[thin space (1/6-em)]](https://www.rsc.org/images/entities/char_2009.gif) :3). The temperature of the reaction system was kept constant at 90 °C for 72 hours, then slowly decreased to room temperature. The crystals were filtered and naturally dried with a yield of approximately 39% (based on H3L). C37H44CdN10O11 (Mr = 917.22). Infrared spectra (KBr pellet: cm−1): 3399(br), 3123(m), 1702(s), 1668(s), 1606(m), 1559(s), 1512(m), 1440(m), 1379(s), 1275(s), 1129(m), 850(w), 777(m), 733(m), 691(w), 641(w), 516(w).
:3). The temperature of the reaction system was kept constant at 90 °C for 72 hours, then slowly decreased to room temperature. The crystals were filtered and naturally dried with a yield of approximately 39% (based on H3L). C37H44CdN10O11 (Mr = 917.22). Infrared spectra (KBr pellet: cm−1): 3399(br), 3123(m), 1702(s), 1668(s), 1606(m), 1559(s), 1512(m), 1440(m), 1379(s), 1275(s), 1129(m), 850(w), 777(m), 733(m), 691(w), 641(w), 516(w).
2.3. Synthesis of {[Cd(HL)(tpytz)(H2O)]}n (LCU-128)
Similar to LCU-127, ttytb was replaced with tpytz (0.0078 g, 0.025 mmol). The resulting light yellow transparent crystals were obtained with a yield of about 47% (based on H3L). C34H23CdN6O8 (Mr = 755.99). Infrared spectra (KBr pellet: cm−1): 3400(br), 1709(m), 1606(m), 1518(s), 1447(m), 1375(s), 1236(m), 1172(m), 1108(w), 1015(w), 855(w), 799(s), 732(w), 652(m), 511(m), 431(w).
2.4. Preparation of mixed matrix membranes (MMMs)
Well-milled 10 mg LCU-128 and 0.5 g poly(methyl methacrylate) (PMMA) were thoroughly mixed in 7.5 mL dichloromethane (CH2Cl2). The mixture was stirred until the solid was fully dissolved. A transparent mixed matrix membrane of LCU-128 was obtained after the evaporation of CH2Cl2. The preparation of PMMA@Tb3++LCU-127 was similar. 10 mg LCU-127, 0.5 g PMMA and 10 mg Tb(NO3)3·6H2O were mixed in 7.5 mL CH2Cl2.
3. Results and discussion
3.1. Structural description and characterization
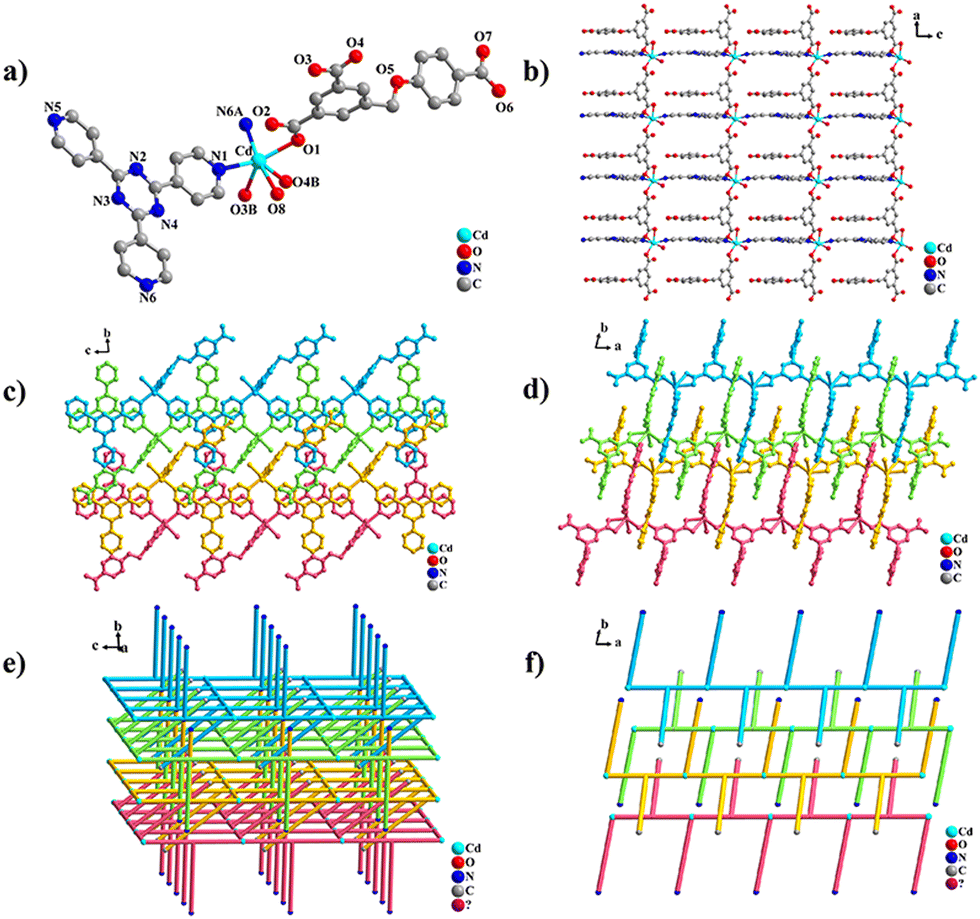
LCU-127 and LCU-128 both crystallize in a triclinic crystal system with space group P![[1 with combining macron]](https://www.rsc.org/images/entities/char_0031_0304.gif) . In the asymmetric unit of LCU-127, there is one Cd2+, one HL2− ligand and one ttytb ligand (Fig. 1(a)). Cd2+ adopts a six-coordinated octahedral configuration and the coordination sphere is composed of three O atoms (O2, O3A, and O4A) of HL2− ligand and three N atoms (N1, N5B, and N9C) of ttytb. O7 in the flexible carboxylic acid ligand HL2− does not participate in coordination with the dihedral angle of two rings connected by –CH2–O– group being 83.50(15)°. The terminal N atoms (N1, N5, and N9) of the three triazole rings within the flexible nitrogen-containing ligand ttytb all participate in the coordination. Three triazole rings are located in three directions of the central benzene ring, connecting three metal ions along the c axis to form a two-dimensional bilayer structure together with Cd2+ connection through HL2− ligands (Fig. 1(b)). The dihedral angles of central benzene and terminal triazole rings are calculated to be 66.81(17), 58.25(18) and 89.3(2)°. The distance of Cd⋯Cd connected by the HL2− ligand is 10.1521(11) Å, while the distances of Cd⋯Cd connected by ttytb ligand are 12.0061(8), 12.1362(9) and 15.1144(14) Å, respectively. The benzene rings of both kinds of ligands in adjacent layers could form π⋯π stacking interactions, resulting into a three-dimensional interlacing structure with one-dimensional channels (Fig. 1(c)–(f) and Fig. S1e, ESI†). These channels are occupied by DMF and H2O molecules, with a volume of solvent molecules of 397.3 Å3 in each unit cell, accounting for 20.4% of the total cell volume calculated using PLATON.55
. In the asymmetric unit of LCU-127, there is one Cd2+, one HL2− ligand and one ttytb ligand (Fig. 1(a)). Cd2+ adopts a six-coordinated octahedral configuration and the coordination sphere is composed of three O atoms (O2, O3A, and O4A) of HL2− ligand and three N atoms (N1, N5B, and N9C) of ttytb. O7 in the flexible carboxylic acid ligand HL2− does not participate in coordination with the dihedral angle of two rings connected by –CH2–O– group being 83.50(15)°. The terminal N atoms (N1, N5, and N9) of the three triazole rings within the flexible nitrogen-containing ligand ttytb all participate in the coordination. Three triazole rings are located in three directions of the central benzene ring, connecting three metal ions along the c axis to form a two-dimensional bilayer structure together with Cd2+ connection through HL2− ligands (Fig. 1(b)). The dihedral angles of central benzene and terminal triazole rings are calculated to be 66.81(17), 58.25(18) and 89.3(2)°. The distance of Cd⋯Cd connected by the HL2− ligand is 10.1521(11) Å, while the distances of Cd⋯Cd connected by ttytb ligand are 12.0061(8), 12.1362(9) and 15.1144(14) Å, respectively. The benzene rings of both kinds of ligands in adjacent layers could form π⋯π stacking interactions, resulting into a three-dimensional interlacing structure with one-dimensional channels (Fig. 1(c)–(f) and Fig. S1e, ESI†). These channels are occupied by DMF and H2O molecules, with a volume of solvent molecules of 397.3 Å3 in each unit cell, accounting for 20.4% of the total cell volume calculated using PLATON.55
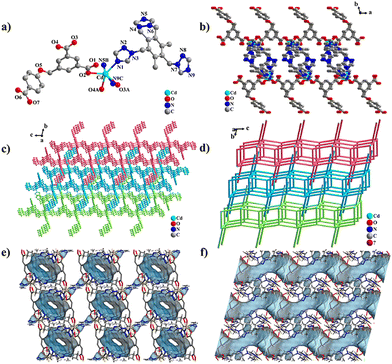 |
| | Fig. 1 (a) The asymmetric unit of LCU-127 (symmetric codes: A: 1 + x, +y, +z; B: 2 − x, 1 − y, 2 − z; C: 2 − x, 1 − y, 1 − z); (b) perspective view of the 2D structure of LCU-127 along the c axis; (c) perspective view of the 3D stacking structure of LCU-127 along the a axis; (d) simplified structure diagram of LCU-127; and (e) and (f) perspective view of LCU-127 showing the solvent accessible surface viewed along the y and z axes. | |
The asymmetric unit of LCU-128 consists of one crystallographic independent Cd2+, one HL2− ligand, one tpytz ligand and one coordinated H2O molecule (Fig. 2(a)). Cd2+ in this case adopts a six-coordinated octahedral configuration with three O atoms (O1, O3B and O4B) from the HL2− ligand, two N atoms (N1 and N6A) from the tpytz ligand and one H2O molecule. The bond lengths of Cd–O and Cd–N are 2.270(3)–2.487(3) Å and 2.337(3)–2.349(3) Å. Different from LCU-127, HL2− and tpytz ligands connect Cd2+ ions along the ac plane to form a two-dimensional single layer structure with Cd⋯Cd distances of 10.1731(5) and 13.1709(7) Å (Fig. 2(b)). The dihedral angle of two benzene rings connected by –CH2–O– group in flexible carboxylic acid ligand is 76.42(15)°. Additionally, the dihedral angles of the central hexagonal ring and three terminal pyridine rings in tpytp are 5.64(13), 6.20(16) and 11.01(14)°, respectively, indicating more coplanar characteristics than ttytb (Fig. S1, ESI†). The uncoordinated O7 in HL2− and N5 pyridine rings in the rigid tpytz ligand are arranged above and below the single layer, respectively, inserting the adjacent layers through π···π stacking interactions. The distances between aromatic rings lying on the π···π stacking are 3.5909(2)–3.8770(3) Å, slightly shorter than the distances of 3.5939(3)–4.5955(4) Å in LCU-127. As a result, a three-dimensional interlacing structure was formed (Fig. 2(c)–(f) and Fig. S1f, ESI†).
 |
| | Fig. 2 (a) The asymmetric unit of LCU-128 (symmetric codes: A: +x, +y, −1 + z; B: 1 + x, +y, +z); (b) perspective view of the 2D structure of LCU-128 along the b axis; (c) and (d) perspective views of the 3D stacking structure of LCU-128 along the a and c axes, respectively; and (e) and (f) simplified structure diagram of LCU-128. | |
3.2. PXRD and thermogravimetric analysis
PXRD analysis was used to confirm the structural consistency, phase purity and stability at different pH values (2, 3, 4, 10, 11, and 12) and in common organic solvents (MeOH, EtOH, CH3CN, DMF, DMA and THF) of the crystalline products. PXPD patterns of the synthesized samples were similar to the patterns simulated from single-crystal diffraction data, indicating that the phase purity of the product is good (Fig. S2, ESI†). Both complexes could retain the crystallinity under weak acid/basic conditions (pH = 4–10) and in common organic solvents. LCU-128 demonstrated more stability in solution with pH values of 2–11, which may be related to the rigid tpytz coligand within this framework. This suggests that the samples could be applied in weaker acid/basic solution and a common organic system. Thermogravimetric (TG) analysis revealed the weight loss of LCU-127 was 5.94% before 98 °C, which was due to the release of free water molecules (calcd 5.89%). In the range of 98–285 °C, the release of DMF molecules occurs in the structure (found 8.59%, calcd 8.47%). Subsequently, the complex framework began to collapse. For LCU-128, from 25 to 140 °C, the weight loss was 2.45%, which was attributed to the loss of coordinated aqua molecule (calcd 2.38%), and the weight dropped sharply from 278 °C due to sample decomposition (Fig. S3, ESI†).
3.3. Luminescence properties
Generally, MOFs based on d10 transition metal ions with π-conjugated aromatic structures were exploited for sensing of multifarious analytes, which have excellent luminescence properties. The solid-state luminescence properties of H3L, ttytb, tpytz and LCU-127/LCU-128 were measured at room temperature (Fig. S4a, ESI†). H3L displayed emission at 390 nm when excited at 325 nm. When the excitation peaks of LCU-127 and LCU-128 were at 310 and 370 nm, the emission peaks were in the blue light region at 362 and 477 nm with broad emission, respectively. The CIE coordinates are (0.1477, 0.0396) and (0.1507, 0.2474), respectively (Fig. S4b, ESI†). It is known that the d10 electron configurations of Cd2+ ions make them difficult to be reduced or oxidized and the emission of these compounds should not be through LMCT (ligand-to-metal charge transfer) or MLCT (metal-to-ligand charge transfer), but through ligand-centered luminescence. As a result, the luminescence emission of both compounds may be ascribed to π*–n or π*–π electron transfer of the ligands.11,33,34 Compared with the ligand, the redshift or blueshift of the compounds was related to the different coordination conformation to Cd centers.
3.4. Luminescence properties of LCU-127 and LCU-128
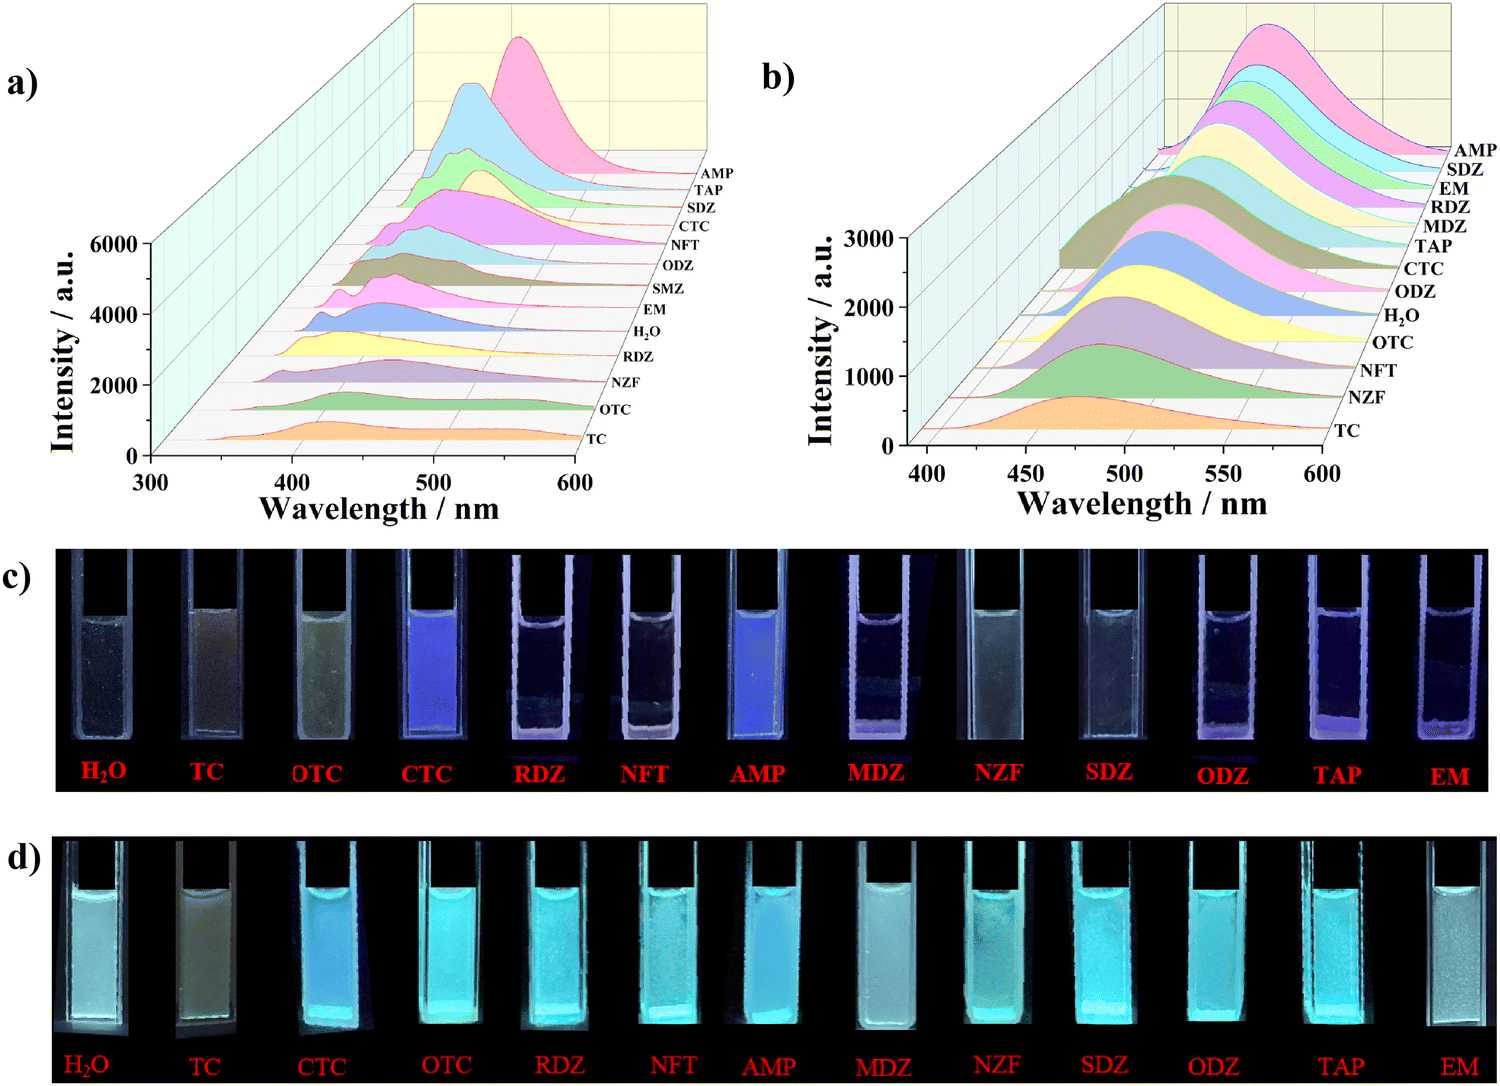
Due to the excellent luminescence emission characteristics and strong water stability of LCU-127 and LCU-128, the luminescence sensing properties of LCU-127 and LCU-128 towards antibiotics in aqueous solutions were further studied. 2 mg samples of LCU-127 and LCU-128 were dispersed in 3.0 mL antibiotic (10−4 M) and sonicated for 30 minutes to form a stable aqueous suspension. As can be seen from Fig. 3(a), the luminescence of LCU-127 in most suspensions appeared at 398 nm, with two small peaks at 380 and 351 nm, and the luminescence intensity remained almost unchanged. The emission peaks of LCU-127 in TC, OTC, CTC, NZF, and AMP suspensions occurred at 414, 417, 421, 437 and 423 nm, respectively, showing a significant red shift compared to the blank sample. In addition, except for CTC and AMP solutions, the luminescence intensity in other three suspensions decreased. Under UV light, most suspensions demonstrated no significant emission except CTC and AMP (Fig. 3(c)).
 |
| | Fig. 3 (a) and (c) Luminescence intensity and photographs of LCU-127 in different antibiotic solutions under a 254 nm UV lamp. (b) and (d) Luminescence intensity and photographs of LCU-128 in different antibiotic solutions under a 365 nm UV lamp. | |
The luminescence intensity of LCU-128 did not change significantly with the addition of most antibiotic solutions. In TC solution, the luminescence intensity of LCU-128 decreased to 34% of the blank sample (Fig. 3(b)). The emission change could be clearly observed with UV light at 365 nm (Fig. 3(d)). LCU-128 was expected to be used as a sensor for TC detection. In order to quantitatively sense TC, the luminescence titration, time response, anti-interference and cycling experiments of LCU-128 toward TC were conducted. The luminescence titration experiment of TC is shown in Fig. 4(a). With the increase of TC concentration, the luminescence intensity decreased significantly. The quenching constant KSV could be obtained from: I0/I = KSV[M] + 1.01223, where [M] is the molar concentration of TC, I0 is the initial luminescence intensity without TC and I is the luminescence intensity after adding TC. KSV of LCU-128 in aqueous solution was 2.776 × 10⁵ M−1. According to the 3δ/k equation (σ is the relative standard deviation of the blank sample and k is the slope of the calibration line), the detection limit was 0.18 μM (Fig. S5a, ESI†). As can be seen from the time-dependent emission intensity curve, the sensing activity showed a fast response within 40 s and the luminescence intensity remained stable (Fig. S5b, ESI†). Up to now, there have been some reports about TC (Table S3, ESI†). LCU-128 has detection limit similar or lower than those of recently reported MOFs.54,56–60 Long et al. reported one Zn-MOF in 2020, {[Zn(bdc)(4,4′-bidpe)]·H2O}n (H2bdc = 1,4-benzenedicarboxylate, 4,4′-bidpe = 4,4′-bis(imidazolyl)diphenyl ether), which has a sensitive response to TC with a detection limit of 3.72 × 10⁻⁷ M.60 Wang et al. reported one new Zn-MOF, namely {[Zn(L)0.5(bpy)0.5(H2O)]·H2O·DMF}n, (denoted as LCU-123) (bpy = 4,4′-bipyridine and H4L = N,N′′-(3,5-dicarboxylphenyl)benzene-1,4-dicarbox-amide), whose detection limit was 0.552 μM for TC.54
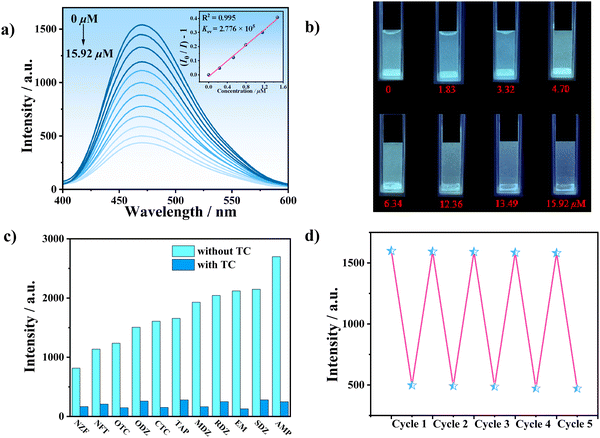 |
| | Fig. 4 (a) Emission spectra of LCU-128 dispersed in water obtained upon incremental addition of TC (insets: the corresponding S–V plots). (b) Color changes of LCU-128 with different concentrations of TC under an UV lamp (365 nm). (c) The intensity of LCU-128 suspensions of common antibiotic substances with and without TC. (d) Recyclability of LCU-128 for detection of TC. | |
To further investigate the anti-interference ability, samples of LCU-128 were immersed in solutions of different antibiotics, cations (NH4+, Al3+, Mg2+, Na+, Cu2+, Ca2+, and K+) and anions (CO32−, NO3−, OH−, SO42−, and Cl−) as well as common organic matters (EtOH, DMF, CH2Cl2, acetone, CH3CN, EA, DMSO, 4-Ap, 3-Ap, o-PD, and m-PD). The luminescence intensity decreased when other matters coexisted with TC, similar to the luminescence intensity in the presence of TC alone (Fig. 4(c) and Fig. S6, ESI†). In addition, considering the complexity of actual detection, other possible factors have also been investigated, such as pH, temperature, ionic strength and so on. The results indicated that almost all suspensions of LCU-128 could be retained and luminescence quenching still be observed (Fig. S7, ESI†). The suspensions of LCU-128 in 3 mL 10−3 M NaCl and Na2SO4 were selected for luminescence titration experiment. The LOD toward TC was calculated to be 1.61 and 0.80 μM, respectively, similar to that in aqueous media (Fig. S8, ESI†). In addition, the sensing activity can be repeated and the luminescence intensity can be roughly restored to its original level even after five cycles (Fig. 4(d)).
The luminescence quenching mechanism may include: (i) disintegration or collapse of the structure; (ii) Förster resonance energy transfer (FRET);61 (iii) internal filter effect (IFE);52 and (iv) photoinduced electron transfer (PET).62 In order to understand the luminescence quenching mechanism of LCU-128 toward TC, a series of experiments were carried out. Firstly, a well ground sample of LCU-128 was immersed in TC solution (10−4 M) for 3 days and then analyzed using PXRD. The peaks of the immersed sample were consistent with those of the as-synthesized sample, indicating that the structure did not collapse, suggesting that structural collapse was not the cause of the decreased luminescence (Fig. S9a, ESI†). Secondly, the UV-vis absorption spectra of TC (10−4 M) did not overlap with the emission spectrum of LCU-128, but largely overlapped with the excitation spectrum. Therefore, the luminescence quenching effect of LCU-128 on TC was attributed to IFE rather than FRET (Fig. S9b, ESI†). The luminescent lifetime of LCU-128 was slightly reduced from 47.26 to 46.79 ns after addition of TC, suggesting that induction should be a static quenching mechanism (Fig. S10a, ESI†).47,48 Thirdly, in order to determine whether there was a PET process in the sensing process, the energies of the HOMO and LUMO for H3L and TC were obtained using the basis set B3PW91/6-31G of the Gaussian 09 program (Fig. S10b, ESI†). The HOMO level of TC (−4.67 eV) was higher than the HOMO level of LCU-128 (−6.94 eV). Therefore, upon the excitation of LCU-128, photoinduced electron transfer (PET) was possible. Finally, XPS data of LCU-128 were compared. The peak values of Cd, C, N and O could be clearly observed after soaking in TC solution (Fig. S11, ESI†). In particular, the O1s peaks moved from 531.52 and 533.25 eV to 531.40 and 532.94 eV, which could be assigned to C–O–C and O![[double bond, length as m-dash]](https://www.rsc.org/images/entities/char_e001.gif) C–O groups, respectively. The N1s peak moved from 399.62 to 399.49 eV attributed to the CN–C group (Fig. S11c and d, ESI†).63–65 It suggested that there may be weak interaction between the complex and TC. Based on the above results, the excellent detection performance of LCU-128 toward TC was attributed to the synergistic effect of PET, IFE and the weak interaction between TC and LCU-128 in the sensing process.
C–O groups, respectively. The N1s peak moved from 399.62 to 399.49 eV attributed to the CN–C group (Fig. S11c and d, ESI†).63–65 It suggested that there may be weak interaction between the complex and TC. Based on the above results, the excellent detection performance of LCU-128 toward TC was attributed to the synergistic effect of PET, IFE and the weak interaction between TC and LCU-128 in the sensing process.
3.5. Sensing Tb3+ and OTC in the absence of Tb3+
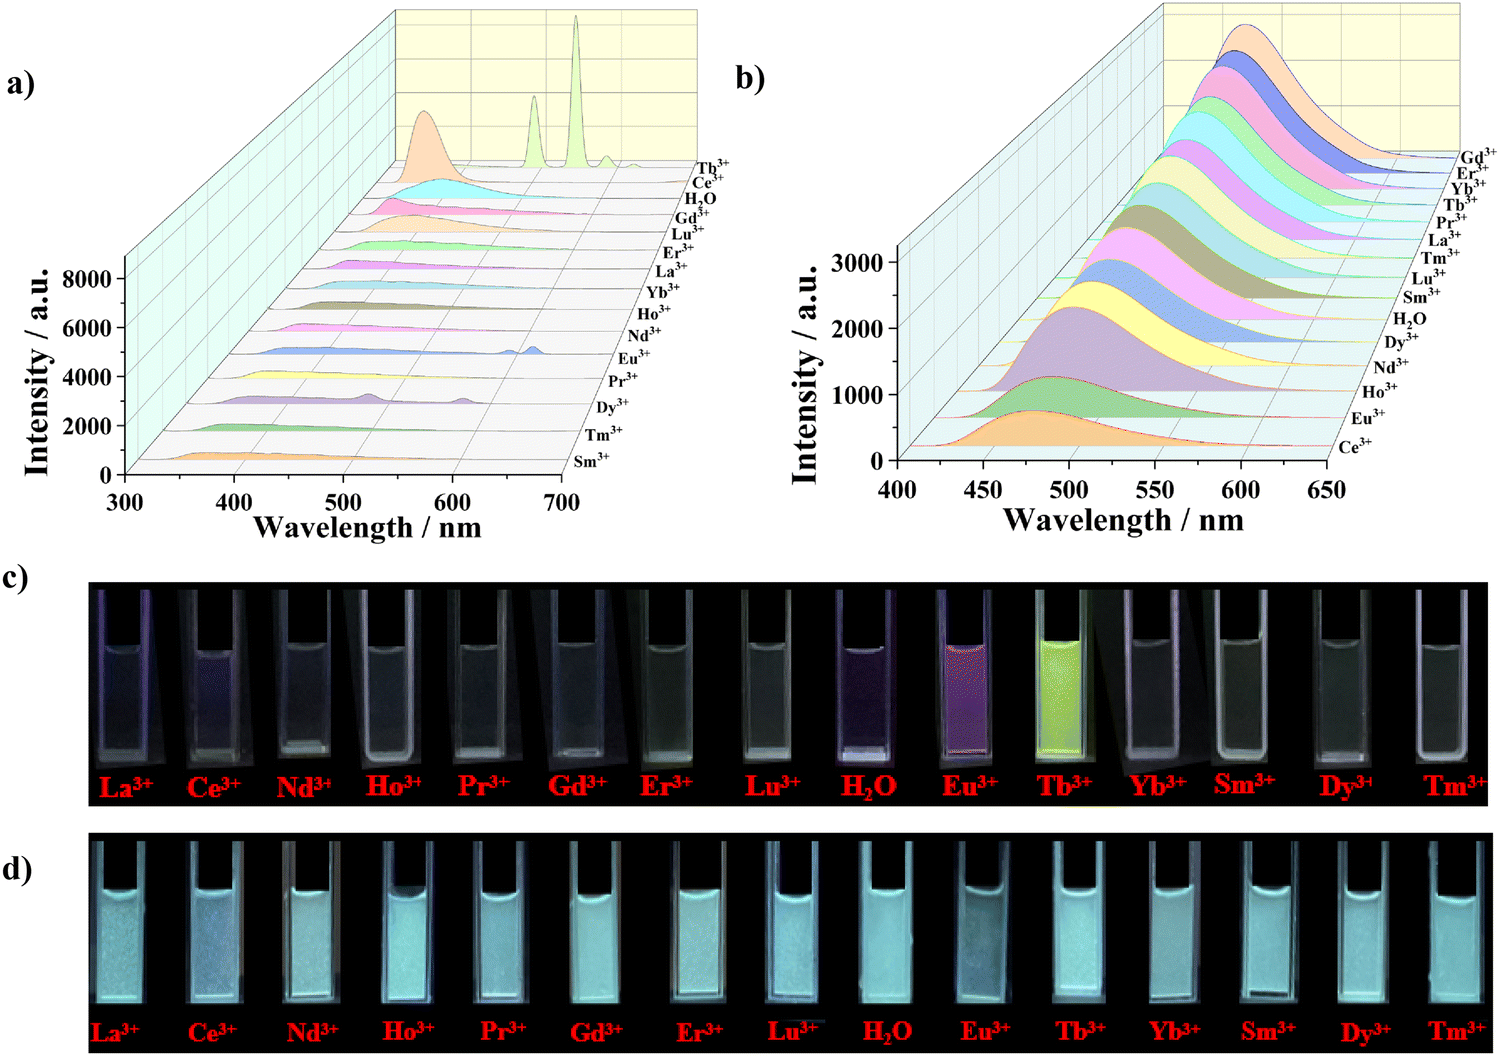
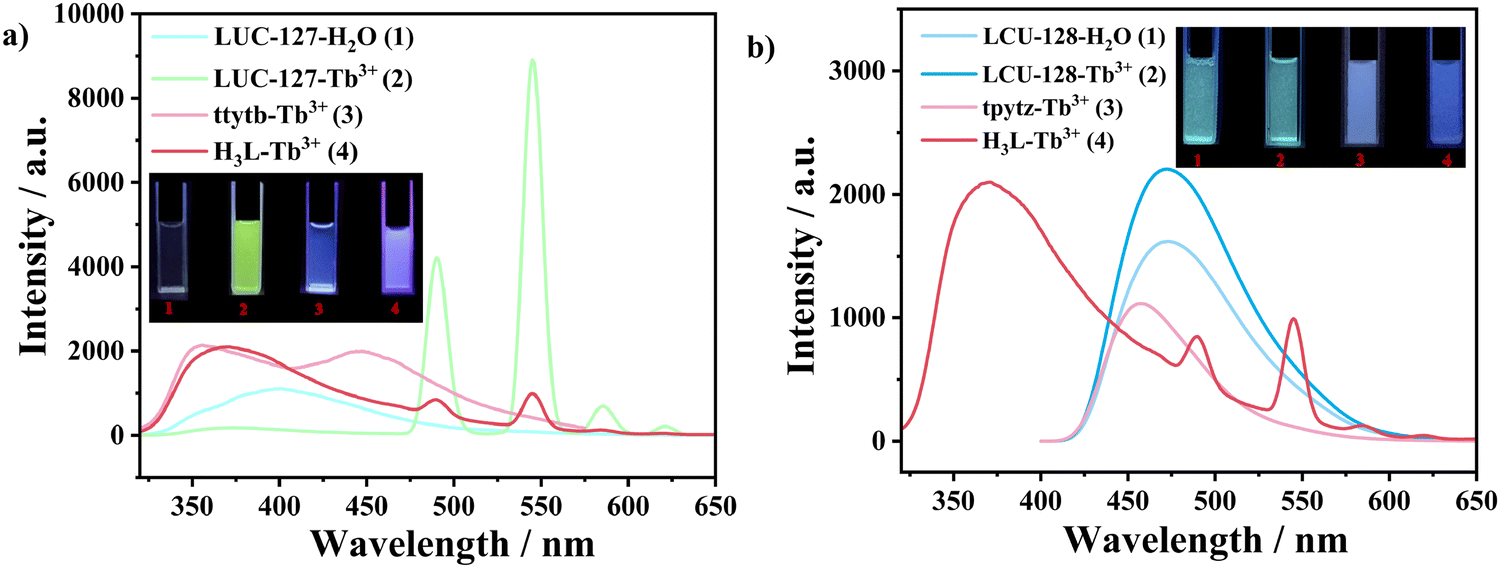
The water stability as well as the presence of uncoordinated carboxyl and N atoms in the structure of LCU-127 and LCU-128 urged us to investigate their luminescence response toward lanthanide ions (Fig. 5(a) and (b)). Stable suspensions of LCU-127 and LCU-128 were formed by dispersing 2 mg of samples in 3 mL of M(NO3)x (M = La3+, Ce3+, Nd3+, Pr3+, Gd3+, Ho3+, Er3+, Tm3+, Yb3+, Lu3+, Eu3+, Dy3+, Sm3+ and Tb3+) aqueous solutions (10−3 M), respectively. The excitation wavelengths of LCU-127 and LCU-128 were 290 and 370 nm, respectively. Two complexes demonstrated different responses. For LCU-127, the luminescence position of most suspensions exhibited slight blue shift while the luminescence intensity did not show a significant change. Specially, LCU-127 exhibited characteristic emission peaks in Dy3+, Eu3+ and Tb3+ suspensions with the decrease of the peaks at 401 nm in the meanwhile. In the Dy3+ suspension, weak emissions appeared at 479 and 573 nm, corresponding to the characteristic emission transitions of Dy3+ ions (4F9/2 → 6H15/2 and 4F9/2 → 6H13/2). In the Eu3+ suspension, weak characteristic emissions of Eu3+ at 591 and 616 nm originating from transitions of 5D0 → 7F1 and 5D0 → 7F2 were observed. Significantly, the peak at 401 nm of LCU-127 in Tb3+ almost disappeared and strong emissions appeared at 490, 545, 585, and 621 nm, corresponding to the characteristic emission transitions of Tb3+ ions (5D4 → 7F6, 5D4 → 7F5, 5D4 → 7F4 and 5D4 → 7F3), among which the 5D4 → 7F5 transition was the strongest. For LCU-128, however, the emission of Ln3+ in all suspensions was similar to that in H2O solution with slight shifts. Under ultraviolet light, LCU-127 emitted purplish red and green light in suspensions of Eu3+ and Tb3+, respectively, while there were no significant changes in the solutions of Ln3+ for LCU-128, indicating that LCU-127 may be used as a luminescence probe toward Tb3+ (Fig. 5(c) and (d)).
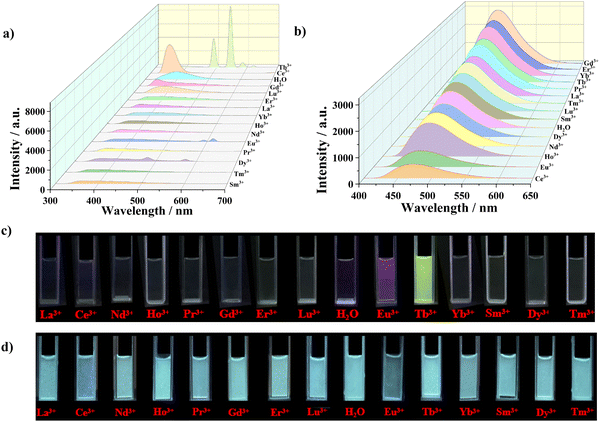 |
| | Fig. 5 (a) and (b) Luminescence spectra of LCU-127 and LCU-128 in Ln3+ aqueous solutions, respectively. (c) and (d) Photographs of LCU-127 and LCU-128 in different Ln3+ aqueous solutions under UV lamp (254/365 nm). | |
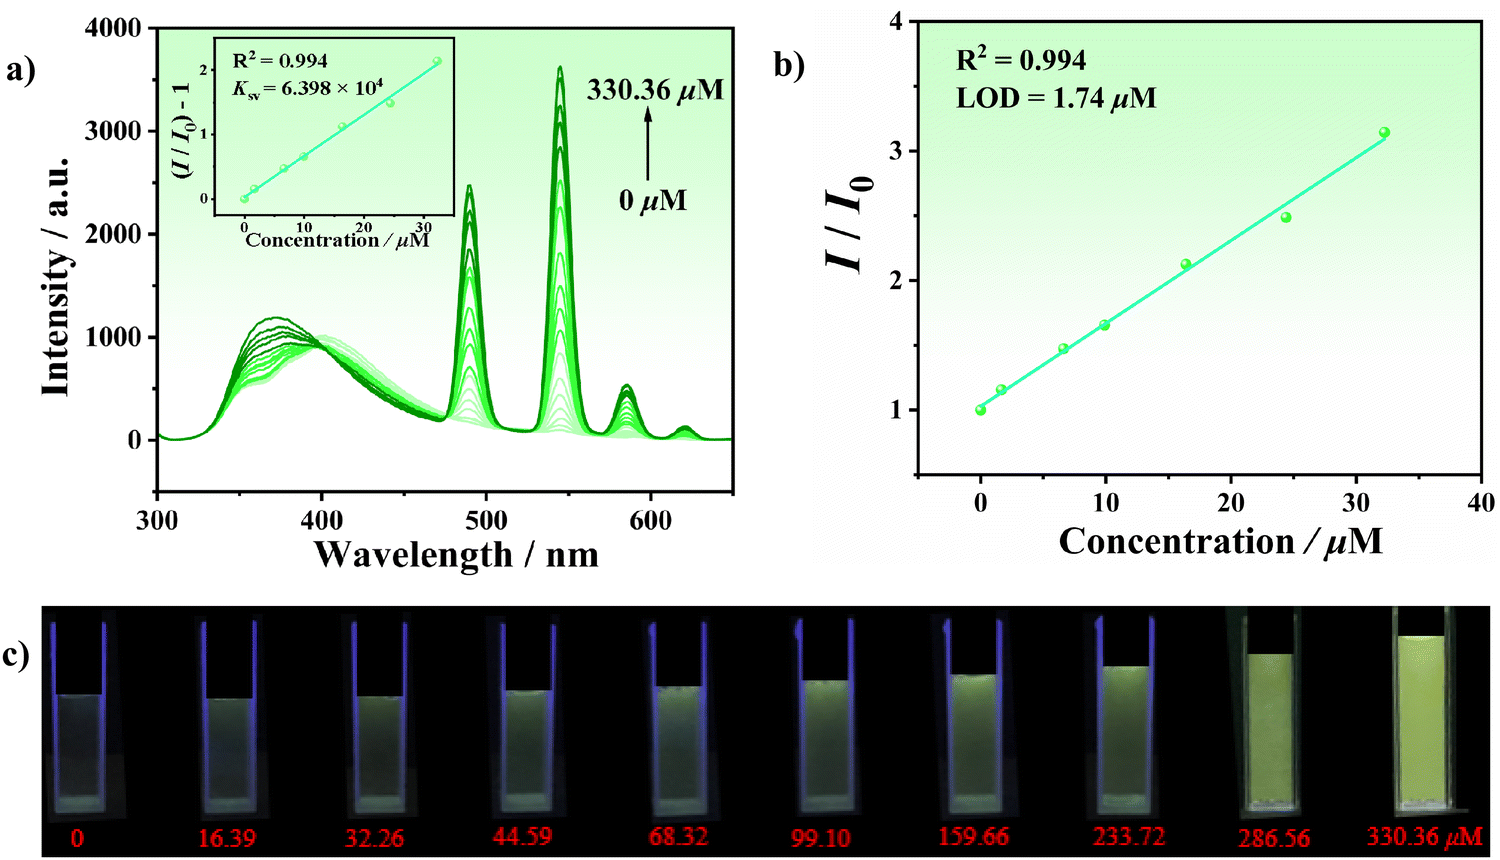
In order to achieve quantitative detection of Tb3+, the luminescence spectra of LCU-127 were measured at different concentrations of Tb3+. As shown in Fig. 6(a), when the concentration of Tb3+ increased, the luminescence intensity at 401 nm decreased while the characteristic emission peak gradually increased. When the concentration of Tb3+ increased to 330.36 μM, the emission peak of LCU-127 shifted to 372 nm. Within the range of 0–32.26 μM, the luminescence intensity of the rare earth peak at 545 nm showed a good linear relationship with the concentration of Tb3+ (R2 = 0.994). The KSV value was 6.398 × 10⁴ M−1, obtained from fitting the data obtained using: I/I0 − 1 = KSV[M] + 0.02927 ([M]: concentration of Tb3+). Under UV irradiation, green emission became more and more pronounced as the concentration of Tb3+ increased (Fig. 6(c)). According to 3σ/k based on the intensity at 545 nm, a low detection limit of 1.74 μM was obtained (Fig. 6(b)). The time-dependent measurement indicated that the characteristic Tb3+ emission peak rapidly appeared at 545 nm and the luminescence intensity remained stable after 20 seconds (Fig. S12, ESI†). Furthermore, when other ions coexisted with Tb3+, the characteristic emission peak of Tb3+ in LCU-127 still maintained a high intensity at 545 nm (Fig. S13, ESI†).
 |
| | Fig. 6 (a) Luminescence titration results of LCU-127 toward Tb3+ (insets: the corresponding S–V plots). (b) I/I0vs. Tb3+ ion concentration plot in the range of 0–32.26 μM, at 545 nm. The green solid line represents the linear fit of the data. (c) Photographs of the emission of LCU-127 with different concentrations of Tb3+. | |
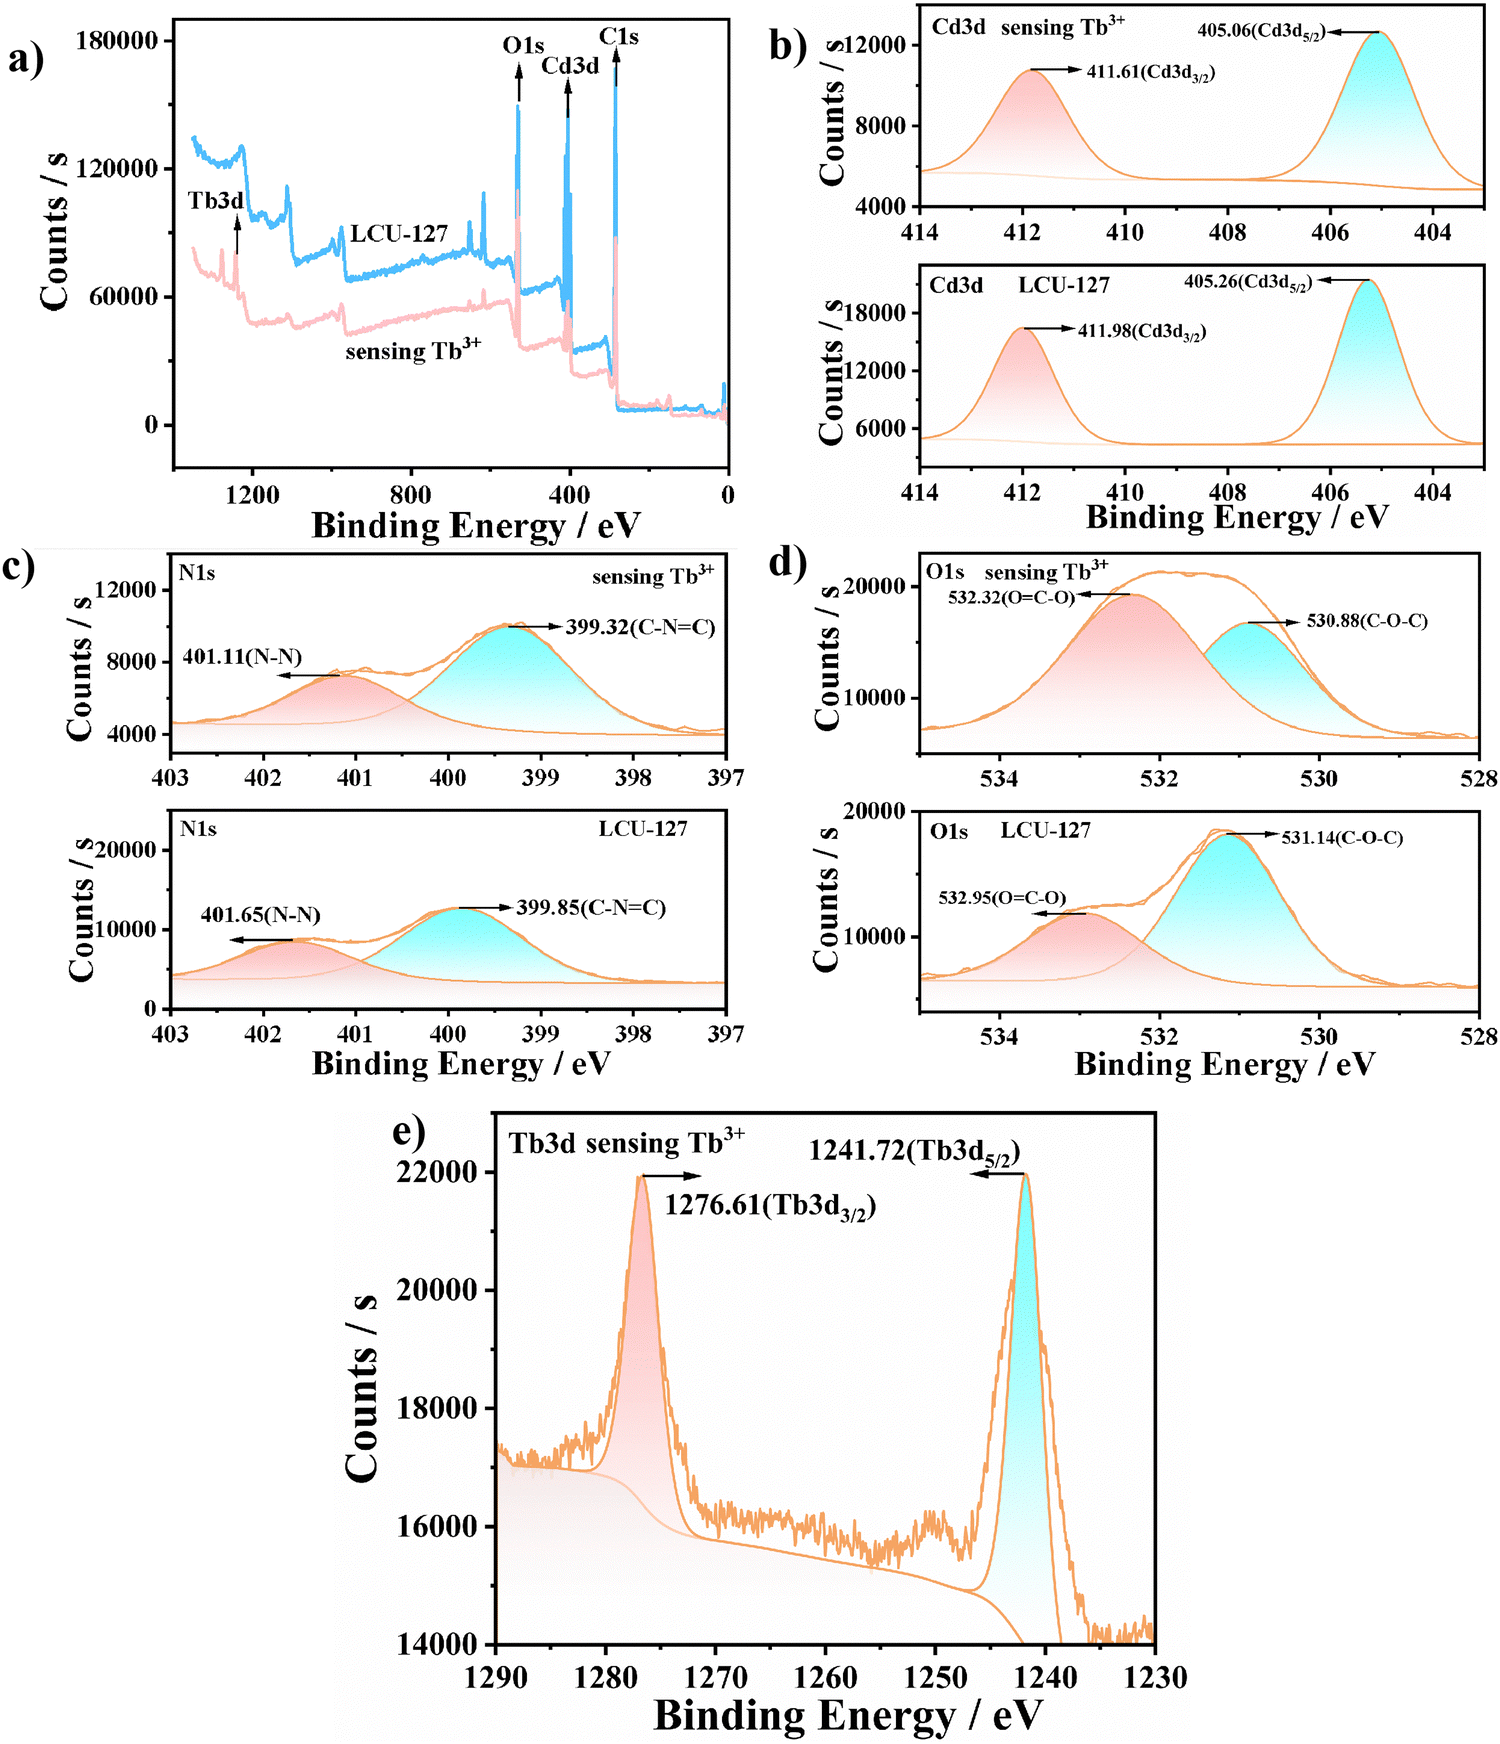
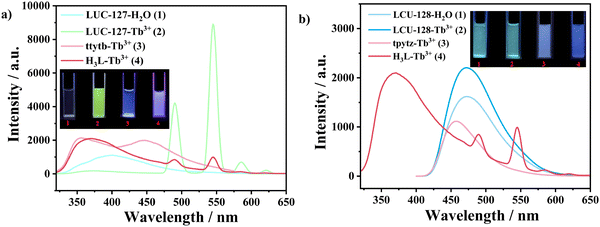
The sensing mechanism of LCU-127 toward Tb3+ was further clarified. First, the structure after soaking in Tb3+ did not collapse, indicating that this was not the cause of fluorescence enhancement (Fig. S14, ESI†). Second, Cd3d peaks were observed at 411.98 eV (Cd3d3/2) and 405.26 eV (Cd3d5/2) in the XPS spectra. In the O1s spectrum, the deconvoluted peaks at 531.14 and 532.95 eV could be assigned to C–O–C and (OC–O) groups, respectively. After soaking in Tb3+ solution (10−3 M) for three days, the 3d3/2 and 3d5/2 peaks of Tb3d could be clearly observed at 1276.61 and 1241.72 eV, respectively. Meanwhile, the O1s peaks showed a slight shift to 530.88 and 532.32 eV, respectively, which may indicate possible weak interactions between uncoordinated carboxylate O atoms and Tb3+ (Fig. 7). Through SEM images, it can be observed that the morphology of the sample did not change (Fig. S15, ESI†). The EDS mapping of LCU-127 showed that Tb3+ could be uniformly dispersed after soaking (Fig. S16, ESI†). Third, the occurrence of characteristic emission peaks of Tb3+ should be ascribed to the antenna effect.66,67 Luminescence was compared among the following systems: LCU-127 suspensions, ttytb with Tb3+, H3L with Tb3+, and LCU-127 with Tb3+ (Fig. 8(a)). Due to the weak antenna effect of H3L itself, it can be believed that the antenna effect should come from H3L or HL2− inside LCU-127. That is to say, the carboxylate units in the solid state of LCU-127 significantly enhanced the antenna effect. Fourth, the luminescence lifetime at 545 nm increased obviously, which indicates that the antenna effect occurred (Fig. S17a, ESI†). Comparably, the luminescence spectra of LCU-128, H3L and tpytz in Tb3+ solution and the photographs under a UV lamp are shown in Fig. 8(b). LCU-128 did not exhibit the characteristic emission peak in Tb3+ solution and the photographs under a UV lamp also did not show any color change compared to the blank sample, indicating that there was almost no antenna effect between LCU-128 and Tb3+. Based on the above experiments, it could be inferred that the difference of the antenna effect of these two complexes may not be entirely attributed to H3L but may also be related to the rigidity/flexibility of the building units as well as the whole framework. The more strong rigidity or conjugation of nitrogen-containing ligands in LCU-128 could enhance the conjugation of the entire skeleton, further enhancing the electron transfer ability within the MOF framework, thus reducing the antenna effect on Ln3+. At the same time, the pores in LCU-127 may provide more binding sites for Tb3+. As a consequence, the antenna effect of LCU-127 was stronger than that of LCU-128.
 |
| | Fig. 7 (a) XPS spectra of LCU-127 before and after immersion in Tb3+. (b)–(e) High resolution regions of Cd3d, N1s, O1s and Tb3d. | |
 |
| | Fig. 8 (a) The luminescence spectra of LCU-127 suspensions, ttytb with Tb3+, H3L with Tb3+ and LCU-127 with Tb3+ (insets: the photographs of LCU-127 suspensions, ttytb with Tb3+, H3L with Tb3+ and LCU-127 with Tb3+ under a 254 nm UV lamp). (b) The luminescence spectra of LCU-128 suspension, tpytz with Tb3+, H3L with Tb3+ and LCU-128 with Tb3+ (insets: the photographs of LCU-128 suspension, tpytz with Tb3+, H3L with Tb3+ and LCU-128 with Tb3+ under a 365 nm UV lamp). | |
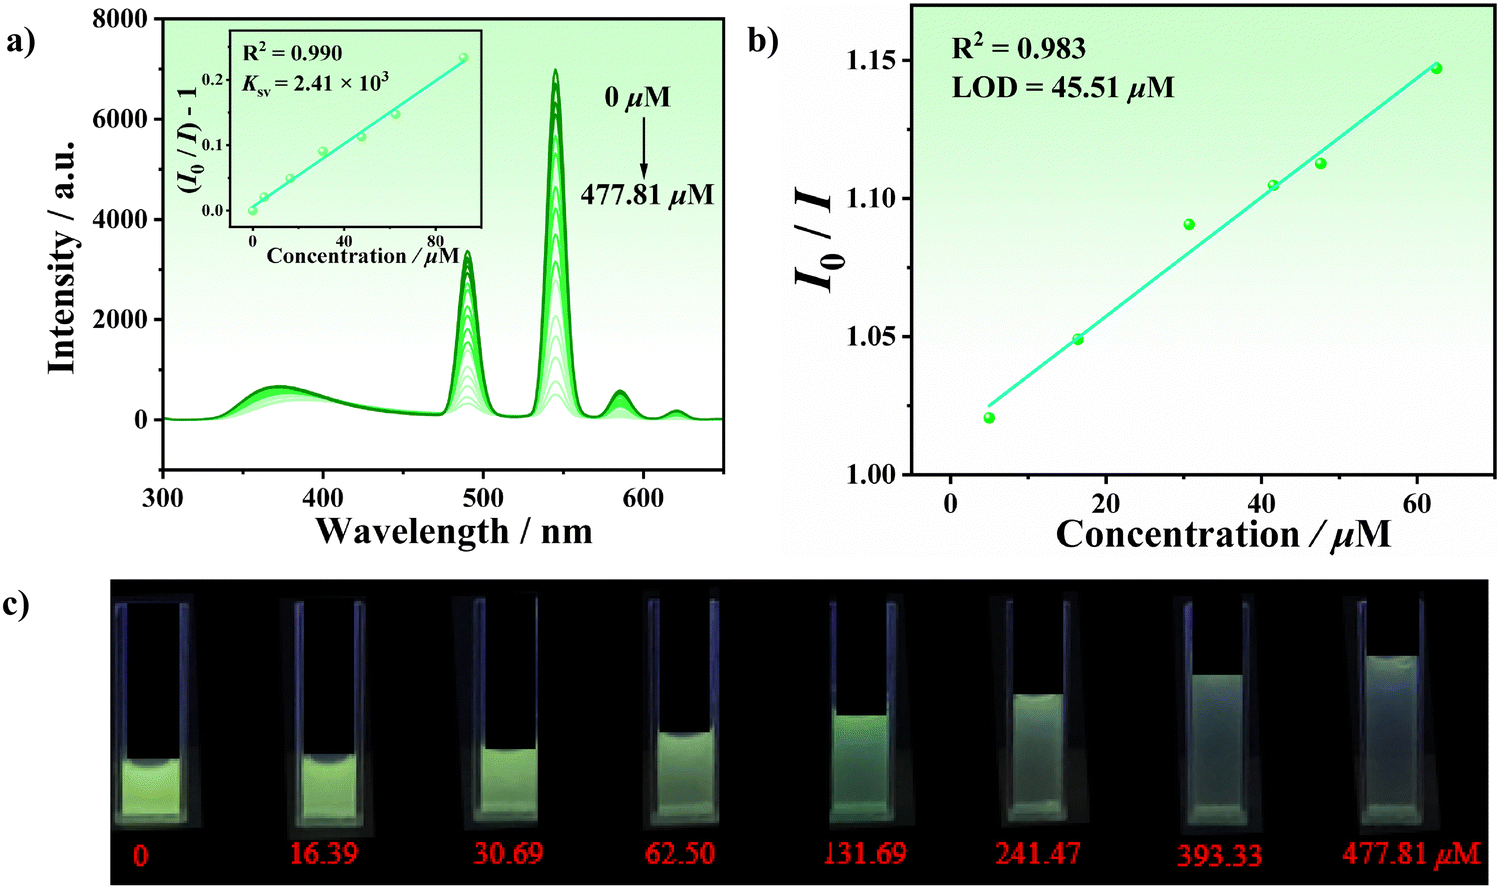
We have conducted a series of studies in the early stages to detect antibiotics.52–54 Recently, one novel three-dimensional (3D) Cd-MOF (LCU-117) has been constructed which had high selectivity and sensitivity toward Eu3+. Meanwhile, Eu3+@LCU-117, composed of Eu3+ simply mixed with LCU-117 in a suspension, showed excellent potential for OTC sensing applications. Herein, LCU-127 exhibited luminescence quenching for TC and OTC but there was no significant color change under 254 nm ultraviolet light. Considering that LCU-127 exhibited strong green luminescence in Tb3+, we attempted to perform TC and OTC measurements in a suspension containing Tb3+ (10−3 M, represented as Tb3+ + LCU-127). 2 mg samples of LCU-127 were dispersed in 1.0 mL of Tb3+ solution (10−3 M), and then 2 mL TC/OTC solutions (10−4 M) were added to the stable suspensions, respectively. The photographs under UV light showed that compared to the blank sample, the emission of Tb3+ + LCU-127 did not change significantly in TC solution, while in OTC solution the green luminescence weakened (Fig. S17b, ESI†). As shown in Fig. 9, as the OTC concentration increased, the luminescence intensity of Tb3+ + LCU-127 at 545 nm gradually decreased, indicating that Tb3+ + LCU-127 may have potential to be used to perform luminescence sensing of OTC to achieve a visualization effect. The quenching constant KSV could be obtained from: I0/I − 1 = KSV[M] + 0.00493, where [M] is the molar concentration of OTC, I0 and I are the luminescence intensity before and after the addition of OTC. The KSV of Tb3+ + LCU-127 in OTC aqueous solution was 2.41 × 10³ M−1. Based on the calculation at 545 nm, the LOD was 45.51 μM. The spectra of time-dependent and cyclic experiments showed that Tb3+ + LCU-127 had the advantages of a fast response and good cycling toward OTC (Fig. S18, ESI†). As a result, in the presence of Tb3+, LCU-127 exhibited high selectivity and sensitivity toward OTC and its visualization effect was better than that of LCU-127 itself. The luminescence investigation has also been conducted in different media to investigate the possible influence of pH, temperature and ionic strength. Similarly, above factors could only slightly affect the quenching of OTC (Fig. S19, ESI†). The LOD of LCU-127 was 12.96 and 22.31 μM in NaCl and Na2SO4, respectively, in the absence of Tb3+, slightly smaller than that in an aqueous system (Fig. S20, ESI†).
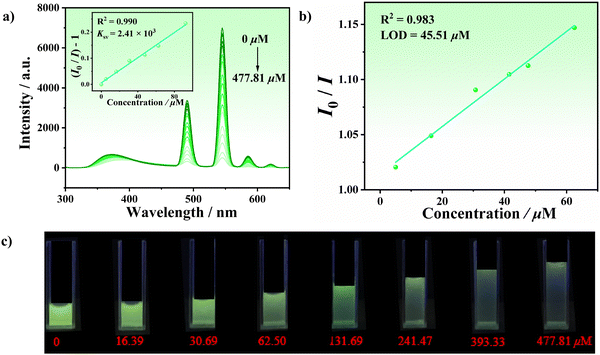 |
| | Fig. 9 (a) Luminescence titration results of Tb3+ + LCU-127 toward OTC (insets: the corresponding S–V plots). (b) I0/I vs. OTC concentration plot in the range of 0–62.50 μM at 545 nm. The green solid line represents the linear fit of the data. (c) Photographs of the emission of Tb3+ + LCU-127 with different concentrations of OTC. | |
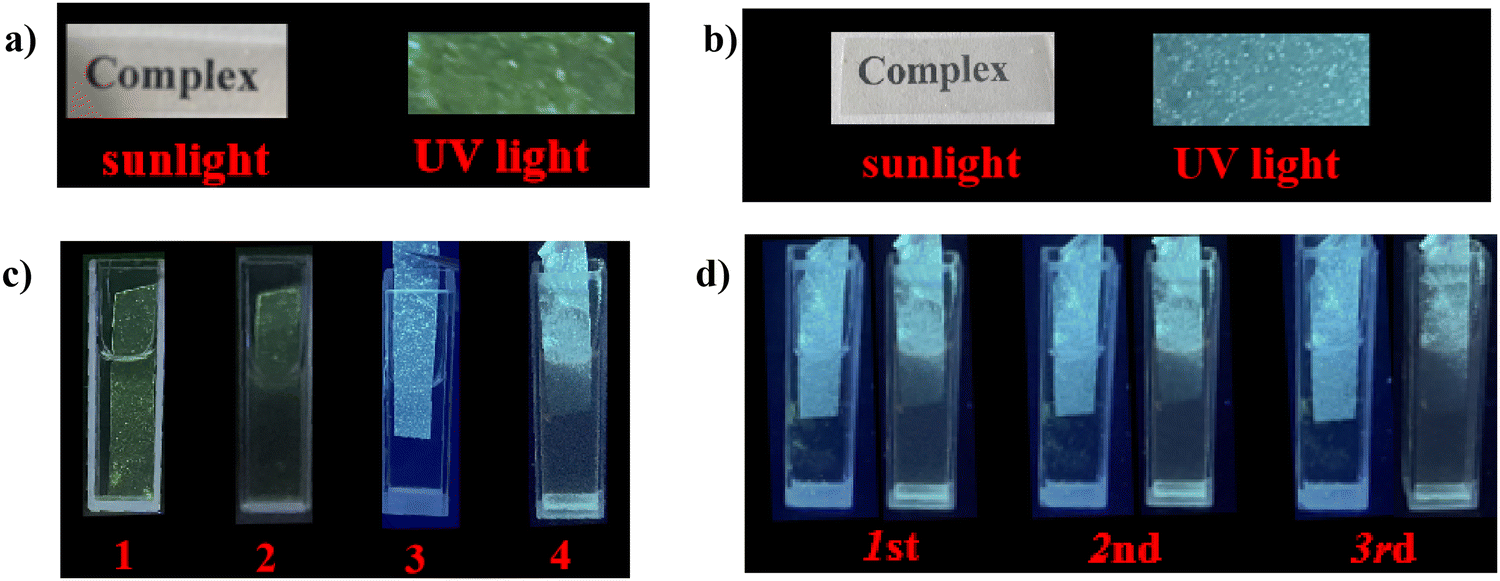
3.6. Potential applications
In order to expand the practical applications, luminescent MMMs were prepared and characterized by PXRD and SEM (Fig. S21, ESI†). As shown in Fig. 10(a) and (b), MMM has transparency and the word “complex” can be clearly seen through MMM. PMMA@Tb3+ + LCU-127 and PMMA@LCU-128 exhibited strong green and blue emission under ultraviolet light, respectively. PMMA@Tb3+ + LCU-127 in OTC and PMMA@LCU-128 in TC exhibited luminescence quenching (Fig. 10(c)). Furthermore, these MMMs could be reused after washing thoroughly with water, indicating good recycling ability (Fig. 10(d)). In addition, in order to gain a deeper understanding of practicality, Tb3+ + LCU-127 and LCU-128 have also been used to detect antibiotics in water of Dongchang Lake and Tuhai River in Liaocheng of China (Table 1). In the samples spiked with known amounts of the analytes, the calculated recoveries in Dongchang Lake and Tuhai River water ranged from 97.5 to 99.3% and 94.7 to 100.9% (toward OTC), respectively. For TC, the calculated recovery rates in Dongchang Lake and Tuhai River ranged from 96.7% to 100.3% and 97.7% to 103.0%, respectively. The satisfactory recovery rates indicated that LCU-127 and LCU-128 can be applied to the detection of TC and OTC in actual samples.
 |
| | Fig. 10 (a) and (b) View of the MMMs based on Tb3+ + LCU-127 and LCU-128 under sunlight and a UV lamp, respectively. (c) Photographs of MMMs based on Tb3+ + LCU-127/LCU-128 after immersing in OTC/TC aqueous solution, respectively (1: PMMA@Tb3+ + LCU-127-H2O; 2: PMMA@Tb3+ + LCU-127-OTC; 3: PMMA@LCU-128-H2O; 4: PMMA@LCU-128-TC). (d) Recycling ability of MMMs based on LCU-128 for sensing in TC aqueous solution. | |
Table 1 Determination of OTC by Tb3+ + LCU-127 and TC by LCU-128 in Dongchang Lake water and Tuhai River water samples
|
|
Sample |
Added/μM |
Founda (mean ± SD) (μM) |
Recovery (%) |
RSDb (n = 3, %) |
|
All concentrations are expressed as the mean of three measurements ± standard deviation (SD).
The relative standard deviation (RSD) was defined as (SD/mean) × 100%.
|
|
Tb3+ + LCU-127 toward OTC |
Dongchang Lake water |
50.5 |
50.13 ± 0.09 |
99.3 |
0.17 |
| 55.0 |
54.57 ± 1.27 |
99.2 |
2.33 |
| 111.0 |
108.20 ± 1.67 |
97.5 |
1.54 |
| Tuhai River water |
50.5 |
48.86 ± 1.95 |
96.7 |
4.00 |
| 55.0 |
52.07 ± 0.31 |
94.7 |
0.60 |
| 111.0 |
111.97 ± 0.62 |
100.9 |
0.56 |
|
LCU-128 toward TC |
Dongchang Lake water |
0.9 |
0.87 ± 0.002 |
96.7 |
2.30 |
| 1.82 |
1.82 ± 0.06 |
100.0 |
3.34 |
| 2.2 |
2.21 ± 0.06 |
100.3 |
2.57 |
| Tuhai River water |
0.9 |
0.93 ± 0.03 |
103.0 |
3.46 |
| 1.82 |
1.85 ± 0.07 |
101.8 |
3.68 |
| 2.2 |
2.15 ± 0.01 |
97.7 |
4.65 |
4. Conclusion
In summary, two water-stable luminescent Cd-based MOFs LCU-127 and LCU-128 have been successfully synthesized based on one flexible carboxylate ligand and two N-containing ligands with different rigidity and flexibility. Two MOFs demonstrated interesting interpenetrating structures and different luminescence responses toward antibiotics TC/OTC and Ln3+. LCU-127 specifically recognized Tb3+ through luminescence enhancement, which was attributed to the antenna effect. When Tb3+ was added to the suspension of LCU-127 with oxytetracycline (OTC) (represented as Tb3+ + LCU-127), luminescence was significantly quenched and the visualization effect was enhanced with a LOD as low as 45.51 μM. LCU-128 had the advantages of a fast response, high selectivity, and good repeatability, making it a luminescent sensor for TC with a low LOD of only 0.18 μM. The mechanism of luminescence quenching could be attributed to the internal filtering effect (IFE), photoelectron transfer (PET) and weak interactions between TC and LCU-128. Tb3+ + LCU-127 and LCU-128 could be explored as MMMs, providing an intelligent and convenient method for luminescence based detection. Our work revealed that the employment of more rigid and conjugated groups as building units and the antenna effect of Ln3+ could enhance the visual detection of tetracycline antibiotics. This study provides an effective way to improve the detection capability of luminescent sensors and to expand their application in environmental protection.
Data availability
The data supporting this article have been included as part of the ESI.† CCDC 2363067 and 2363068 contain the supplementary crystallographic data for this paper. These data can be obtained free of charge viahttps://www.ccdc.cam.ac.uk/data_request/cif, or by emailing to data_request@ccdc.cam.acuk.
Conflicts of interest
The authors declare no competing financial interest.
Acknowledgements
We thank the financial support of the National Natural Science Foundation of China (no. 21571092 and 21771095) and the Natural Science Foundation of Shandong Province (ZR2021MB073, ZR2021MB097 and ZR2023MB002).
References
- F. Ahmadijokani, H. Molavi, S. Tajahmadi, M. Rezakazemi, M. Amini, M. Kamkar, O. J. Rojas and M. Arjmand, Coord. Chem. Rev., 2022, 464, 214562 CrossRef CAS.
- C. Yazhini, J. Rafi, P. Chakraborty, S. Kapse, R. Thapa and B. Neppolian, J. Cleaner Prod., 2022, 373, 133929 CrossRef CAS.
- X. Y. Zhai, Y. Kou, L. J. Liang, P. Y. Liang, P. R. Su and Y. Tang, Inorg. Chem., 2023, 62, 18533–18542 CrossRef CAS PubMed.
- J. Chen, F. H. Xu, Q. Zhang, S. Y. Li and X. Q. Lu, Analyst, 2021, 146, 6883 RSC.
- C. Y. Zhang, K. R. Lu, L. R. Li, W. Lei, M. Z. Xia and F. Y. Wang, Spectrochim. Acta, Part A, 2024, 304, 123379 CrossRef CAS PubMed.
- F. Wang, T. He, Y. N. Gao, Y. F. Li, S. H. Cui, H. Y. Huang and J. Yang, Sep. Purif. Technol., 2023, 325, 124596 CrossRef CAS.
- T. R. Katugampalage, P. Waribam, P. Opaprakasit, C. Kaewsaneha, S. H. Hsu, W. Chooaksorn, C. A. Jong, P. Sooksaen, C. Ratanatawanate and P. Sreearunothai, Chem. Eng. J., 2024, 479, 147592 CrossRef.
- L. R. Guidi, F. A. Santos, A. C. S. R. Ribeiro, C. Fernandes, L. H. M. Silva and M. B. A. Gloria, Food Chem., 2018, 245, 1232–1238 CrossRef CAS PubMed.
- Y. Yang, S. Yin, D. N. Yang, Y. Jiang, Y. X. Li, C. Zhou and C. J. Sun, Anal. Bioanal. Chem., 2019, 411, 507–515 CrossRef CAS PubMed.
- T. N. M. Pham, T. B. Le, D. D. Le, T. H. Ha, N. S. Nguyen, T. D. Pham, P. C. Hauser, T. A. H. Nguyen and T. D. Mai, J. Pharm. Biomed. Anal., 2020, 178, 112906 CrossRef CAS PubMed.
- W. Y. Li, Z. H. Liang, P. L. Wang and Q. Ma, Biosens. Bioelectron., 2024, 249, 116008 CrossRef CAS PubMed.
- J. Ni, S. W. Wang, P. P. Zhang, J. J. Zhang, H. Zhao, E. P. Tan, Z. Y. Li, J. Chen and C. K. Xia, Cryst. Growth Des., 2021, 21, 207–217 CrossRef CAS.
- B. H. Wang, X. Lian and B. Yan, Talanta, 2020, 214, 120856 CrossRef CAS PubMed.
- H. Y. Li, S. N. Zhao, S. Q. Zang and J. Li, Chem. Soc. Rev., 2020, 49, 6364 RSC.
- H. Lyu, O. I. F. Chen, N. Hanikel, M. I. Hossain, R. W. Flaig, X. K. Pei, A. Amin, M. D. Doherty, R. K. Impastato, T. G. Glover, D. R. Moore and O. M. Yaghi, J. Am. Chem. Soc., 2022, 144, 2387–2396 CrossRef CAS PubMed.
- X. R. Zhang, J. Maddock, T. M. Nenoff, M. A. Denecke, S. H. Yang and M. Schroder, Chem. Soc. Rev., 2022, 51, 3243 RSC.
- W. Gong, Y. Xie, T. D. Pham, S. Shetty, F. A. Son, K. B. Idrees, Z. J. Chen, H. M. Xie, Y. Liu, R. Q. Snurr, B. L. Chen, B. Alameddine, Y. Cui and O. K. Farha, J. Am. Chem. Soc., 2022, 144, 3737–3745 CrossRef CAS PubMed.
- J. C. Yang, M. K. Gao, S. N. Wang, M. K. Zhang, L. Chen, J. C. Su, Y. Huang, Y. Q. Zhang, X. Wang and B. X. Shen, ACS Appl. Mater. Interfaces, 2022, 14, 40052–40061 CrossRef CAS PubMed.
- G. Lee, D. K. Yoo, I. Ahmed, H. J. Lee and S. H. Jhung, Chem. Eng. J., 2023, 451, 138538 CrossRef CAS.
- S. C. Fan, S. Q. Chen, J. W. Wang, Y. P. Li, P. Zhang, Y. Wang, W. Y. Yuan and Q. G. Zhai, Inorg. Chem., 2022, 61, 14131–14139 CrossRef CAS PubMed.
- R. Z. Rao, S. T. Ma, B. Gao, F. K. Bi, Y. F. Chen, Y. Yang, N. Liu, M. H. Wu and X. D. Zhang, J. Colloid Interface Sci., 2023, 636, 55–72 CrossRef CAS PubMed.
- N. Li, X. P. Zhai, B. Ma, H. J. Zhang, M. J. Xiao, Q. Wang and H. L. Zhang, J. Mater. Chem. A, 2023, 11, 4020 RSC.
- C. Y. Tsai, Y. H. Chen, S. Lee, C. H. Lin, C. H. Chang, W. T. Dai and W. L. Liu, Inorg. Chem., 2022, 61, 2724–2732 CrossRef CAS PubMed.
- L. Ding, H. Q. Zou, J. Lu, H. T. Liu, S. N. Wang, H. Yan and Y. W. Li, Inorg. Chem., 2022, 61, 16185–16196 CrossRef CAS PubMed.
- R. Y. Li, H. T. Liu, C. C. Zhou, Z. T. Chu, J. Lu, S. N. Wang, J. Jin and W. F. Yan, Inorg. Chem. Front., 2020, 7, 1880 RSC.
- J. C. Jia, X. M. Li, H. Wu, Q. Huang and J. K. Gao, ACS Sustainable Chem. Eng., 2023, 11, 13502–13507 CrossRef CAS.
- M. Y. Li, L. Jia, X. Z. Chen, Y. X. Li, D. Zhao, L. N. Zhang, T. Q. Zhao and J. Xu, Sens. Actuators, B, 2024, 407, 135491 CrossRef CAS.
- J. Xu, B. B. Zhang, L. Jia, N. Bi and T. Q. Zhao, J. Hazard. Mater., 2020, 386, 121630 CrossRef CAS PubMed.
- L. X. Li, S. He, S. S. Zeng, W. T. Chen, J. W. Ye, H. L. Zhou and X. C. Huang, J. Mater. Chem. C, 2023, 11, 321 RSC.
- S. Wang, J. Xu, F. Z. Yue, L. N. Zhang, N. Bi, J. Gou, Y. X. Li, Y. Y. Huang, T. Q. Zhao and L. Jia, Food Chem., 2024, 451, 139410 CrossRef CAS PubMed.
- H. J. Li, Y. Q. Chen, H. Y. Zhao, H. Q. Zou, H. Yan, J. Lu, H. G. Hao, J. M. Dou, Y. W. Li and S. N. Wang, J. Mater. Chem. C, 2024, 12, 3141 RSC.
- H. Y. Zhao, H. J. Li, J. Zheng, H. Yan, J. Lu, H. T. Liu, H. G. Hao, J. M. Dou, Y. W. Li and S. N. Wang, Inorg. Chem., 2024, 63, 1962–1973 CrossRef CAS PubMed.
- Y. S. Shi, Y. H. Li, G. H. Cui and G. Y. Dong, CrystEngComm, 2020, 22, 905 RSC.
- A. Buragohain, M. Yousufuddin, M. Sarma and S. Biswas, Cryst. Growth Des., 2016, 16, 842–851 CrossRef CAS.
- X. Chen, B. B. Mendes, Y. H. Zhuang, J. Conniot, S. M. Argandona, F. Melle, D. P. Sousa, D. Perl, A. Chivu, H. K. Patra, W. Shepard, J. Conde and D. Fairen-Jimenez, J. Am. Chem. Soc., 2024, 146, 1644–1656 CrossRef CAS PubMed.
- D. Y. Fu, X. Liu, X. H. Zheng, M. J. Zhou, W. Q. Wang, G. X. Su, T. Q. Liu, L. Wang and Z. G. Xie, Coord. Chem. Rev., 2022, 456, 214393 CrossRef CAS.
- L. Gao, Y. X. Deng, H. L. Liu, K. Solomon, B. J. Zhang and H. M. Cai, Biosensors, 2022, 12, 745 CrossRef CAS PubMed.
- Z. J. Lin, H. Q. Zheng, H. Y. Zheng, L. P. Lin, Q. Xin and R. Cao, Inorg. Chem., 2017, 56, 14178–14188 CrossRef CAS PubMed.
- L. Ding, Y. Y. Zhao, H. H. Li, Q. J. Zhang, W. T. Yang, B. Fu and Q. H. Pan, J. Hazard. Mater., 2021, 416, 125759 CrossRef CAS PubMed.
- X. D. Zhang, Y. D. Zhang, J. Shi, X. M. Kang and Z. L. Liu, J. Mater. Chem. C, 2022, 10, 12821 RSC.
- L. Ding, Y. T. Cao, H. H. Li, F. X. Wang, D. Y. Guo, W. T. Yang and Q. H. Pan, Food Chem., 2022, 373, 131669 CrossRef CAS PubMed.
- A. Sun, Y. H. Yang, Y. F. Liu, L. Ding, P. Duan, W. T. Yang and Q. H. Pan, Cryst. Growth Des., 2021, 21, 4971–4978 CrossRef CAS.
- B. Fu, X. Y. Zheng, H. H. Li, L. Ding, F. X. Wang, D. Y. Guo, W. T. Yang and Q. H. Pan, Sens. Actuators, B, 2021, 346, 130502 CrossRef CAS.
- S. N. Li, T. Y. Liu and B. Yan, J. Colloid Interface Sci., 2022, 609, 482–490 CrossRef CAS PubMed.
- C. Xia, Y. Xu, M. M. Cao, Y. P. Liu, J. F. Xia, D. Y. Jiang, G. H. Zhou, R. J. Xie, D. F. Zhang and H. L. Li, Talanta, 2020, 212, 120795 CrossRef CAS PubMed.
- B. Mohan, S. Kumar, V. Kumar, T. H. Jiao, H. K. Sharma and Q. S. Chen, Trends Anal. Chem., 2022, 157, 116735 CrossRef CAS.
- T. C. Sun, R. Q. Fan, J. Zhang, M. Y. Qin, W. Chen, X. Jiang, K. Zhu, C. S. Ji, S. E. Hao and Y. L. Yang, ACS Appl. Mater. Interfaces, 2021, 13, 35689–35699 CrossRef CAS PubMed.
- Q. Liu, D. Ning, W. J. Li, X. M. Du, Q. Wang, Y. Li and W. J. Ruan, Analyst, 2019, 144, 1916 RSC.
- M. Y. Lei, F. Y. Ge, S. S. Ren, X. J. Gao and H. G. Zheng, Sep. Purif. Technol., 2022, 286, 120433 CrossRef CAS.
- G. M. Wu, M. Y. Zhang, F. D. Wang, C. X. Zhang and Q. L. Wang, Dalton Trans., 2022, 51, 6687 RSC.
- B. Y. Yu, Z. P. Wang, H. Y. Ding, F. F. Miao, A. Z. Yang, W. T. Zhao, Y. Jia and H. Q. Zhao, J. Mol. Struct., 2023, 1291, 135891 CrossRef CAS.
- G. X. Xian, L. Y. Wang, X. Y. Wan, H. Yan, J. W. Cheng, Y. Q. Chen, J. Lu, Y. W. Li, D. C. Li, J. M. Dou and S. N. Wang, Inorg. Chem., 2022, 61, 7238–7250 CrossRef CAS PubMed.
- J. W. Cheng, N. N. Liu, L. Y. Wang, H. W. Wang, J. Lu, Y. W. Li, J. M. Dou and S. N. Wang, Inorg. Chem., 2023, 62, 3573–3584 CrossRef CAS PubMed.
- L. Y. Wang, T. T. Liu, J. W. Cheng, H. Q. Zou, J. Lu, H. T. Liu, Y. W. Li, J. M. Dou and S. N. Wang, J. Mol. Struct., 2024, 1296, 136815 CrossRef CAS.
- A. L. Spek, J. Appl. Cryst., 2003, 36, 7–13 CrossRef CAS.
- X. Z. Chen, J. Xu, S. Gong, L. N. Zhang, N. Bi, J. Gou, Y. X. Li, T. Q. Zhao and L. Jia, Sep. Purif. Technol., 2025, 352, 128258 CrossRef CAS.
- J. Xu, R. Li, X. Z. Chen, L. N. Zhang, Y. X. Li, Y. Y. Huang, T. Q. Zhao and L. Jia, Appl. Surf. Sci., 2024, 653, 159436 CrossRef CAS.
- J. Xu, S. L. Guo, L. Jia, T. H. Zhu, X. Z. Chen and T. Q. Zhao, Chem. Eng. J., 2021, 416, 127741 CrossRef CAS.
- H. H. Wang, Y. Zhang, D. B. Yang, L. Hou, Z. Y. Li and Y. Y. Wang, Cryst. Growth Des., 2021, 21, 2488–2497 CrossRef CAS.
- L. S. Cui, B. Zhu, K. R. Huang, Y. L. Gan, Y. C. Li and J. Q. Long, J. Solid State Chem., 2020, 290, 121526 CrossRef CAS.
- K. Y. Yi and L. Zhang, Food Chem., 2021, 354, 129584 CrossRef CAS PubMed.
- X. L. Yu, A. A. Ryadun, D. I. Pavlov, T. Y. Guselnikova, A. S. Potapov and V. P. Fedin, Angew. Chem., Int. Ed., 2023, 62, e202306680 CrossRef CAS PubMed.
- L. Y. Wang, X. Sun, J. W. Cheng, J. Lu, H. Q. Tian, Y. W. Li, J. M. Dou and S. N. Wang, J. Mater. Chem. C, 2023, 11, 1812 RSC.
- A. Eskemech, D. Gambhir, H. Kaur, A. Karmakar and R. R. Koner, Dalton Trans., 2023, 52, 8275 RSC.
- L. B. Wang, J. J. Wang, E. L. Yue, L. Tang, X. Wang, X. Y. Hou, Y. Q. Zhang, Y. X. Ren and X. L. Chen, Spectrochim. Acta, Part A, 2022, 265, 120340 CrossRef CAS PubMed.
- Y. Q. Sun, Y. Cheng and X. B. Yin, Anal. Chem., 2021, 93, 3559–3566 CrossRef CAS PubMed.
- B. H. Wang and B. Yan, Talanta, 2020, 208, 120438 CrossRef CAS PubMed.
|
| This journal is © The Royal Society of Chemistry 2024 |
Click here to see how this site uses Cookies. View our privacy policy here. 
 a,
Jingjing
Jiang
b,
Yunwu
Li
a,
Jingjing
Jiang
b,
Yunwu
Li