 Open Access Article
Creative Commons Attribution 3.0 Unported Licence
A novel CuFe2O4 ink for the fabrication of low-temperature ceramic fuel cell cathodes through inkjet printing
Sanaz
Zarabi Golkhatmi
 a,
Peter D.
Lund
a and
Muhammad Imran
Asghar
 *ab
*ab
aNew Energy Technologies Group, Department of Applied Physics, Aalto University School of Science, P. O. Box 15100, FI-00076 Aalto, Finland. E-mail: imran.asghar@aalto.fi
bRenewable Energy Technologies Group, Faculty of Engineering and Natural Sciences, Tampere University, FI-33014, Finland
First published on 2nd October 2023
Abstract
Inkjet printing is a mask-free, contactless, and precise thin film and coating fabrication technique, which can tailor the electrode microstructure of solid oxide fuel cells to provide a larger surface area with more reaction sites. For the first time, printable and functional CuFe2O4 inks were developed by analyzing particle size, viscosity, surface tension, density, and thermal properties. Two inks, named Ink (1) and Ink (2), were formulated with different compositions. Ink (2), containing 20 wt% 1,5-pentandiol, exhibited smaller particle sizes (0.87 μm) and a lower activation loss compared to Ink (1). For further optimization, NLK–GDC porous electrolyte substrates were inkjet printed with 30, 40, 50, 100 and 200 layers of Ink (2), with estimated thicknesses of 4.2, 5.6, 7, 14, and 28 μm. The best performance was achieved with a 100-layer inkjet-printed symmetric cell, exhibiting an ASR of 9.91 Ω cm2. To enhance the rheological properties of Ink (2), cyclopentanone was added, resulting in Ink (2) – Samba, which had improved characteristics. Ink (2) – Samba possessed an average particle size (D50) of 0.68 μm and a Z number of 3.89. Finally, EIS analysis compared a 100-layer inkjet-printed symmetric cell with Ink (2) – Samba to a drop-cast cell with the same ink to evaluate how the fabrication technique influences cell performance. Inkjet printing demonstrated a hierarchical porous microstructure, increased reaction sites, and reduced ASR from 19.59 Ω cm2 to 5.99 Ω cm2. Additionally, SEM images confirmed that inkjet printing reduced the particle size distribution during deposition. These findings highlight the significant impact of manufacturing techniques on electrode quality and fuel cell electrochemical performance.
Introduction
Commercialization of solid oxide fuel cell (SOFC) technology often suffers from the high operating temperature (750–1000 °C) necessary to maintain a high enough ionic conductivity to ensure satisfactory performance, which causes material degradation, higher costs, and constraints in materials selection.1 One way to reduce the operating temperature without sacrificing performance is to develop high-performance materials with engineered microstructures for electrodes, particularly for cathodes, as the oxygen reduction reactions (ORRs) dominate the activation loss in SOFC.2 Recently, spinel ferrites have gained a lot of interest for different electrochemical devices due to their superparamagnetic characteristics, excellent thermal and chemical stability, and chemical composition.3 Spinel ferrites with the composition of MFe2O4 (M: Mn, Co, Cu, Ni, Mg, etc. in octahedral sites) have demonstrated a higher catalytic activity than single-component metal oxides.4 Furthermore, these spinel oxides have a suitable thermal expansion coefficient (TEC) with the other components, unlike other perovskite materials for SOFC cathodes such as LSCF.5 Copper ferrite (CuFe2O4) is a prominent spinel ferrite due to its electrical conductivity and high electrochemical activity.6 CuFe2O4 has been used in many applications, including wastewater treatment,7,8 sensors,9–11 Li-ion batteries,12,13 supercapacitors,14–16 SOFCs,17–19 and photocatalysts,20–22 showing positive effects in surface reactions. Inkjet printing, which is an additive manufacturing technique, can tailor the CuFe2O4 microstructure.23 It is an efficient, mask-free, contactless, and precise fabrication method for thin films and coating preparation also producing less by-products and waste.24,25 The formation of single droplets released from a nozzle makes inkjet printing a precise and reproducible film preparation method.26 Solid oxide fuel cells (SOFCs),27–30 batteries,31–33 supercapacitors,34–36 solar cells,37–39 and sensors40–42 have recently benefited from this deposition technique using colloidal suspensions as inks on different substrates by obtaining high-precision and uniform electrode layers with a higher specific surface area.28 Inkjet printing could maximize the CuFe2O4 potential in surface reactions by depositing a porous and highly structured thin film and providing more active sites for CuFe2O4 particles.43 However, CuFe2O4 ink development for inkjet printing techniques has not yet been reported. Here we develop three CuFe2O4 inks with different dispersant wt% to work as functional ink in inkjet-printing applications. We studied their particle size distribution, rheological properties, and optimized the printing conditions by adjusting the number of printed layers for SOFC. Finally, the effect of the fabrication technique on SOFC performance was investigated by comparing drop-cast and inkjet-printed CuFe2O4 symmetric cells via electrochemical impedance spectroscopy, Brunauer–Emmett–Teller (BET) analysis, and electron microscopy analysis to determine the impact of inkjet-printing on the microstructural development of the CuFe2O4 ink. A full fuel cell is also demonstrated for anode-supported 100-layer inkjet-printed and drop-casted complete cells. Current–voltage measurements were carried out to illustrate the functionality of a complete fuel cell consisting of 100-layer inkjet-printed and drop-cast anode-supported cells with Ink (2) – Samba.Experimental
Cathode inks
![[thin space (1/6-em)]](https://www.rsc.org/images/entities/char_2009.gif) :
:![[thin space (1/6-em)]](https://www.rsc.org/images/entities/char_2009.gif) 1 (Ink (2): Cyclopentanone), and named Ink (2) – Samba.
1 (Ink (2): Cyclopentanone), and named Ink (2) – Samba.
The printability of Ink (1) and Ink (2) was determined by calculating their Reynolds (Re), Weber (We), Ohnesorge (Oh), and Fromm (Z) numbers, then combined in a graphical map by Derby,44 as given below:45
 | (1) |
 | (2) |
 | (3) |
To study the sintering behavior of Ink (1) and Ink (2), thermal examination (TGA/DSC) was performed up to 650 °C at a heating rate of 5 °C min−1 under an air atmosphere using a NEXTA STA thermal analyzer (Hitachi, Japan).
Electrolyte substrates
![[thin space (1/6-em)]](https://www.rsc.org/images/entities/char_2009.gif) :
:![[thin space (1/6-em)]](https://www.rsc.org/images/entities/char_2009.gif) Na
Na![[thin space (1/6-em)]](https://www.rsc.org/images/entities/char_2009.gif) :
:![[thin space (1/6-em)]](https://www.rsc.org/images/entities/char_2009.gif) K = 32.1
K = 32.1![[thin space (1/6-em)]](https://www.rsc.org/images/entities/char_2009.gif) :
:![[thin space (1/6-em)]](https://www.rsc.org/images/entities/char_2009.gif) 33.4
33.4![[thin space (1/6-em)]](https://www.rsc.org/images/entities/char_2009.gif) :
:![[thin space (1/6-em)]](https://www.rsc.org/images/entities/char_2009.gif) 34.5, were used for the carbonate composition. Then, the eutectic carbonate composition and GDC (WuXi Kai-star Electro-optic Materials Co., China) powders with a 30
34.5, were used for the carbonate composition. Then, the eutectic carbonate composition and GDC (WuXi Kai-star Electro-optic Materials Co., China) powders with a 30![[thin space (1/6-em)]](https://www.rsc.org/images/entities/char_2009.gif) :
:![[thin space (1/6-em)]](https://www.rsc.org/images/entities/char_2009.gif) 70 wt% ratio were ball-milled together for 24 h at 300 rpm with zirconia beads. The NLK–GDC nanocomposite powder for the porous layer was formulated with the as-prepared NLK–GDC nanocomposite powder, and 25 wt% EC was added to the mixture, followed by grinding.
70 wt% ratio were ball-milled together for 24 h at 300 rpm with zirconia beads. The NLK–GDC nanocomposite powder for the porous layer was formulated with the as-prepared NLK–GDC nanocomposite powder, and 25 wt% EC was added to the mixture, followed by grinding.
Anode-supported substrates
![[thin space (1/6-em)]](https://www.rsc.org/images/entities/char_2009.gif) :
:![[thin space (1/6-em)]](https://www.rsc.org/images/entities/char_2009.gif) GDC = 60
GDC = 60![[thin space (1/6-em)]](https://www.rsc.org/images/entities/char_2009.gif) :
:![[thin space (1/6-em)]](https://www.rsc.org/images/entities/char_2009.gif) 40 to make NiO-GDC. Then, EC (Sigma-Aldrich, Germany) was added to the NiO-GDC mixture in a weight ratio of NiO-GDC
40 to make NiO-GDC. Then, EC (Sigma-Aldrich, Germany) was added to the NiO-GDC mixture in a weight ratio of NiO-GDC![[thin space (1/6-em)]](https://www.rsc.org/images/entities/char_2009.gif) :
:![[thin space (1/6-em)]](https://www.rsc.org/images/entities/char_2009.gif) EC = 90
EC = 90![[thin space (1/6-em)]](https://www.rsc.org/images/entities/char_2009.gif) :
:![[thin space (1/6-em)]](https://www.rsc.org/images/entities/char_2009.gif) 10. The final composition was ball-milled for 1 h at 300 rpm with zirconia beads.
10. The final composition was ball-milled for 1 h at 300 rpm with zirconia beads.
Fabrication and characterization of symmetric and full fuel cells
Considering the substrate's thickness, the presence of a porous structure poses challenges in accurately determining the thickness of the ink layer that has been applied. Furthermore, measuring the thickness of the drop-cast cell is a significant challenge due to the non-uniform characteristics of the deposited layer, hence adding complexity to the direct measurement techniques. However, it is possible to approximate the thickness by considering the surface area of the substrate and the density of the ink as below:
 | (4) |
Current–voltage (I–V) measurements were conducted using the same equipment over a potential range of −1.2 to 1.2 V under open circuit voltage (OCV) conditions and a 20 mV AC amplitude. The temperature range of the measurements was 500–650 °C with 50 °C intervals. The provided gas atmospheres for the anode and cathode were H2 in the inner chamber with a flow rate of 5 l min−1, and air in the outer chamber with a flow rate of 12.5 l min−1, respectively. The effective surface area of the cell was 0.5 cm2. Samples were sealed using Ceramabond 552 (Aremco, USA) to avoid gas mixture between the chambers of the Probostat.
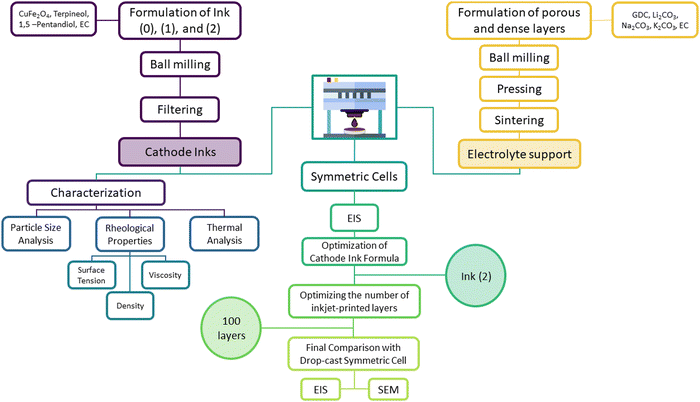
The flowchart in Fig. 1 depicts the experimental steps for fabricating, characterizing, and optimizing an inkjet-printed CuFe2O4 symmetric cell.
Result and discussion
Inks properties
 | (5) |
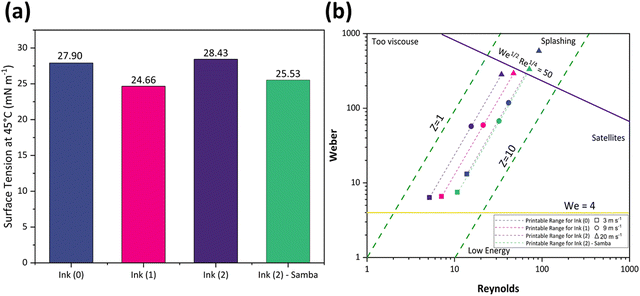
Also, the ink's surface tension must be regulated to guarantee the ink wets the channel and ejects from the nozzle.64 Furthermore, controlled surface tension can prevent the ink from leaking from the nozzle during the no-jetting phase.64Fig. 3(a) represents the surface tension values at 45 °C as 27.9, 24.66, 28.43, and 25.53 mN m−1 for Ink (0), Ink (1), Ink (2), and Ink (2) – Samba, respectively. These values show that adding 15 wt% 1,5-pentandiol to Ink (0) leads to a decrement in the surface tension due to its lower surface tension value compared to Terpineol. However, adding 20 wt% results in an increase due to the higher attractive intermolecular forces between the solute and the solvent.56 Also, the ink surface tension is decreased when cyclopentanone is added because of its lower surface tension compared to Terpineol and 1,5-pentandiol.
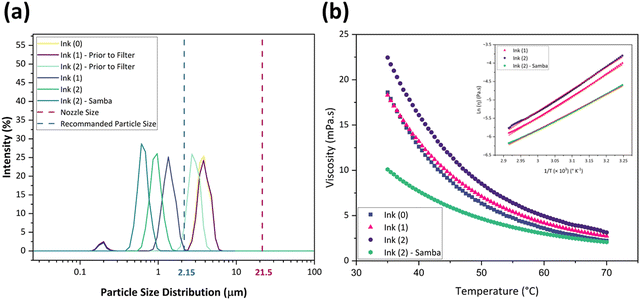
The rheological specification of a printable ink is determined by the dimensionless numbers in fluid mechanics, including We, Re, Oh, and Fromm numbers. The optimal range of these characteristics has been identified through various research studies. As an example, Fromm65 proposed Z > 2 for consistent drop formation, while Derby66 determined 1 < Z < 10. Considering the rheological requirements for printable ink, Derby created a cartesian map based on Re and We dimensionless numbers to specify the ink characteristics in DoD inkjet systems.44Fig. 3(b) depicts the Derby diagram for all the inks with a drop velocity range of 3–20 m s−1. It is worth mentioning that Ink (0) is theoretically printable. However, due to the large particle size and heavy sedimentation, it wasn’t used for inkjet printing to avoid nozzle clogging. It can be concluded that particle size distribution is as important as the rheological properties to ensure a good-quality inkjet printing process. Ink properties for all the inks are described in Table 1.
| Inks | Particle size and rheological properties at 45 °C | ||||||||
|---|---|---|---|---|---|---|---|---|---|
| Average particle size (μm) | Viscosity (mPa s) | Surface tension (mN m−1) | Density (g cm−3) | Oh | Z | Drop velocity (m s−1) | We | Re | |
| Ink (0) | 3.59 | 8.89 | 27.90 | 1.90 | 0.26 | 3.80 | 9 | 118.59 | 41.44 |
| Ink (1) | 1.26 | 9.58 | 24.66 | 0.938 | 0.42 | 2.32 | 9 | 66.27 | 18.95 |
| Ink (2) | 0.87 | 11.7 | 28.43 | 0.936 | 0.48 | 2.04 | 9 | 57.34 | 15.48 |
| Ink (2) – Samba | 0.68 | 5.95 | 25.53 | 0.99 | 0.25 | 3.89 | 9 | 67.53 | 32.19 |
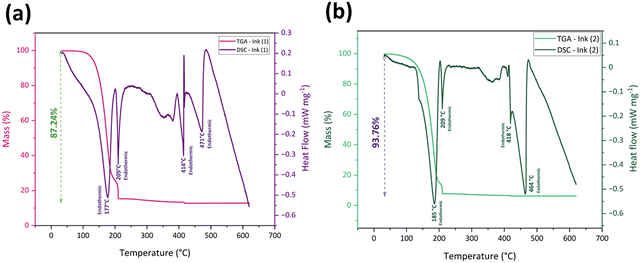
Thermal analysis TGA and DSC analyses were performed for Ink (1) and Ink (2) in the air to study their sintering behavior and the thermal decomposition of solvent remnants and organic components. As the cyclopentanone evaporates at 130 °C and the samples go through a drying step at 130 °C for 1 h, the as-dried Ink (2) – Samba will follow the Ink (2) thermal profile.60Fig. 4(a) and (b) exhibit the thermal analysis curves for Ink (1) and Ink (2), respectively. According to TGA curves, there were no weight changes under 100 °C, indicating that the inks’ organic medium preserves its weight at room temperature, which is considered a beneficial behavior for long-term storage and stability of the ink.67 The first and most significant weight loss happened at 100–200 °C, accompanied by endothermic peaks at 177 °C and 185 °C for Ink (1) and Ink (2), respectively. This weight loss is attributable to the degradation of the major amount of organic substances and water evaporation.68,69 The second weight loss for Ink (1) occurred at 185–210 °C with an endothermic peak at 209 °C, and for Ink (2) happened at 195–210 °C with the same endothermic peak temperature as Ink (1). The thermal breakdown of the residual organic components, organic solvent volatilization, and EC melting all contribute to these endothermic peaks.30,70,71 After raising the temperature to 400 °C, the remaining organic material was burnt away, and a third endothermic reaction occurred at 414 and 418 °C for Ink (1) and Ink (2), respectively.30,72 At temperatures over 400 °C, the masses of the inks remained constant. However, there was a fourth endothermic reaction, at 471 °C for Ink (1) and 464 °C for Ink (2), resulting from the CuFe2O4 phase transition from tetragonal to cubic phase.73 The total mass loss for Ink (1) was 87.24%, which is lower than that of Ink (2) (93.76%), as Ink (1) had a lower amount of organic substances.
Electrochemical characterization
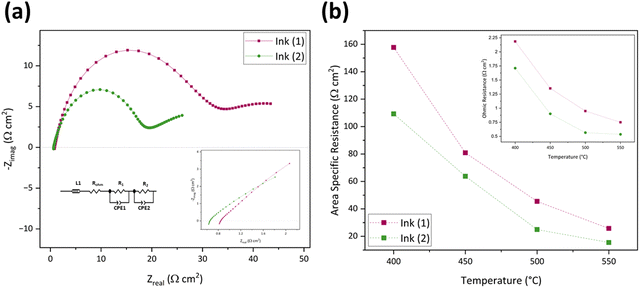
The inset of Fig. 5(a) shows an enlarged image of the higher-frequency region (1.07–100 kHz) to provide a better picture of ROhm comparison. The ohmic resistance for the inkjet-printed cell with Ink (1) at 550 °C is 0.86 Ω cm2, which is 36.38% higher than that of Ink (2) (0.53 Ω cm2). This difference in ROhm can be attributed to different particle size distributions in Ink (1) and Ink (2). Ink (1) had a larger D50 with a secondary peak, which can cause poor dispersion of cathode active material in ink and affect the electrode/electrolyte interface due to the particle agglomeration and non-uniform structure and not providing good contact with the electrolyte.79 In the case of the electrode process, Ink (2) possesses a lower R1 compared to Ink (1) due to the better oxygen transport at the electrode/electrolyte interface. This enhancement arises from the narrow particle size distribution and smaller particle size compared to Ink (1), leading to a more homogenous microstructure with a higher specific surface area.79,80 Also, R2 is different in these two inks, as the particle size distribution impacts the gas diffusion properties of the electrode. Larger particles and secondary peaks of Ink (1) can cause agglomeration, block the active sites, and reduce the lengths of triple phase boundaries (TBPs). On the other hand, Ink (2)'s cell performance is better due to its more porous microstructure and increased TBP lengths.74,80Fig. 5(b) and its inset exhibit a comparison of area-specific resistance (ASR),81 which is calculated by eqn (6), and the ROhm of inkjet-printed cells with Ink (1) and Ink (2) from 400–550 °C.
 | (6) |
| Temperature (°C) | Ink (1) inkjet-printed cells (Ω cm2) | Ink (2) inkjet-printed cells (Ω cm2) | ||||||
|---|---|---|---|---|---|---|---|---|
| R Ohm | R 1 | R 2 | ASR | R Ohm | R 1 | R 2 | ASR | |
| 400 | 2.58 | 235.77 | 145.45 | 187.97 | 1.68 | 114.69 | 107.32 | 109.85 |
| 450 | 1.60 | 111.04 | 73.44 | 90.60 | 0.86 | 67.58 | 61.81 | 63.77 |
| 500 | 1.11 | 59.27 | 51.45 | 54.19 | 0.53 | 27.61 | 23.39 | 24.90 |
| 550 | 0.86 | 31.32 | 31.83 | 30.68 | 0.53 | 17.53 | 14.50 | 15.48 |
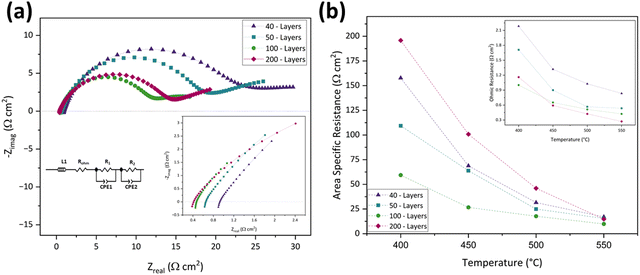
According to the plots, the ASR decreased by increasing the number of printed layers, achieving the lowest value in the 100-layer inkjet-printed symmetric cell (9.91 Ω cm2), and began to increase after that. This decrement until reaching 100 layers and then increasing behavior of Rp is attributable to the electrode layer's thickness and CuFe2O4 content.82 In the 30-layer design, the electrode active material was insufficient and could not provide enough active sites for oxygen reduction. By increasing the number of inkjet-printed layers to 40 and 50, Rp decreased as the CuFe2O4 content and thickness increased by bringing more active areas for the electrode reactions. In the 100-layer case, Rp reached its optimum value as the electrode layer was thin enough to access and react with the electrolyte yet thick enough to offer adequate active sites for the reaction.83 However, in the 200-layer case, the electrode layer was too high and became less porous, inhibiting the oxygen transfer and causing Rp increment.83
On the other hand, there is a different trend in ROhm. ROhm is inversely proportional to the number of inkjet-printed layers. This means that the 200-layer inkjet printed symmetric cell has the lowest ROhm, and the 40-layer one has the highest. The decreasing ROhm may be ascribed to the improved electrolyte/electrode interface due to the presence of more active material and better packing.84Fig. 6(b) and its inset illustrate the comparison of ASR and ROhm in 40-, 50-, 100-, and 200-layer inkjet printed symmetric cells in the 400–550 °C temperature range. Overall, the 100-layer inkjet-printed symmetric cell was chosen as the optimized cell due to its lowest ASR and reasonable ROhm. Table 3 presents the ROhm, R1, R2, and ASR of the 40-, 50-, 100-, and 200-layer inkjet-printed cells from 400–550 °C.
| Cells | Resistance (Ω cm2) | Temperature (°C) | |||
|---|---|---|---|---|---|
| 400 | 450 | 500 | 550 | ||
| 40-Layers | R Ohm | 2.17 | 1.31 | 1.02 | 0.82 |
| R 1 | 197.80 | 74.47 | 37.52 | 19.09 | |
| R 2 | 122.02 | 65.70 | 27.65 | 16.63 | |
| ASR | 157.70 | 68.73 | 31.54 | 17.04 | |
| 50-Layers | R Ohm | 1.68 | 0.86 | 0.53 | 0.53 |
| R 1 | 114.69 | 67.58 | 27.62 | 17.53 | |
| R 2 | 107.32 | 61.81 | 23.39 | 14.50 | |
| ASR | 109.28 | 63.77 | 24.90 | 15.48 | |
| 100-Layers | R Ohm | 0.98 | 0.61 | 0.49 | 0.41 |
| R 1 | 62.59 | 29.41 | 19.09 | 10.32 | |
| R 2 | 58.20 | 25.31 | 17.37 | 10.32 | |
| ASR | 59.39 | 26.71 | 17.69 | 9.91 | |
| 200-Layers | R Ohm | 1.15 | 0.57 | 0.41 | 0.25 |
| R 1 | 212.38 | 131.03 | 19.87 | 17.74 | |
| R 2 | 181.49 | 71.76 | 31.99 | 12.49 | |
| ASR | 195.75 | 100.80 | 45.96 | 14.83 | |
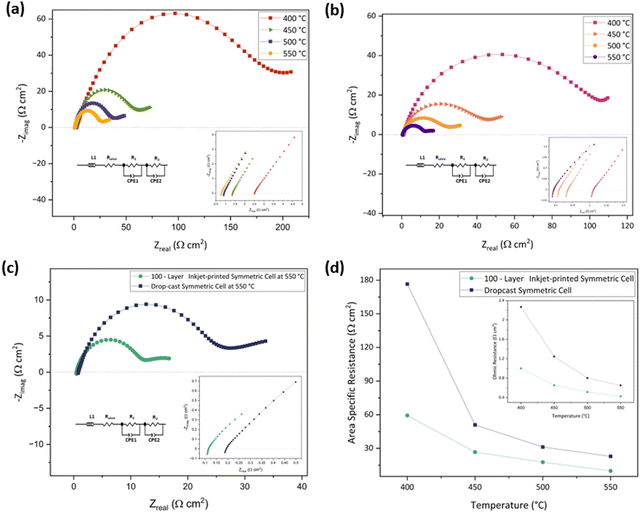
The electrode fabrication technique can also impact the ROhm as the charge transfers between the electrode and the electrolyte and, inversely, may be facilitated by a porous microstructure.27,87,88 This is why the drop-cast symmetric cell has a 1.5 times higher ROhm (0.61 Ω cm2) than the 100-layer inkjet-printed sample (0.41 Ω cm2) at 550 °C. A comparison of the ASR and ROhm of the drop-cast and 100-layer inkjet printed porous symmetric cells at 400–550 °C under an air atmosphere is given in Fig. 7(d) and its inset, respectively. The ROhm, R1, R2, and ASR of the drop-cast and 100-layer inkjet-printed samples are outlined in Table 4.
| Temperature (°C) | Drop-cast cell (Ω cm2) | 100-layer inkjet-printed cell (Ω cm2) | ||||||
|---|---|---|---|---|---|---|---|---|
| R Ohm | R 1 | R 2 | ASR | R Ohm | R 1 | R 2 | ASR | |
| 400 | 2.25 | 194.60 | 163.02 | 176.54 | 0.98 | 62.59 | 58.20 | 59.39 |
| 450 | 1.23 | 56.57 | 47.88 | 50.95 | 0.61 | 29.41 | 25.31 | 26.71 |
| 500 | 0.78 | 34.20 | 29.86 | 31.21 | 0.49 | 19.09 | 17.37 | 17.69 |
| 550 | 0.61 | 25.89 | 21.18 | 22.90 | 0.41 | 10.32 | 10.32 | 9.91 |
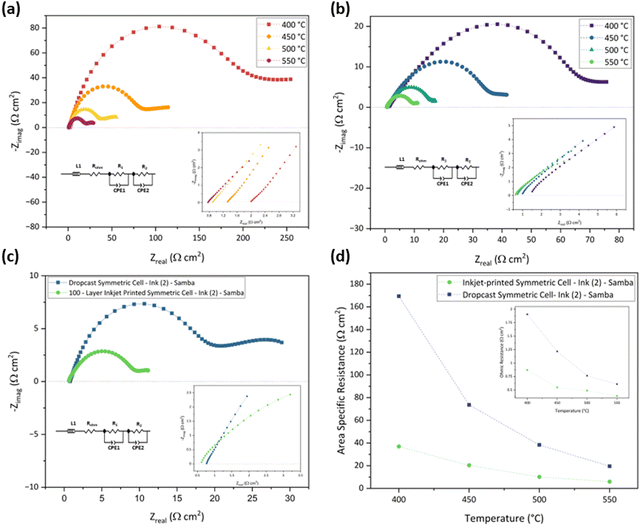
In addition, the Samba cartridge has a higher drop placement accuracy, providing a more homogenous coating compared to the DMP cartridge.89 The lower ROhm of Ink (2) – Samba can be attributable to the smaller particle size distribution which improved the electrode/electrolyte interface.79
Table 5 presents the ROhm, R1, R2, and ASR values of the drop-cast and 100-layer inkjet-printed samples with Ink (2) – Samba.
| Temperature (°C) | Drop-cast cell (Ω cm2) | 100-layer inkjet-printed cell (Ω cm2) | ||||||
|---|---|---|---|---|---|---|---|---|
| R Ohm | R 1 | R 2 | ASR | R Ohm | R 1 | R 2 | ASR | |
| 400 | 1.90 | 174.00 | 168.60 | 169.39 | 0.87 | 48.96 | 26.78 | 37.00 |
| 450 | 1.21 | 80.55 | 69.15 | 73.63 | 0.55 | 23.21 | 18.74 | 20.42 |
| 500 | 0.76 | 48.01 | 30.19 | 38.33 | 0.49 | 12.72 | 8.53 | 10.13 |
| 550 | 0.60 | 25.15 | 15.25 | 19.59 | 0.39 | 7.37 | 5.39 | 5.99 |
| Temperature (°C) | PPD (mW cm−2) | OCV (V) | ||
|---|---|---|---|---|
| 100-Layer inkjet-printed | Drop-cast | 100-Layer inkjet-printed | Drop-cast | |
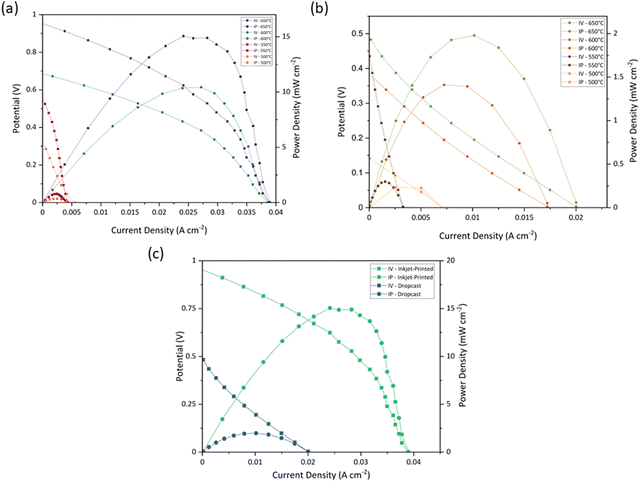
| 500 | 0.35 | 0.23 | 0.32 | 0.14 |
| 550 | 0.79 | 0.29 | 0.54 | 0.43 |
| 600 | 10.43 | 1.41 | 0.68 | 0.38 |
| 650 | 15.06 | 1.97 | 0.95 | 0.48 |
Microstructural characterization
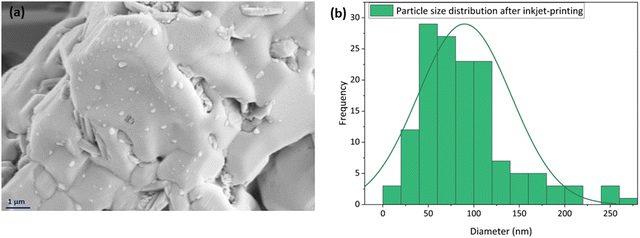
A high-magnification SEM image of the inkjet printed sample is shown in Fig. 11(a) to provide a better picture of this homogenous spread of the nanoparticles on the surface. The particle size distribution of this image is also studied by ImageJ software, displayed in Fig. 11(b), and it was 57 nm in diameter.
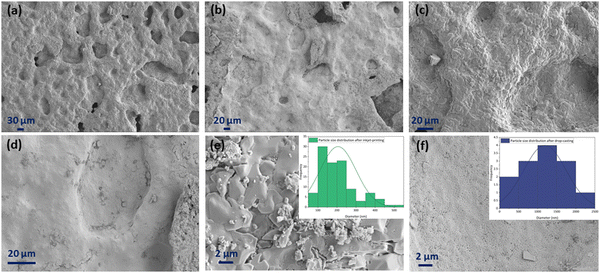
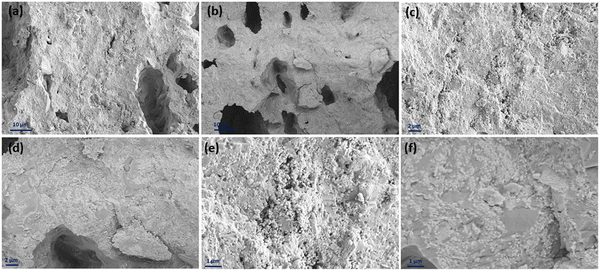
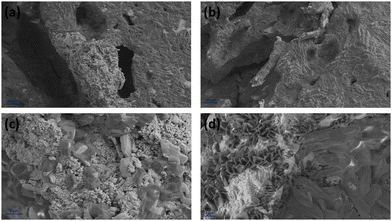
Fig. 12 displays the cross-sectional view in the interface area of the inkjet-printed and drop-cast samples in (a), (c), (e) and (b), (d), (f) with different magnifications, respectively. The electrode/electrolyte interface is crucial to SOFC performance as it affects electrode and electrolyte contact and increases active reaction sites, and therefore its research is essential.99–101 From Fig. 12, especially in the higher magnification images of Fig. 12(c) and (e), it can be seen that the inkjet-printed sample electrode/electrolyte interface is fully covered with the CuFe2O4 nanoparticles, showing favorable ink infiltration to the substrate's porous layer. However, the interface area for the drop-cast sample is more like scattered islands of the agglomerated CuFe2O4 nanoparticles. These observations align with the enhanced electrochemical performance of the inkjet-printed samples because of the electrode/electrolyte interface improvement by emerging CuFe2O4 nanoparticles and providing more triple-phase boundaries.30,102 The electrode/electrolyte interface behavior happened for the symmetric cells coated with Ink (2) – Samba. The interface area is shown in Fig. 13(a), (c), (b) and (d) for the inkjet-printed and drop-cast porous NLK–GDC symmetric cells by Ink (2) – Samba, respectively. Comparing the lower magnification SEM images in Fig. 13(a) and (b), it is clear that the inkjet-printing technique was more successful in spreading the CuFe2O4 nanoparticles along the interfacial area as there are only some scattered particles in the drop-cast one. Fig. 13(c) exhibits effective ink penetration through the porous layer, while the drop-cast cells in Fig. 13(d) have aggregated islands of CuFe2O4 nanoparticles.
| Samples | Specific surface area (m2 g−1) | Mean pore diameter (nm) |
|---|---|---|
| 100-Layer inkjet-printed | 2.25 | 19.12 |
| Drop-cast | 1.84 | 22.51 |
Conclusion
CuFe2O4 ink for inkjet-printing fabrication techniques was developed for the first time by optimizing the 1,5-pentandiol wt% as the dispersant. Three inks with 0, 15, and 20 wt% 1,5-pentandiol were prepared, and their particle size, viscosity, surface tension, and density were studied to determine the best ink for inkjet printing. Although all three inks were theoretically printable according to their Z values, Ink (1) and Ink (2) were selected because of their smaller particle sizes (D50 of 1.26, and 0.87 μm, respectively) and higher stability. To choose the best ink for SOFC application, porous NLK–GDC pellets were inkjet printed with 50 layers of Ink (1) and Ink (2) to fabricate symmetric cells for EIS analysis at 400–550 °C and under an air atmosphere. Inkjet-printed cells with Ink (2) performed better by showing 1.7 and 2 times lower ROhm and ASR than Ink (1) cells, as Ink (2) had a smaller particle size, which created a more homogeneous porous microstructure and enhanced the gas transfers. Then, Ink (2) was picked to optimize the inkjet-printing conditions by changing the number of inkjet-printed layers. Porous NLK–GDC were inkjet-printed by 30, 40, 50, 100, and 200 layers of Ink (2). Among them, the 100-layer inkjet-printed symmetric cell had the best performance with an ASR of 9.91 Ω cm2 because the electrode layer was thin enough to access and react with the electrolyte yet thick enough to supply appropriate active sites for the reaction. Then, the 100-layer inkjet-printed symmetric cell with Ink (2) was compared with a drop-cast symmetric cell with the same ink using an EIS technique to study the effect of the fabrication technique on the cell performance. The inkjet printing technique lowered the ASR from 22.90 to 9.91 Ω cm2 by creating a hierarchical porous microstructure and optimizing the reaction sites. Next, Ink (2) was modified for the Samba cartridge by regulating its viscosity with cyclopentanone, and the same procedure was done for the Ink (2) – Samba. The values of D50 and Z parameter for the modified ink were 0.68 μm and 3.89, respectively. The electrochemical performance comparison of the drop-cast and 100-layer inkjet-printed symmetric cells with Ink (2) – Samba showed a reduction in the ASR value from 19.59 to 5.99 Ω cm2 owing to the surface modification by the inkjet-printing technique which has direct effects on the cathode ORR. Finally, Ink (2) – Samba was used to fabricate anode-supported full fuel cells by inkjet-printing and drop-cast techniques. The 100-layer inkjet-printed sample presented 15.06 mW cm−2, which is 7 times higher than that of the drop-cast one, 1.97 mW cm−2. These findings imply that the manufacturing process can considerably impact the quality of an electrode and its electrochemical performance in a fuel cell. For manufacturing sophisticated low-temperature ceramic fuel cells, inkjet printing, which can provide a better electrolyte/electrode interface and triple-phase boundary length, has the potential to surpass current fuel cell fabrication technologies.Author contributions
Sanaz Zarabi Golkhatmi: conceptualization, methodology, investigation, formal analysis, validation, visualization, writing – original draft, revision. Muhammad Imran Asghar: conceptualization, methodology, investigation, formal analysis, validation, visualization, editing – original draft, revision, funding, supervision. Peter D. Lund: editing – original draft, supervision.Conflicts of interest
There are no conflicts to declare.Acknowledgements
The authors thank Academy of Finland (Grant No. 13329016, 13322738, 13352669) for their financial support. The Academy of Finland's RawMatTERS Finland Infrastructure (RAMI) at Aalto University was utilized in this research.References
- J. Li, L. Fan, N. Hou, Y. Zhao and Y. Li, RSC Adv., 2022, 12, 13220–13227 RSC.
- S. Hu, J. Li, Y. Zeng, J. Pu and B. Chi, Phys. Chem. Chem. Phys., 2023, 25, 5926–5941 RSC.
- S. Sharma, P. Jakhar and H. Sharma, J. Chin. Chem. Soc., 2023, 70(2), 107 CrossRef.
- A. Maleki, Z. Hajizadeh and P. Salehi, Sci. Rep., 2019, 9, 1–8 CrossRef.
- C. Liu, B. Ma, Z. Lin, Y. Zhou and K. Wu, Mater. Lett., 2022, 325, 132860 CrossRef.
- A. K. Ghasemi, M. Ghorbani, M. S. Lashkenari and N. Nasiri, Electrochim. Acta, 2023, 439, 141685 CrossRef.
- E. da, N. Silva, I. L. O. Brasileiro, V. S. Madeira, B. A. de Farias, M. L. A. Ramalho, E. Rodríguez-Aguado and E. Rodríguez-Castellón, J. Environ. Chem. Eng., 2020, 8, 104132 CrossRef.
- M. Faheem, X. Jiang, L. Wang and J. Shen, RSC Adv., 2018, 8, 5740–5748 RSC.
- C. Karthikeyan, K. Ramachandran, S. Sheet, D. J. Yoo, Y. S. Lee, Y. Satish Kumar, A. R. Kim and G. Gnana Kumar, ACS Sustainable Chem. Eng., 2017, 5, 4897–4905 CrossRef.
- E. Ranjith Kumar, R. Jayaprakash, G. Sarala Devi and P. Siva Prasada Reddy, Sens. Actuators, B, 2014, 191, 186–191 CrossRef.
- M. A. Haija, G. Basina, F. Banat and A. I. Ayesh, Mater. Sci. Pol., 2019, 37, 289–295 CrossRef.
- S. A. Soomro, I. H. Gul, H. Naseer, S. Marwat and M. Mujahid, Curr. Nanosci., 2019, 15, 420–429 CrossRef.
- L. Luo, R. Cui, H. Qiao, K. Chen, Y. Fei, D. Li, Z. Pang, K. Liu and Q. Wei, Electrochim. Acta, 2014, 144, 85–91 CrossRef.
- M. Israr, J. Iqbal, A. Arshad, A. Sadaf, M. Rani, M. Rani and S. Jabeen, J. Phys. D: Appl. Phys., 2021, 54, 395501 CrossRef.
- M. Chandel, D. Moitra, P. Makkar, H. Sinha, H. S. Hora and N. N. Ghosh, RSC Adv., 2018, 8, 27725–27739 RSC.
- B. Saravanakumar, S. P. Ramachandran, G. Ravi, V. Ganesh, R. K. Guduru and R. Yuvakkumar, Vacuum, 2019, 168, 108798 CrossRef.
- S. N. Hosseini, F. Karimzadeh, M. H. Enayati and N. M. Sammes, Solid State Ionics, 2016, 289, 95–105 CrossRef.
- Y. Liu, Y. Wu, W. Zhang, J. Zhang, B. Wang, C. Xia, M. Afzal, J. Li, M. Singh and B. Zhu, Int. J. Hydrogen Energy, 2017, 42, 17514–17521 CrossRef.
- M. I. Asghar, X. Yao, S. Jouttijärvi, E. Hochreiner, R. Virta and P. D. Lund, Int. J. Hydrogen Energy, 2020, 45, 24083–24092 CrossRef.
- M. A. S. Amulya, H. P. Nagaswarupa, M. R. A. Kumar, C. R. Ravikumar, K. B. Kusuma and S. C. Prashantha, J. Phys. Chem. Solids, 2021, 148, 109756 CrossRef.
- C. Karunakaran, S. SakthiRaadha, P. Gomathisankar and P. Vinayagamoorthy, RSC Adv., 2013, 3, 16728–16738 RSC.
- S. Hariganesh, S. Vadivel, B. paul, M. Kumaravel, N. Balasubramanian, S. Rajendran and S. Sankar Dhar, Inorg. Chem. Commun., 2021, 125, 108405 CrossRef CAS.
- A. M. Sukeshini, R. Cummins, T. L. Reitz and R. M. Miller, Electrochem. Solid State Lett., 2009, 12, B176 CrossRef CAS.
- L. Zouridi, I. Garagounis, A. Vourros, G. E. Marnellos and V. Binas, Adv. Mater. Technol., 2022, 7, 2101491 CrossRef CAS.
- L. J. Deiner and T. L. Reitz, Adv. Eng. Mater., 2017, 19, 1600878 CrossRef.
- A. Teichler, J. Perelaer and U. S. Schubert, J. Mater. Chem. C, 2013, 1, 1910–1925 RSC.
- O. Rahumi, A. Sobolev, M. K. Rath and K. Borodianskiy, J. Eur. Ceram. Soc., 2021, 41, 4528–4536 CrossRef CAS.
- V. Esposito, C. Gadea, J. Hjelm, D. Marani, Q. Hu, K. Agersted, S. Ramousse and S. H. Jensen, J. Power Sources, 2015, 273, 89–95 CrossRef CAS.
- G. D. Han, K. Bae, E. H. Kang, H. J. Choi and J. H. Shim, ACS Energy Lett., 2020, 5, 1586–1592 CrossRef CAS.
- S. Z. Golkhatmi, M. I. Asghar and P. D. Lund, J. Power Sources, 2022, 552, 232263 CrossRef CAS.
- A. Kushwaha, M. K. Jangid, B. B. Bhatt, A. Mukhopadhyay and D. Gupta, ACS Appl. Energy Mater., 2021, 4, 7911–7921 CrossRef CAS.
- Y. Gu, A. Wu, H. Sohn, C. Nicoletti, Z. Iqbal and J. F. Federici, J. Manuf. Process., 2015, 20, 198–205 CrossRef.
- S. Lawes, Q. Sun, A. Lushington, B. Xiao, Y. Liu and X. Sun, Nano Energy, 2017, 36, 313–321 CrossRef CAS.
- A. Sajedi-Moghaddam, M. Gholami and N. Naseri, ACS Appl. Mater. Interfaces, 2023, 15(3), 3894–3903 CrossRef CAS PubMed.
- K.-H. Choi, J. Yoo, C. K. Lee and S.-Y. Lee, Energy Environ. Sci., 2016, 9, 2812–2821 RSC.
- S. S. Delekta, A. D. Smith, J. Li and M. Östling, Nanoscale, 2017, 9, 6998–7005 RSC.
- A. Singh, M. Katiyar and A. Garg, RSC Adv., 2015, 5, 78677–78685 RSC.
- S. Jung, A. Sou, K. Banger, D. Ko, P. C. Y. Chow, C. R. McNeill and H. Sirringhaus, Adv. Energy Mater., 2014, 4, 1400432 CrossRef.
- T. M. Eggenhuisen, Y. Galagan, A. Biezemans, T. Slaats, W. P. Voorthuijzen, S. Kommeren, S. Shanmugam, J. P. Teunissen, A. Hadipour and W. J. H. Verhees, J. Mater. Chem. A, 2015, 3, 7255–7262 RSC.
- T. Roberts, J. B. De Graaf, C. Nicol, T. Hervé, M. Fiocchi and S. Sanaur, Adv. Healthcare Mater., 2016, 5, 1462–1470 CrossRef CAS.
- F. J. Pavinatto, C. W. A. Paschoal and A. C. Arias, Biosens. Bioelectron., 2015, 67, 553–559 CrossRef CAS PubMed.
- D. D. Le, T. N. N. Nguyen, D. C. T. Doan, T. M. D. Dang and M. C. Dang, Adv. Nat. Sci.: Nanosci. Nanotechnol., 2016, 7, 25002 Search PubMed.
- R. I. Tomov, T. Mitchell-Williams, C. Gao, R. V. Kumar and B. A. Glowacki, J. Appl. Electrochem., 2017, 47, 641–651 CrossRef CAS.
- B. Derby, Annu. Rev. Mater. Res., 2010, 40, 395–414 CrossRef CAS.
- L. Nayak, S. Mohanty, S. K. Nayak and A. Ramadoss, J. Mater. Chem. C, 2019, 7, 8771–8795 RSC.
- R. I. Tomov, M. Dudek, S. C. Hopkins, M. Krauz, H. Wang, C. Wang, Y. Shi, P. Tomczyk and B. A. Glowacki, ECS Trans., 2013, 57, 1359 CrossRef.
- I. Kim, S. Kim, A. Andreu, J.-H. Kim and Y.-J. Yoon, Addit. Manuf., 2022, 52, 102659 CAS.
- A. Kockmann, J. C. Porsiel, R. Saadat and G. Garnweitner, RSC Adv., 2018, 8, 11109–11118 RSC.
- W. J. Tseng and K.-H. Teng, Mater. Sci. Eng., A, 2001, 318, 102–110 CrossRef.
- G. D. Han, H. J. Choi, K. Bae, H. R. Choi, D. Y. Jang and J. H. Shim, ACS Appl. Mater. Interfaces, 2017, 9, 39347–39356 CrossRef CAS.
- G. D. Han, K. C. Neoh, K. Bae, H. J. Choi, S. W. Park, J.-W. Son and J. H. Shim, J. Power Sources, 2016, 306, 503–509 CrossRef CAS.
- T. D. Grant, A. C. Hourd, S. Zolotovskaya, J. B. Lowe, R. J. Rothwell, T. D. A. Jones and A. Abdolvand, Mater. Des., 2022, 214, 110377 CrossRef CAS.
- A. Lesch, F. Cortés-Salazar, V. C. Bassetto, V. Amstutz and H. H. Girault, Chim. Int. J. Chem., 2015, 69, 284–289 CrossRef CAS.
- M. Zeng and Y. Zhang, J. Mater. Chem. A, 2019, 7, 23301–23336 RSC.
- G. Czechowski, A. Rabiega and J. Jadzyn, Zeitschrift für Naturforsch. A, 2003, 58, 569–572 CrossRef CAS.
- K. Venkatramanan and V. Arumugam, Int. J. Thermophys., 2006, 27, 66–78 CrossRef CAS.
- R. Ben Haj-Kacem, N. Ouerfelli and J. V. Herráez, Phys. Chem. Liq., 2015, 53, 776–784 CrossRef.
- R. Hamdi and E. Mliki, South African J. Chem. Eng., 2023, 43, 337–341 CrossRef.
- J. Li, C. Zhang and J. Luo, Langmuir, 2013, 29, 5239–5245 CrossRef CAS.
- M. U. Jewel, F. Mokhtari-Koushyar, R. T. Chen and M. Y. Chen, in 2018 IEEE 18th International Conference on Nanotechnology (IEEE-NANO), IEEE, 2018, pp. 1–4.
- R. Balaji, M. Gowri Sankar, M. Chandra Sekhar and M. Chandra Shekar, Phys. Chem. Liq., 2016, 54, 422–439 CrossRef CAS.
- V. L. D. Costa, A. P. Costa and R. M. S. Simões, BioResources, 2019, 14, 7636–7654 CAS.
- L. Ren, X. Luo and H. Zhou, J. Am. Ceram. Soc., 2018, 101, 3874–3889 CrossRef CAS.
- Z. Tang, K. Fang, M. N. Bukhari, Y. Song and K. Zhang, Langmuir, 2020, 36, 9481–9488 CrossRef CAS PubMed.
- J. E. Fromm, IBM J. Res. Dev., 1984, 28, 322–333 Search PubMed.
- B. Derby, J. Eur. Ceram. Soc., 2011, 31, 2543–2550 CrossRef CAS.
- J. Zhang, Y. Cui and H. Wang, J. Renewable Sustainable Energy, 2013, 5, 23117 CrossRef.
- M. Zhang, H. Wang, F. Xiang and X. Yao, Int. J. Appl. Ceram. Technol., 2009, 6, 257–263 CrossRef CAS.
- D. Graf, A. Qazzazie and T. Hanemann, Materials, 2020, 13, 2587 CrossRef CAS.
- H. Yuan, J. Liu, M. Gu, S. Feng, M. Zhou and Y. Luo, Ceram. Int., 2021, 47, 16641–16651 CrossRef CAS.
- X. Liu, W. Liu, C. Wang, Z. Zheng and L. Kong, J. Electron. Mater., 2016, 45, 5436–5442 CrossRef CAS.
- Z. Chen, J. Ouyang, W. Liang, Z. Yan, F. Stadler and C. Lao, Ceram. Int., 2018, 44, 13381–13388 CrossRef CAS.
- A. M. Balagurov, I. A. Bobrikov, M. S. Maschenko, D. Sangaa and V. G. Simkin, Crystallogr. Rep., 2013, 58, 710–717 CrossRef CAS.
- J. Cao, Y. Ji and Z. Shao, Energy Environ. Sci., 2022, 15, 2200–2232 RSC.
- M. Zhiani, S. Majidi, V. B. Silva and H. Gharibi, Energy, 2016, 97, 560–567 CrossRef CAS.
- J. Zhang, J. Wu, H. Zhang and J. Zhang, PEM fuel cell testing and diagnosis, Newnes, 2013 Search PubMed.
- M. B. Hanif, J.-T. Gao, K. Shaheen, Y.-P. Wang, M. Yasir, S.-L. Zhang, C.-J. Li and C.-X. Li, J. Power Sources, 2020, 472, 228498 CrossRef CAS.
- D. M. Bastidas, S. Tao and J. T. S. Irvine, J. Mater. Chem., 2006, 16, 1603–1605 RSC.
- K. Sasaki, J. Wurth, R. Gschwend, M. Gödickemeier and L. J. Gauckler, J. Electrochem. Soc., 1996, 143, 530 CrossRef CAS.
- M. J. Jørgensen and M. Mogensen, J. Electrochem. Soc., 2001, 148, A433 CrossRef.
- G. Dong, C. Yang, F. He, Y. Jiang, C. Ren, Y. Gan, M. Lee and X. Xue, RSC Adv., 2017, 7, 22649–22661 RSC.
- S. H. Chan, X. J. Chen and K. A. Khor, J. Electrochem. Soc., 2003, 151, A164 CrossRef.
- Z. Lu, J. Hardy, J. Templeton and J. Stevenson, J. Power Sources, 2012, 198, 90–94 CrossRef CAS.
- R. K. Sharma, M. Burriel, L. Dessemond, V. Martin, J.-M. Bassat and E. Djurado, J. Power Sources, 2016, 316, 17–28 CrossRef CAS.
- S. B. Adler, Chem. Rev., 2004, 104, 4791–4844 CrossRef CAS.
- J. Parbey, Q. Wang, J. Lei, M. Espinoza-Andaluz, F. Hao, Y. Xiang, T. Li and M. Andersson, Int. J. Hydrogen Energy, 2020, 45, 6949–6957 CrossRef CAS.
- A. Sánchez-Ruiz, A. Sousa-Hervés, J. C. Pérez-Flores, J. R. Marín-Rueda, J. Tolosa, A. Garzón-Ruiz, J. Rodríguez-López, J. Canales-Vázquez and J. C. García-Martínez, Prog. Org. Coatings, 2022, 166, 106787 CrossRef.
- C. Li, H. Chen, H. Shi, M. O. Tade and Z. Shao, J. Power Sources, 2015, 273, 465–471 CrossRef CAS.
- T. Horter, H. Ruehl, W. Yang, Y.-S. Chiang, K. Glaeser and A. Zimmermann, J. Manuf. Mater. Process., 2023, 7, 20 CAS.
- K. L. Duncan, K.-T. Lee and E. D. Wachsman, J. Power Sources, 2011, 196, 2445–2451 CrossRef CAS.
- A. Seong, J. Kim, J. Kim, S. Kim, S. Sengodan, J. Shin and G. Kim, J. Electrochem. Soc., 2018, 165, F1098 CrossRef CAS.
- M. B. Hanif, J.-T. Gao, S. qayyum, K. Shaheen, Y.-P. Wang, M. Yasir, C.-J. Li and C.-X. Li, Ceram. Int., 2021, 47, 10893–10904 CrossRef CAS.
- J. Deseure, Y. Bultel, L. Dessemond and E. Siebert, Electrochim. Acta, 2005, 50, 2037–2046 CrossRef CAS.
- W. Chang, E. H. Kang, H. J. Jeong, W. Choi and J. H. Shim, Energy, 2023, 268, 126489 CrossRef CAS.
- C. Wang, S. C. Hopkins, R. I. Tomov, R. V. Kumar and B. A. Glowacki, J. Eur. Ceram. Soc., 2012, 32, 2317–2324 CrossRef CAS.
- W. Zhang, H. Wang, K. Guan, Z. Wei, X. Zhang, J. Meng, X. Liu and J. Meng, ACS Appl. Mater. Interfaces, 2019, 11, 26830–26841 CrossRef CAS.
- M. Ahn, J. Lee and W. Lee, J. Power Sources, 2017, 353, 176–182 CrossRef CAS.
- S. V. Jouttijärvi, M. I. Asghar and P. D. Lund, Catal. Today, 2021, 364, 104–110 CrossRef.
- J. A. Cebollero, R. Lahoz, M. A. Laguna-Bercero and A. Larrea, J. Power Sources, 2017, 360, 336–344 CrossRef CAS.
- H. Seo, H. Iwai, M. Kishimoto, C. Ding, M. Saito and H. Yoshida, J. Power Sources, 2020, 450, 227682 CrossRef CAS.
- C. Lee, S. S. Shin, J. Kim, J. Choi, M. Choi and H. H. Shin, ACS Appl. Mater. Interfaces, 2022, 14, 32124–32133 CrossRef CAS PubMed.
- L. Bi, S. P. Shafi, E. H. Da’as and E. Traversa, Small, 2018, 14, 1801231 CrossRef.
| This journal is © The Royal Society of Chemistry 2024 |

