 Open Access Article
Study of the mechanisms of the phonon bottleneck effect in CdSe/CdS core/shell quantum dots and nanoplatelets and their application in hot carrier multi-junction solar cells†
Yi
Zhang
 *ab,
Wenbin
Xiang
c,
Rui
Wang
a,
Jiayu
Zhang
 *c and
Gavin
Conibeer
*d
aCollege of Energy and Electrical Engineering, Hohai University, Nanjing 210098, China. E-mail: zynjjs@outlook.com
bNational Laboratory of Solid State Microstructures, Nanjing University, Nanjing 210093, China
cAdvanced Photonics Center, Southeast University, Nanjing 210096, China
dSchool of Photovoltaic and Renewable Energy Engineering, University of New South Wales, Kensington 2052, Australia
First published on 12th September 2023
Abstract
The hot carrier multi-junction solar cell (HCMJSC) is one of the promising advanced conceptual solar cells with theoretical efficiency greater than 65%, consisting of a thin top junction with a wide bandgap and a thicker junction at the bottom with a medium bandgap for absorption of high and low energy photons. The wide bandgap CdSe/CdS low-dimensional systems (e.g. quantum dots, QDs and nanoplatelets, NPLs) widely used in optoelectrical devices are expected to be an appropriate candidate for the top junction. However, the mechanisms underlying the carrier relaxation rate reduction (or phonon bottleneck effect, PBE) for HCMJSC in these material systems are not well understood so far. In this work, the carrier relaxation mechanisms in CdSe/CdS core/shell QDs and NPLs are quantitatively analyzed by calculating the thermalization coefficient (Qth) through steady state photoluminescence (SSPL) and picosecond-time resolved photoluminescence (ps-TRPL). A significantly extended carrier relaxation time of more than 20 ns was observed in the TRPL of QDs. This could be attributed to both the Auger reheating (AR) at the initial fast decay stage and acoustic phonon folding at the slow decay stage. For SSPL, the Qth value of QDs is much lower due to a 1 order of magnitude higher AR rate. A strong coupling may exist between AR and Qth with a high probability of PBE, where a lower Qth gives a higher AR rate. The AR may dominate carrier thermalization if the PBE level is high. Meanwhile, other mechanisms like acoustic phonon folding will also affect the carrier relaxation if the PBE is at a much lower level.
Introduction
The hot carrier solar cell (HCSC) is an advanced concept solar cell that aims to utilize the energy lost in carrier thermalization for power generation with potential power conversion efficiency (PCE) greater than 65% under sunlight conditions,1–8 which is much greater than the Shockley–Queisser efficiency limit of 31% for a single junction solar cell.9 The HCSC absorber aims to greatly extend the carrier thermalization process in the time scale from several picoseconds (10−12 s) to several nanoseconds (10−9 s) that can be observed in low-dimensional quantum confined thin films.10–13 A hot carrier population with total energy well above the band edge could therefore be established for carrier extraction through energy selective contacts (ESCs) that are another important component of the HCSC.14–18 In recent years, HCSC devices have been demonstrated but with limited PCE of 11.6 ± 0.5% at 55![[thin space (1/6-em)]](https://www.rsc.org/images/entities/char_2009.gif) 600 suns (i.e. focused laser illumination of 1650 W cm−2),19 which is substantially lower than the theoretical efficiency. This can partially be explained by the fact that an ultrathin quantum confined HCSC absorber cannot absorb sufficient photons close to the bandgap, resulting in a low current limiting the PCE.
600 suns (i.e. focused laser illumination of 1650 W cm−2),19 which is substantially lower than the theoretical efficiency. This can partially be explained by the fact that an ultrathin quantum confined HCSC absorber cannot absorb sufficient photons close to the bandgap, resulting in a low current limiting the PCE.
In order to improve the photon absorption whilst at the same time reducing the carrier thermalization rate for the HCSC, the idea of a hot carrier multi-junction solar cell (HCMJSC) is proposed,20 where a thin hot-carrier top junction (i.e. wide bandgap ultrathin film, HCTJ) absorbs high-energy photons while low-energy photons are absorbed in a second, thicker junction. In a quasi-0-dimensional system such as quantum dots (QDs), the quantum confinement (QC) can be further enhanced through confinement by the interfacial boundary between the core and shell of QDs, contributing further to a slower carrier thermalization process. Wurtzite (WZ) CdSe/CdS core/shell QDs with wide bandgaps at 300 K of 1.72 eV for CdSe and 2.42 eV for CdS might be an appropriate candidate for an HCTJ due to their potentially very strong QC, their ease of preparation and their low fabrication cost. CdSe/CdS core/shell nanoplatelets (NPLs) are also believed to be an ideal candidate for HCTJ for their greater QC. In addition, the phonon bottleneck effect (PBE, or hot phonon effect) is believed to be the most important mechanism to significantly reduce the carrier thermalization rate in a series of low-dimensional semiconductors.21–25 However, the mechanisms underlying PBE in wide bandgap semiconductors (e.g. CdSe/CdS QDs and NPLs) have not been thoroughly studied to date. Therefore, it is essential to systematically investigate the PBE mechanisms in CdSe/CdS QDs and NPLs for HCTJ.
In this work, the PBEs observed in two different CdSe/CdS low dimensional systems (i.e. QDs and NPLs) with similar shell thickness (i.e. 4–5 monolayers, ML) are systematically compared and analyzed via steady state photoluminescence (SSPL) and picosecond time-resolved photoluminescence (ps-TRPL). The PBE mechanism is quantitatively studied by calculating the thermalization coefficient (Qth) in units of W K−1 cm−2 derived from thermalized (absorbed) power density (Pth).26 It was found that the values of Qth for QDs and NPLs are 6.13 ± 0.41 and 47.47 ± 4.35 mW K−1 cm−2, respectively. The significantly smaller Qth for QDs implies that the carrier relaxation rate for QDs is expected to be much lower than that of NPLs. These results are supported by a much longer carrier cooling time observed in the QDs (i.e. 40 ns) than that for NPLs (i.e. 5 ns) according to the TRPL results. This could be explained by the stronger carrier–carrier interactions in QDs due to (1) enhanced QC and (2) the absence of dielectric screening,27 giving a higher Auger recombination rate for carrier reheating. Other work has demonstrated that the Auger recombination rate in NPLs is more than 1 order of magnitude smaller than that in QDs of equal volume,28–30 which is highly consistent with our observed results. The above implies the carrier relaxation rate is limited by reheating due to Auger recombination (AR), significantly extending the carrier relaxation time (τre) to the nanosecond time scale. As is described below, we demonstrate that this AR is mediated by spatial confinement of phonons in both QDs and NPLs, to different extents. Hence, AR can be described as the dominant PBE for CdSe/CdS QDs and NPLs, where a lower Qth means slower energy dissipation due to the higher AR rate. Besides the Auger reheating, the acoustic phonon folding could also reduce the carrier thermalization rate but dominate in the later slow decay process. It can provide additional barriers to the optical phonon decay through suppression of 2nd or 3rd order Klemens decay. A higher population of hot acoustic and optical phonons is therefore maintained, slowing the carrier cooling rate.31
Methodology
Sample fabrication
The CdSe/CdS core/shell QDs were synthesized in two steps: first, WZ CdSe cores were synthesized at 380 °C, following the procedure in the literature.32 Then, the successive ionic layer adsorption and reaction (SILAR) method was used to control the epitaxial growth of the CdS shell on the surface of CdSe cores at a temperature of 310 °C.33 The QD shell thickness was measured to be around 5 ML.The CdSe/CdS core–shell NPLs were synthesized using colloidal atomic layer deposition (c-ALD).33,34 The CdSe NPLs were first synthesized by using the following procedure. The organic precursor cadmium myristate (C28H54CdO4), selenium powder (Se) and octadecene (ODE) were degassed in a three-necked flask for 30 min at room temperature (300 K). They were then reacted with Cd(Ac)2, oleic acid and hexane sequentially to obtain a precipitate containing NPLs, which were then washed with ethanol. The inorganic ligand S2− was then attached onto this preprepared zinc blende CdSe NPL surface to obtain the CdS shell with a thickness of about 4 ML. The epitaxial growth process was completed in 40 minutes.30,34
Characterization
Transmission electron microscopy (TEM) and high-resolution TEM (HRTEM) images were recorded on an FEI Tecnai G2 electron microscope with an acceleration voltage of 200 kV. The optical image was examined using a metallographic microscope (Olympus, BX51M). In order to explore the carrier relaxation dynamics within solar cells under actual operation conditions, the samples were probed using power dependent steady state photoluminescence (SSPL). A continuous laser with an excitation source of 532 nm was used to photoexcite excitons, which emit a photoluminescence spectrum by radiative recombination. By increasing the excitation intensity, a hot carrier population (or out of equilibrium carrier population) is generated, which could be detected by a change in the shape of the PL spectrum (i.e. a more obvious asymmetry can be seen at high energies). The power incident on the sample was 218 mW. Neutral density filters were used to tune the incident power from 100% of the nominal power to 0.1%. These filters were combined with another filter with an adjustable attenuation by rotation to further refine the nominal power to below 0.1%. The laser spot size on the sample was then measured to be 1.245 mm in diameter using a micrometer calibration grating. The PL signals were collected and measured using a Spectra Pro-300i (Acton Research Company) optical multi-channel analyzer. The TRPL measurements were performed using an electrically triggered streak camera system (Hamamatsu C5680) in the QD solution. The excitation light source is a 400 nm laser pulse with a power meter measuring 12 μW, similar to the peak power of SSPL, which is generated by doubling the frequency of a Coherent Legend F-lk femtosecond laser (800 nm, 100 fs, 1 kHz) through BBO crystals.Results and discussion
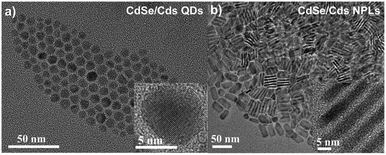
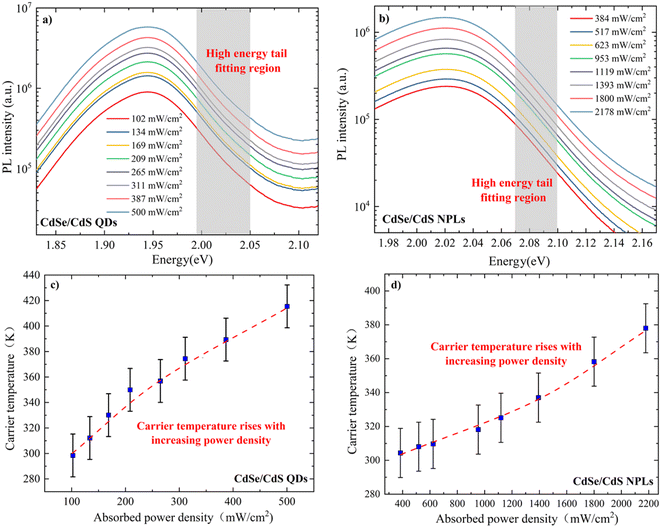
Fig. 1(a) and (b) are representative TEM images (scale bar = 50 nm) of CdSe/CdS QDs and NPLs with the HRTEM images (scale bar = 5 nm) of a single quantum dot or nanoplatelet for more detail. The shell thicknesses of QDs and NPLs are estimated to be 5 ML and 4 ML (i.e. 1 ML ≈ 0.35 nm), respectively. Clear fringes are observed in the HRTEM image of QDs, indicating the high quality of the samples. The shape characteristics of QDs and NPLs are clearly observed in Fig. 1, where the QDs are approximately spherical, while the NPLs are elliptical. The strong three-dimensional QC of QDs divides their electronic structure into discrete energy levels. But the carriers in NPLs are only confined in one dimension, the electronic structure of NPLs is closer to that of a quantum well, with lower confined energy levels that are more like steps in energy than discrete energy levels.35 Hence, the QC of QDs is much stronger than that of NPLs, implying a more concentrated electron state density distribution, larger exciton binding energy, and stronger exciton resonance.Fig. 2(a) and (b) show the SSPL results of CdSe/CdS core–shell QD and NPL samples, respectively, with 8 different absorbed power densities. The primary PL emission peaks for QDs and NPLs can be seen at around 1.94 eV and 2.02 eV, respectively, both higher than that of bulk CdSe (i.e. 1.72 eV), demonstrating a strong ideal QC that is consistent with other research work.33 The asymmetric broadening of the peak is attributed to the heating of the carriers within QDs along with the increasing incident power density. The unchanged peak position of QDs indicates that the temperature of the actual CdSe QDs is relatively stable at room temperature of 300 K. Assuming that a Maxwell–Boltzmann-like distribution of carriers is established via SSPL, the high energy tail region (i.e. 1.99–2.05 eV) of the PL follows an exponential law with incident photon energy,12,36
 | (1) |
In polar semiconductors, the dominant method for carrier thermalization is through the carrier-longitudinal optical (LO) phonon scattering. The carrier energy is transferred to LO phonons which then decay into acoustic phonons via Klemens (dominate mechanism) or Ridley (secondary mechanism) decay.38 The acoustic phonons will eventually dissipate their energy in the form of lattice heat. The rate of carrier thermalization (Pth) is related to the temperature difference between the carriers and lattice (ΔT = TC − 300 K), the LO phonon energy (ELO) and the thermalization coefficient (Q),37 and can be described by eqn (2) below
 | (2) |
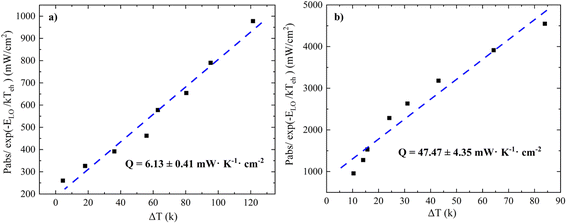
Fig. 3(a) shows a clear linear relationship between Pabs/exp(−ELO/kTC) and ΔT, with the slope indicating an extremely small Q value of 6.13 ± 0.41 mW K−1 cm−2 for QDs and in Fig. 3(b) a Q value an order of magnitude larger for NPLs, at 47.47 ± 4.35 mW K−1 cm−2. This implies that the carrier thermalization rate in such QDs is substantially slower than in other quantum confined systems such as multiple quantum wells (MQWs), which typically have values of Q in the hundreds of W K−1 cm−2.12,36,37 The large difference in Q values can be attributed to a few effects. The first is that QDs, and to a lesser extent NPLs, have a much greater QC than MQWs. Since the carriers are confined by the interfacial boundary between the core and shell of QDs in three dimensions, there are more limited options for the carrier to undergo significant relaxation. The second reason could be that the excitation power density in this experiment is significantly smaller than that in other work for MQW systems. This also implies that the Q value for these QDs might be significantly different, if the applied excitation power density were orders of magnitude higher. According to the simulation work done by Le Bris et al.,37 a smaller Q value is necessary to observe an efficiency enhancement for HCSC at low solar concentration values (e.g. the Q value is less than 10 W K−1 cm−2 for 10![[thin space (1/6-em)]](https://www.rsc.org/images/entities/char_2009.gif) 000 suns and less than 1 W K−1 cm−2 for 1000 suns). In this work, a Q value of ∼6 mW K−1 cm−2 indicates that a concentration of around 9 suns is required to achieve an efficiency improvement for an HCSC, which is much more achievable in practice. This also indicates that the application of CdSe/CdS QDs as the top layer of an HCMJSC is a feasible scheme.
000 suns and less than 1 W K−1 cm−2 for 1000 suns). In this work, a Q value of ∼6 mW K−1 cm−2 indicates that a concentration of around 9 suns is required to achieve an efficiency improvement for an HCSC, which is much more achievable in practice. This also indicates that the application of CdSe/CdS QDs as the top layer of an HCMJSC is a feasible scheme.
The Q values of III–V SQWs and MQWs derived from the SSPL are from 2.5 to 9.5 W K−1 cm−2 at solar concentrations of 2000–10![[thin space (1/6-em)]](https://www.rsc.org/images/entities/char_2009.gif) 000 suns.40,41 Previous work has identified that a lower Q value will be obtained at lower solar concentration.37 In this work, the Q values of QDs and NPLs with stronger quantum confinement are calculated based on the SSPL at much lower solar concentration of SSPL. The calculated Q values (i.e. 6.13 ± 0.41 mW K−1 cm−2 for QDs and 47.47 ± 4.35 mW K−1 cm−2 for NPLs) are substantially lower than those of III–V MQWs or SQWs (i.e. to give slower thermalization, as is expected from theoretical calculations of the much greater QC in these systems), hence demonstrating the applicability, reliability and robustness of this method.
000 suns.40,41 Previous work has identified that a lower Q value will be obtained at lower solar concentration.37 In this work, the Q values of QDs and NPLs with stronger quantum confinement are calculated based on the SSPL at much lower solar concentration of SSPL. The calculated Q values (i.e. 6.13 ± 0.41 mW K−1 cm−2 for QDs and 47.47 ± 4.35 mW K−1 cm−2 for NPLs) are substantially lower than those of III–V MQWs or SQWs (i.e. to give slower thermalization, as is expected from theoretical calculations of the much greater QC in these systems), hence demonstrating the applicability, reliability and robustness of this method.
Fig. 4 demonstrates the 2D contour plots of TRPL for CdSe/CdS NPL and QD samples with normalized TRPL signal intensity indicated on the right hand side. The initial excitation time (i.e. t = 0 ns) for each sample is indicated by the red dashed line. The TRPL main emission peaks for NPLs and QDs are around 605 nm (or 2.05 eV) and 630 nm (or 1.97 eV), which are highly consistent with those for the SSPL of Fig. 2.
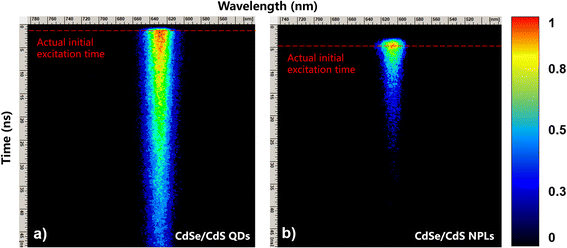 | ||
| Fig. 4 TRPL results for CdSe/CdS with nanostructures of QDs (left) and NPLs (right) are shown with initial excitation time indicated by the red dashed lines for each spectrum. | ||
For TRPL data, the high-energy tail fitting method similar to SSPL data is used to calculate the time dependent hot carrier temperatures in Fig. 4(a) and (b). Fig. 5 shows the TRPL diagram of NPLs at 5 different decay times after excitation, where the fitting region is indicated by fitting the shaded part and the linear trend lines are indicated by the blue dashed lines for clarity. A similar method is also applied on the TRPL results of QDs to calculate the time dependent hot carrier temperatures which is not displayed here.
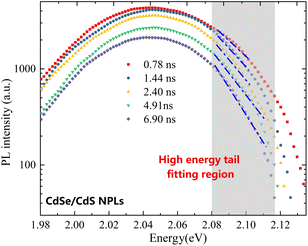 | ||
| Fig. 5 Time dependent TRPL results in CdSe/CdS NPLs with 5 different relaxation times, where the high energy tail fitting region is indicated by the shaded area. | ||
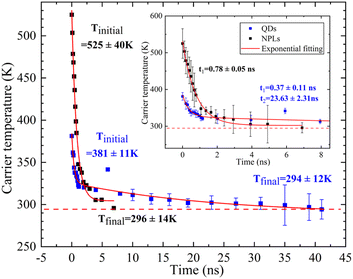
Fig. 6 presents the time dependent carrier dynamics of NPLs and QDs fitted with exponential functions to vertical slices through the TRPL spectra of Fig. 4 at the wavelength of peak emission intensity. The time range is from 0 to 45 ns (inset: from 0 to 8 ns for more detail) and the carrier relaxation time, decay trend and initial temperatures are all indicated. It is observed that the QDs take about 41 ns to reach room temperature, whereas the carrier temperature of NPLs reaches room temperature after about 7 ns. There are two main reasons for their relaxation time difference. Compared with NPLs, AR has a stronger effect in QDs, which slows down the relaxation rate, and the acoustic phonon folding plays a key role in the relaxation process of QDs, which greatly prolongs the relaxation time.
There are differences in the decay trends in these materials: NPLs undergo a mono-exponential decay with a τre = 780 ± 50 ps due to AR which has good agreement with other research work.29,42 On the other hand, an initial fast decay component with τre_1 of 370 ± 110 ps followed by a slow decay after 1 ns with τre_2 of 23.63 ± 2.31 ns is observed in the QDs.
Comparing the results of SSPL and TRPL, the key points behind the different observations appear to be whether or not a significant PBE is present. For SSPL there is continuous excitation of excited states so that the hot carrier density and consequently the LO phonon population will be much higher. In contrast, for TRPL, the initially excited hot carriers are at relatively low density and after the initial pulse, there is also no more excitation of hot carriers. So the densities of hot carrier and LO phonons are lower. Hence phonon bottleneck conditions will be achieved at a lower illumination intensity for SSPL than for TRPL and a small Qth would be expected for SSPL. Therefore, under the PBE conditions of SSPL the higher AR rates of QDs lead to a higher rate of AR reheating of carriers, because there is little opportunity for these carriers to lose their energy by emission of LO phonons. Moreover, the AR is very likely dominated by the indirect phonon-mediated process like those in the wide bandgap III–V semiconductors.43–45 The AR rate will rise with increasing Auger coefficient due to a stronger PBE, reducing the carrier thermalization rate or lowering the value of Qth.
But for TRPL, which is not under PBE conditions (or at least it has a much lower level of PBE), the higher rate of AR in QDs does not lead to AR reheating of carriers. Because there is plenty of opportunity for these hot carriers to lose their energy to LO phonons, in fact the enhanced AR in QDs leads to a faster thermalization in QDs (τre_1 = 370 ps) rather than in NPLs (τre = 780 ps) because the AR gives greater opportunity for LO phonon emission. This is similar to the situation often observed in the literature on Multiple Exciton Generation (MEG) in which AR is often quoted as being a mechanism for faster cooling.46–48
We observed the initial carrier temperature (Tinitial) of NPLs is 525 ± 40 K which is around 140 K higher than that of QDs. The higher Tinitial may imply the QDs have a larger degree of acoustic phonon folding than NPLs due to the greater spatial confinement in QDs. This folding is particularly important for acoustic modes as it brings these modes to the mini-Brillouin zone centre at appreciable energy (normally acoustic modes have close to zero energy at zone centre) and thus allows them to be optically active (Raman active) such that these folded acoustic modes can be directly emitted by hot carriers, thus providing an additional (if rather slow) route for carrier cooling to take place.49
For SSPL, phonon folding simply limits the maximum temperature that carriers can reach in the steady state in NPLs, since they are always losing energy to LO phonons and to optical-like acoustic phonons in parallel, whereas QDs only have one channel for LO phonons and so attain a higher carrier temperature. However, for TRPL, the additional optical-like acoustic phonon channel does not make much difference until the temperature drops to a point at which very little energy is lost to LO phonons and acoustic phonon loss takes over and this is very slow, giving a long lifetime (i.e. 23.63 ns), which also explains the second stage mechanism in the QD thermalization process.
Conclusions and outlook
In this work, the mechanisms of slowed carrier cooling in the low-dimensional structures of CdSe/CdS core/shell QDs and NPLs are studied. The thermalization coefficient (Qth) is firstly introduced in QD systems to investigate the carrier relaxation rate and its validity is verified. It was found that the stronger AR in QDs due to enhanced QC leads to a great reduction in the relaxation rate, that is, a much lower energy loss rate. In fact, both AR and acoustic phonon folding could prevent the energy dissipation of excited carriers. Moreover, AR seems to play a decisive role in the initial fast decay stage and the phonon folding plays a more important role in the later slow decay stage. Under SSPL conditions with a high probability of PBE occurrence, AR and Qth are strongly coupled, where a lower Qth implies slower energy dissipation due to the higher AR rate of QDs. According to our work, the CdSe/CdS QDs seem to be an ideal top layer candidate for the HCMJSC. The calculation of the carrier relaxation rate could be simplified by calculating their Qth, improving the selection efficiency of the ideal top layer candidate for the HCMJSC.Author contributions
Yi Zhang was in charge of conceptualization, project administration, original draft writing, review and supervision. Wenbin Xiang was in charge of investigation and validation. Rui Wang was in charge of formal analysis. Jiayu Zhang was in charge of resources and review. Gavin Conibeer was in charge of review and supervision.Conflicts of interest
There are no conflicts to declare.Acknowledgements
This work was supported by the National Natural Science Foundation of China (Grant No. 62004060, 62175029), Fundamental Research Funds for the Central Universities (Grant No. B220202002), National Laboratory of Solid State Microstructures, Nanjing University (Grant No. M35060) and Special Project of Hong Kong, Macao and Taiwan Science and Technology Cooperation of Jiangsu Science and Technology Plan (Grant No. BZ2021057). GC acknowledges the support of the Australian Research Council's Photovoltaics Centre of Excellence.References
- R. T. Ross and A. J. Nozik, J. Appl. Phys., 1982, 53, 3813–3818 CrossRef CAS.
- P. Wurfel, A. S. Brown, T. E. Humphrey and M. A. Green, Prog. Photovoltaics, 2005, 13, 277–285 Search PubMed.
- P. Würfel, Sol. Energy Mater. Sol. Cells, 1997, 46, 43–52 CrossRef.
- Y. Zhang, X. Jia, S. Liu, B. Zhang, K. Lin, J. Zhang and G. Conibeer, Sol. Energy Mater. Sol. Cells, 2021, 225, 111073 CrossRef CAS.
- G. Conibeer, S. Shrestha, S. Huang, R. Patterson, H. Xia, Y. Feng, P. Zhang, N. Gupta, M. Tayebjee, S. Smyth, Y. Liao, S. Lin, P. Wang, X. Dai and S. Chung, Sol. Energy Mater. Sol. Cells, 2015, 135, 124–129 CrossRef CAS.
- A. Le Bris, J. Rodiere, C. Colin, S. Collin, J.-L. Pelouard, R. Esteban, M. Laroche, J.-J. Greffet and J.-F. Guillemoles, IEEE J. Photovoltaics, 2012, 2, 506–511 Search PubMed.
- Y. Takeda, T. Ito, T. Motohiro, D. Koenig, S. Shrestha and G. Conibeer, J. Appl. Phys., 2009, 105, 074905 CrossRef.
- G. J. Conibeer, D. Konig, M. A. Green and J. F. Guillemoles, Thin Solid Films, 2008, 516, 6948–6953 CrossRef CAS.
- W. Shockley and H. J. Queisser, J. Appl. Phys., 1961, 32, 510–519 CrossRef CAS.
- W. Pelouch, R. Ellingson, P. Powers, C. Tang, D. Szmyd and A. Nozik, Phys. Rev. B: Condens. Matter Mater. Phys., 1992, 45, 1450–1453 CrossRef CAS PubMed.
- Y. Rosenwaks, M. C. Hanna, D. H. Levi, D. M. Szmyd, R. K. Ahrenkiel and A. J. Nozik, Phys. Rev. B: Condens. Matter Mater. Phys., 1993, 48, 14675–14678 CrossRef CAS PubMed.
- L. C. Hirst, M. K. Yakes, C. G. Bailey, J. G. Tischler, M. P. Lumb, M. Gonzalez, M. F. Fuehrer, N. J. Ekins-Daukes and R. J. Walters, IEEE J. Photovoltaics, 2014, 4, 1526–1531 Search PubMed.
- M. Giteau, E. de Moustier, D. Suchet, H. Esmaielpour, H. Sodabanlu, K. Watanabe, S. Collin, J.-F. Guillemoles and Y. Okada, J. Appl. Phys., 2020, 128, 193102 CrossRef CAS.
- Y. Takeda, A. Ichiki, Y. Kusano, N. Sugimoto and T. Motohiro, J. Appl. Phys., 2015, 118, 124510 CrossRef.
- Y. Feng, P. Aliberti, B. P. Veettil, R. Patterson, S. Shrestha, M. A. Green and G. Conibeer, Appl. Phys. Lett., 2012, 100, 053502 CrossRef.
- P. Aliberti, Y. Feng, S. K. Shrestha, M. A. Green, G. Conibeer, L. W. Tu, P. H. Tseng and R. Clady, Appl. Phys. Lett., 2011, 99, 223507 CrossRef.
- S. K. Shrestha, P. Aliberti and G. J. Conibeer, Sol. Energy Mater. Sol. Cells, 2010, 94, 1546–1550 CrossRef CAS.
- G. J. Conibeer, C. W. Jiang, D. Konig, S. Shrestha, T. Walsh and M. A. Green, Thin Solid Films, 2008, 516, 6968–6973 CrossRef CAS.
- N. Dac-Trung, L. Lombez, F. Gibelli, S. Boyer-Richard, A. Le Corre, O. Durand and J.-F. Guillemoles, Nat. Energy, 2018, 3, 236–242 CrossRef.
- M. Giteau, S. Almosni and J. F. Guillemoles, Appl. Phys. Lett., 2022, 120, 213901 CrossRef CAS.
- Y. Zhang, G. Conibeer, S. Liu, J. Zhang and J.-F. Guillemoles, Prog. Photovoltaics, 2022, 30, 581–596 CAS.
- Y. Zhang, L. Tang, B. Zhang, P. Wang and C. Xu, Appl. Phys. Lett., 2020, 116, 103104 CrossRef CAS.
- Y. Yang, D. P. Ostrowski, R. M. France, K. Zhu, J. van de Lagemaat, J. M. Luther and M. C. Beard, Nat. Photonics, 2016, 10, 53–59 CrossRef CAS.
- J. Urayama, T. B. Norris, J. Singh and P. Bhattacharya, Phys. Rev. Lett., 2001, 86, 4930–4933 CrossRef CAS PubMed.
- T. Inoshita and H. Sakaki, Phys. B, 1996, 227, 373–377 CrossRef CAS.
- A. Le Bris and J. F. Guillemoles, Appl. Phys. Lett., 2010, 97, 113506 CrossRef.
- V. I. Klimov, A. A. Mikhailovsky, D. W. McBranch, C. A. Leatherdale and M. G. Bawendi, Science, 2000, 287, 1011–1013 CrossRef CAS PubMed.
- L. T. Kunneman, M. D. Tessier, H. Heuclin, B. Dubertret, Y. V. Aulin, F. C. Grozema, J. M. Schins and L. D. A. Siebbeles, J. Phys. Chem. Lett., 2013, 4, 3574–3578 CrossRef CAS.
- E. Baghani, S. K. O'Leary, I. Fedin, D. V. Talapin and M. Pelton, J. Phys. Chem. Lett., 2015, 6, 1032–1036 CrossRef CAS PubMed.
- M. Pelton, J. J. Andrews, I. Fedin, D. V. Talapin, H. Leng and S. K. O'Leary, Nano Lett., 2017, 17, 6900–6906 CrossRef CAS PubMed.
- G. Conibeer, S. Shrestha, S. J. Huang, R. Patterson, H. Z. Xia, Y. Feng, P. F. Zhang, N. Gupta, M. Tayebjee, S. Smyth, Y. X. Liao, S. Lin, P. Wang, X. Dai and S. M. Chung, Sol. Energy Mater. Sol. Cells, 2015, 135, 124–129 CrossRef CAS.
- O. Chen, J. Zhao, V. P. Chauhan, J. Cui, C. Wong, D. K. Harris, H. Wei, H.-S. Han, D. Fukumura, R. K. Jain and M. G. Bawendi, Nat. Mater., 2013, 12, 445–451 CrossRef CAS PubMed.
- L. Zhang, H. Li, C. Liao, H. Yang, R. Xu, X. Jiang, M. Xiao, C. Lu, Y. Cui and J. Zhang, J. Phys. Chem. C, 2018, 122, 25059–25066 CrossRef CAS.
- S. Ithurria and D. V. Talapin, J. Am. Chem. Soc., 2012, 134, 18585–18590 CrossRef CAS PubMed.
- S. Ithurria, M. D. Tessier, B. Mahler, R. Lobo, B. Dubertret and A. Efros, Nat. Mater., 2011, 10, 936–941 CrossRef CAS PubMed.
- L. C. Hirst, H. Fujii, Y. P. Wang, M. Sugiyama and N. J. Ekins-Daukes, IEEE J. Photovoltaics, 2014, 4, 244–252 Search PubMed.
- A. Le Bris, L. Lombez, S. Laribi, G. Boissier, P. Christol and J. F. Guillemoles, Energy Environ. Sci., 2012, 5, 6225–6232 RSC.
- P. G. Klemens, Phys. Rev., 1966, 148, 845–848 CrossRef CAS.
- M. Lowisch, M. Rabe, F. Kreller and F. Henneberger, Appl. Phys. Lett., 1999, 74, 2489–2491 CrossRef CAS.
- L. C. Hirst, M. K. Yakes, C. G. Bailey, J. G. Tischler, M. P. Lumb, M. Gonzalez, M. F. Fuhrer, N. J. Ekins-Daukes and R. J. Walters, IEEE J. Photovoltaics, 2014, 4, 1526–1531 Search PubMed.
- L. C. Hirst, H. Fujii, Y. Wang, M. Sugiyama and N. J. Ekins-Daukes, IEEE J. Photovoltaics, 2014, 4, 244–252 Search PubMed.
- M. Pelton, Y. Wang, I. Fedin, D. V. Talapin and S. K. O'Leary, J. Phys. Chem. C, 2019, 124, 1020–1026 CrossRef.
- E. Kioupakis, P. Rinke, K. T. Delaney and C. G. Van de Walle, Appl. Phys. Lett., 2011, 98, 161107 CrossRef.
- E. Kioupakis, D. Steiauf, P. Rinke, K. T. Delaney and C. G. Van de Walle, Phys. Rev. B: Condens. Matter Mater. Phys., 2015, 92, 035207 CrossRef.
- H. Wen, B. Pinkie and E. Bellotti, J. Appl. Phys., 2015, 118, 015702 CrossRef.
- A. J. Nozik, Chem. Phys. Lett., 2008, 457, 3–11 CrossRef CAS.
- M. C. Beard, J. Phys. Chem. Lett., 2011, 2, 1282–1288 CrossRef CAS PubMed.
- R. D. Schaller, V. M. Agranovich and V. I. Klimov, Nat. Phys., 2005, 1, 189–194 Search PubMed.
- Y. Zhang, L. Tang, K. Lin, P. Wang and C. Xu, Jpn. J. Appl. Phys., 2019, 58, 010903 CrossRef.
Footnote |
| † Electronic supplementary information (ESI) available. See DOI: https://doi.org/10.1039/d3na00557g |
| This journal is © The Royal Society of Chemistry 2023 |

