 Open Access Article
Elucidating the rate-determining step of ammonia decomposition on Ru-based catalysts using ab initio-grounded microkinetic modeling†
Shekhar R.
Kulkarni‡
a,
Natalia
Realpe‡
 a,
Attada
Yerrayya
a,
Vijay Kumar
Velisoju
a,
Attada
Yerrayya
a,
Vijay Kumar
Velisoju
 a,
Salvador
Sayas
 a,
Natalia
Morlanes
 a,
Jose
Cerillo
 a,
Sai P.
Katikaneni
b,
Stephen N.
Paglieri
b,
Bandar
Solami
b,
Jorge
Gascon
 a and
Pedro
Castaño
 *a
*a
aKAUST Catalysis Center (KCC), King Abdullah University of Science and Technology (KAUST), Thuwal 23955-6900, Saudi Arabia. E-mail: pedro.castano@kaust.edu.sa
bCarbon Management R&D Division, Research and Development Center, Saudi Aramco, Dhahran, 31311 Saudi Arabia
First published on 8th February 2023
Abstract
Decarbonizing the current energy system requires a shift toward renewable energy sources, among which ammonia is a remarkable hydrogen carrier. However, developing an efficient process for the catalytic decomposition of ammonia is still required. Here, we propose a combined modeling–experimental approach to elucidate the rate-determining step in ammonia decomposition on Ru-based catalysts. We characterize and test two supported Ru and Ru–K catalysts in the reaction. We develop several microkinetic models based on ab initio calculations considering different rate-determining steps and validate them with the results of packed bed experiments. For the method validation, we develop a fitting strategy based on modifying the lowest number of parameters from those initially obtained theoretically. A good agreement between the simulated and measured experimental ammonia conversions is obtained, thus widening our understanding of this critical hydrogen production process. The approach presented here allows distinguishing the rate-determining step accurately, and it could be applied to other catalytic systems used in ammonia decomposition to avoid over-relying on empirical models.
1. Introduction
The catalytic decomposition of ammonia (NH3) has become a promising alternative over conventional reforming methods for on-site, high-pressure, high-purity hydrogen (H2) generation. As an energy carrier, NH3 is gathering increasing attention because of its high volumetric energy density, higher than that of some hydrocarbons such as methanol,1 and well-established transportation and distribution networks.2 Nevertheless, its most attractive feature is that high-purity, carbon-free H2 can be obtained via NH3 decomposition under relatively milder operating conditions of 400–600 °C and atmospheric pressure through a reverse Haber–Bosch process.3,4 Moreover, this endothermic reaction (−ΔHr = 46 kJ mol−1) produces H2 free from impurities that can be detrimental to potential applications involving fuel cells, where even traces of CO and CO2 are poisonous.5The NH3 decomposition reaction is limited by the thermodynamic equilibrium, especially at high temperatures, which are necessary to overcome the reaction endothermicity. To circumvent these limitations, reactors fitted with H2-selective membranes have been designed and experimentally tested. The selective and continuous removal of the generated H2, delivered between 1 and 15 bar,2,6,7 shifts the equilibrium toward the products. Moreover, the separation of pure H2 from the generated nitrogen (N2) or unreacted NH3 is required because both impurities are detrimental to H2 use and further applications. Despite the benefits of membrane reactors for this process, most new fundamental studies rely on conventional packed bed reactors to evaluate novel catalyst formulations.8–10 To this aim, deepening the fundamental understanding of NH3 decomposition via modeling is essential.
Single-metal catalysts have been predominantly used to study NH3 decomposition because they can be easily simulated by density functional theory (DFT) calculations owing to their simplicity.11,12 These calculations provide valuable insights into the kinetic mechanism of NH3 decomposition13–15 and the binding energies for N2 desorption, as well as laying the basis for the rational design of catalysts.16,17 Some DFT studies have also investigated multimetal-based catalysts, which can theoretically perform similarly to the benchmark Ru catalysts while being cheaper.18 Thus, DFT is a valuable asset in understanding, designing and evaluating new catalysts for green H2 production via catalytic NH3 decomposition.
Ruthenium, the most active metal for NH3 decomposition,19 shows the highest reaction rate in the volcano plot of NH3 decomposition activity vs. N2 binding enthalpy among the studied active phases.13,18 Thus, Ru-based catalysts can reach equilibrium conversion at temperatures below 500 °C and ambient pressure.8 It is also known that alkaline promoters such as Cs, Na, La, and K are essential to improve the performance of Ru-based catalysts further.20 In particular, K as a promoter improves Ru dispersion, thereby inhibiting Ru agglomeration under activation and reaction conditions. In addition, K acts as an electron donor21 and increases the number of adsorption sites for H2.22 Considering that highly conductive supports like carbon nanotubes21 are highly effective for NH3 decomposition, an electron-donating promoter can be expected to enhance the catalytic activity. In fact, by combining Ru with K, the competitive adsorption of H2 is reduced and the hydrogenation capability is decreased. Thus, it would be interesting to gain more insight into the promoting effect of K in this type of catalyst using ab initio calculations.
NH3 decomposition proceeds on the catalyst surface through adsorption, sequential H abstractions, and desorption of N2 and H2. In this process, three reactions can be envisaged as plausible rate-determining steps (RDSs): NH3 dissociation, NH dissociation, and N2 desorption.23 Although it is generally believed that N2 desorption is the RDS for Ru-based catalysts, other steps have also been proposed (see selected examples in Fig. 1).
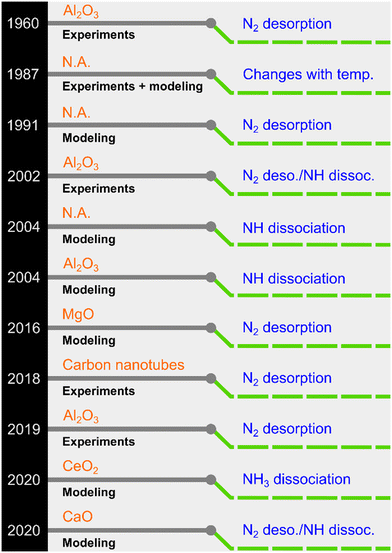 | ||
| Fig. 1 A chronology of previously proposed rate-determining steps for Ru-based NH3 decomposition catalysts (N.A.: ESI† not explicitly provided in the original work). | ||
Owing to its simplicity, the Temkin–Pyzhev model (or modifications thereof) is extensively used to express the decomposition kinetics mathematically. The resulting rate expression contains a positive NH3 concentration/partial pressure order (a) and a negative H2 concentration/partial pressure order (b).24,25 However, the model is derived by inherently assuming that the associative N2 desorption is the RDS. Therefore, the reverse reaction of N2 decomposition is ignored, and a power-law rate expression is built for which the relation a = −0.67b holds. Although this model works for most active phases, experimental and, particularly, modeling studies have demonstrated deviations, as partly summarized in Fig. 1, in which N2 desorption is not the RDS. Thus, the approach of using the Temkin–Pyzhev model and implicitly assuming an RDS needs to be revisited from the viewpoint of the reaction microkinetics. In this context, the experimental–modeling work of Ganley et al.26 represents a landmark because it revealed that Ru (along with Ni) occupies a position near the intersection of two possible RDSs in a turnover frequency vs. N–H bond scission plot. Therefore, predicting the RDS for Ru-based catalysts is a challenging task. Sayas et al.8 recently confirmed this hypothesis and showed that it was difficult to elucidate the RDS for an Ru–K/CaO catalyst. The proposed mechanistic models for the two possible RDSs, i.e., N2 desorption and N–H scission, afforded identical predictions against their lab-scale experimental data. Moreover, a power-law rate model (non-Temkin–Pyzhev, i.e., a ≠ −0.67b) offered the most straightforward and robust kinetic expression for the decomposition reaction among the detailed kinetic models. Despite the efforts devoted to unveiling the RDS for Ru-based catalysts via DFT and kinetic modeling studies, no conclusive answer has been reached yet. Similar results were obtained for Fe-based catalysts in a systematic experimental–modeling study.27 In this regard, we recently showed through extensive experimental data fitting for various catalysts that a non-Temkin–Pyzhev kinetic expression containing the equilibrium constant can represent the reaction kinetics for the high-pressure production of H2.28
To unravel the disparity related to the RDS, each catalytic system needs a closer look using multiple approaches above and beyond the classical Temkin–Pyzhev model.29 The problem of misidentifying the RDS also goes hand in hand with regarding N as the most abundant reaction intermediate, which contrasts with the observations of several modeling studies.23,30,31 Additionally, the temperature and NH3 feed concentration greatly impact the surface species, thereby determining the most abundant reaction intermediate and, in turn, the RDS. A subsequent deviation from the Temkin–Pyzhev model is once again needed.32
Herein, we present an ab initio-grounded microkinetic modeling strategy for determining the RDS in the NH3 decomposition reaction on Ru/CaO and Ru–K/CaO catalysts. In this combined experimental and modeling approach, we edit the parameters of first-principle calculations to reproduce the experimental results and discuss a plausible RDS for NH3 decomposition. Three commonly considered RDSs are evaluated using differential and integral reactor models depending on the catalyst used. Using the derived microkinetic rate expression, without assuming relevant–irrelevant adsorbed species, the RDS can be predicted. We also examine the role of K as a promoter by systematically analyzing the species coverages for the two catalysts, leading to dissimilar experimental performances. The presented approach, a deviation from the classical Temkin–Pyzhev methodology, relies on combinations of ab initio calculations, lab-scale experiments, and appropriate reactor modeling to express the NH3 decomposition kinetics.
2. Methods
2.1 Catalyst synthesis and characterization
As the Ru precursor, rehydrated RuCl3 (Aldrich) was selected and incorporated onto a CaO support via incipient wetness impregnation using acetone for the Ru/CaO catalyst. For the Ru–K/CaO catalyst, after drying the Ru/CaO powder at 60 °C for 3 h, followed by thermal treatment under Ar at 500 °C for 3 h, a K promoter was introduced via incipient wetness impregnation using KOH in ethanol. Finally, a second thermal treatment was performed under Ar at 500 °C for 3 h to produce the desired Ru–K/CaO catalyst. The optimized catalyst compositions were 3%Ru/CaO and 3%Ru–10%K/CaO, respectively. More details about the catalyst synthesis protocols can be found in the ESI† in Fig. S1.Transmission electron microscopy (TEM) of the samples was performed with a Titan Themis-Z microscope (Thermo-Fisher Scientific) operated at an accelerating voltage of 300 kV and a beam current of 0.5 mA.
NH3 temperature-programmed desorption (NH3-TPD) measurements were conducted using an Altamira AMI-200ip equipment. The catalyst (0.1 g) was reduced in H2 at 500 °C for 1 h, cooled to 150 °C under H2, and purged with an Ar flow for 0.5 h. After adsorbing NH3 for 1 h at 100 °C, the sample was flushed in Ar for 0.5 h to remove the physisorbed NH3. Finally, the temperature was increased linearly from 50 °C to 500 °C at a heating rate of 10 °C min−1 using Ar as a carrier gas, and the effluent was analyzed using a mass spectrometer. The results were analyzed according to a previously developed methodology, using eqn (1) to calculate the desorption energy (Edes):33
 | (1) |
2.2 NH3 decomposition experiments
Owing to the dampening effect of high pressure on NH3 conversion, only the experimental data at atmospheric pressure was considered in this work for the modeling and fitting. The reaction temperature (200–500 °C), space velocity (9000–30![[thin space (1/6-em)]](https://www.rsc.org/images/entities/char_2009.gif) 000 mL gcat−1 h−1), and partial pressures of feed NH3 and H2 (0–1 atm) were varied to obtain information about NH3 conversion in a lab-scale packed bed reactor. An alumina coated-stainless steel reactor (PID Microactivity Reference system) with an internal diameter of 9 mm and a length of 170 mm was filled with 0.1 g catalyst sieved between 300 and 500 μm and 1 g SiC mixture to ensure a uniform heat distribution and avoid cold spots during the reaction. Ar was used as an internal standard, and the product stream was analyzed using a micro-gas chromatograph (micro-GC, 3000A, Agilent). Before the experiments, the catalyst was activated in situ with H2 at 500 °C for 3 h. The effect of H2 and NH3 feed partial pressures was only examined on the Ru–K/CaO catalyst because of its higher activity. In total, 15 and 72 unique experimental data points were obtained for the Ru/CaO and Ru–K/CaO catalysts, respectively. Additional experimental details can be found in the works of Sayas et al.,8 while the specific operating conditions are further listed in the captions.
000 mL gcat−1 h−1), and partial pressures of feed NH3 and H2 (0–1 atm) were varied to obtain information about NH3 conversion in a lab-scale packed bed reactor. An alumina coated-stainless steel reactor (PID Microactivity Reference system) with an internal diameter of 9 mm and a length of 170 mm was filled with 0.1 g catalyst sieved between 300 and 500 μm and 1 g SiC mixture to ensure a uniform heat distribution and avoid cold spots during the reaction. Ar was used as an internal standard, and the product stream was analyzed using a micro-gas chromatograph (micro-GC, 3000A, Agilent). Before the experiments, the catalyst was activated in situ with H2 at 500 °C for 3 h. The effect of H2 and NH3 feed partial pressures was only examined on the Ru–K/CaO catalyst because of its higher activity. In total, 15 and 72 unique experimental data points were obtained for the Ru/CaO and Ru–K/CaO catalysts, respectively. Additional experimental details can be found in the works of Sayas et al.,8 while the specific operating conditions are further listed in the captions.
2.3 Computational methods
Vienna ab initio simulation package was used to perform first-principles DFT calculations, and material studio and VESTA were used as the visualization software. The electron exchange and correlation interactions were modeled using the generalized gradient approximation36 with the Perdew–Burke–Ernzerhof functional.37 The electron–ion interactions were defined using the projector-augmented wave method. The vdW D3 correction proposed by Grimme was used to consider weak binding systems.38 A plane-wave basis set was used to describe the valence electrons with an energy cut-off of 400 eV. The Brillouin zone, sampled at the Monkhorst–Pack 3 × 3 × 1 k-point grid,39 was used to sample the Ru(111) surface and the Ru2K4 cluster on CaO(111). The choice of Ru-surface for the Ru/CaO catalyst and Ru–K cluster for the Ru–K/CaO catalyst stems from the respective active phases, as identified through multiple characterization techniques used in the original work.8 The Ru(111) surface was modeled as a four-layer slab using a 3 × 3 supercell with 15 Å of vacuum between the slabs. The bottom two layers were fixed, and the top two layers and adsorbates were relaxed. The CaO(111) surface was modeled as two layers, the bottom layer was fixed, and the top layer was relaxed. The equilibrium geometries were reached for all total energy optimizations once the atomic forces on every atom were smaller than 0.05 eV Å−1 with a total energy convergence criterion of 1.0 × 10⁻⁶ eV. For the gas phase molecule, a cubic box of 15 × 15 × 15 Å3 was used. The transition states of the NH3 decomposition elementary reaction steps were identified using the climbing nudged energy band method. The catalyst characterization results40 indicated that Ru possessed a (111) surface plane. With the addition of K promoter to Ru, an Ru2K4 cluster was formed. As expected, CaO had a negligible effect on the Ru catalysts having pure surfaces compared with those with K-promoted surfaces. Therefore, the CaO(111) surface was used for the Ru–K catalyst.To explain the surface chemistry of NH3 decomposition on the Ru(111) surface and the Ru–K cluster, the adsorption energy (Eads) and the reaction pathway were analyzed using DFT calculations. The following equation was used to calculate the Eads of the species involved in the NH3 decomposition mechanism, i.e., reactants, intermediates, and products:41,42
| Eads = Eadsorbate+Ru(111) − Eadsorbate − ERu(111) | (2) |
The coadsorption energies of adsorbates were calculated using eqn (3):43
| Ecoads = E(a1+a2)/Ru(111) − Ea1 − Ea2 − ERu(111) | (3) |
To understand the mechanism of NH3 decomposition, the transition states of various elementary steps were studied, which afforded the activation energies (EDFT) and reaction energies (Er) according to the following equations:
| EDFT = ETS − EIS | (4) |
| Er = EFS − EIS | (5) |
2.4 Microkinetic modeling
For the microkinetic modeling, it was assumed that (i) all the species generated during the reactions are kinetically relevant, (ii) the surface is energetically uniform and the slow steps are partially reversible, and (iii) the surface sites are energetically uniform, i.e., the adsorption of the species follows the Langmuir isotherm. Table 1 summarizes the series of reactions involved in the catalytic NH3 decomposition, with the starting point being the adsorption of an NH3 molecule on the catalyst surface.The rate constants corresponding to these reactions can be expressed as follows:
 | (6) |
 | (7) |
 | (8) |
Case A corresponds to NH3 dissociation; case B represents N2 desorption; while case C covers NH dissociation as the rate-determining step. The corresponding rate expressions, as obtained from the reaction microkinetics are presented further:
Case A:
 | (9) |
 | (10) |
 | (11) |
2.5 Fitting for a packed bed reactor
A one-dimensional model for a packed bed reactor was derived on the basis of the following simplifying assumptions: (i) steady-state operation, (ii) flow only along the axial direction of the reactor with no radial dispersion, (iii) isothermal operation, and (iv) negligible pressure drop along the axial direction of the reactor. For a packed bed reactor, the molar flow rate for each component in the reaction can be expressed as follows: | (12) |
Parametric estimation was performed using the fminsearch function of Matlab, which finds the minimum of an unconstrained multivariable function using the derivative-free method, setting the sum of the squared residuals between the experimental data and the calculated data as the objective function. The NH3 conversion described by eqn (13) was used as the fitting variable. The differential equations were solved using the ode45 Matlab subroutine. The DFT-calculated values of the activation energies (EDFT) were used as the seeding values to the optimization program and to recalculate these into Ecalc.
 | (13) |
 | (14) |
 | (15) |
3. Results and discussion
3.1 Catalyst characterization
The NH3-TPD profiles (Fig. 2) of the supported Ru samples with and without K were recorded at a heating rate of 10 K min−1 after the reduction of the catalysts and subsequent NH3 adsorption for 30 min at 100 °C. Both catalysts show similar desorption patterns, but the Tmax of the sample with K is lower. The Ru–K/CaO catalyst exhibits a lower Edes (206.2 kJ mol−1) than the Ru/CaO catalyst (Edes = 222.1 kJ mol−1), indicating that the presence of K in the sample lowers the activation barrier for the NH3 sorption process compared with the K-free Ru surface. As will be discussed later, these experimental results agree with the DFT theoretical calculations and suggest the superior catalytic activity of the K-based catalyst for NH3 decomposition.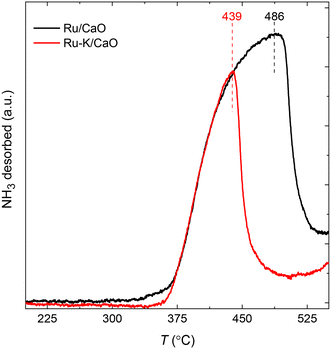 | ||
| Fig. 2 NH3 temperature-programmed desorption profiles of Ru/CaO and Ru–K/CaO catalysts after reduction at 500 °C. | ||
The morphology of both catalysts was analyzed using high-resolution transmission electron microscopy (HR-TEM) coupled with energy-dispersive X-ray spectroscopy (EDX) (Fig. S2†). The EDX analysis of both samples confirmed that the respective elements were present in the catalysts. TEM images of both the catalysts after reduction in H2 flow at 500 °C for 3 h showed a fine distribution of Ru nanoparticles in the catalysts. However, in relative comparison, the doping of K in Ru/CaO resulted in a better dispersion with an average particle size of ∼7 nm (with narrow distribution) compared to 9 nm for Ru/CaO. In addition, our previous8 mapping results confirmed the presence of K throughout the catalyst surface, preferably located on top of the Ru nanoparticles.
3.2 DFT calculations
Four adsorption sites were examined for each adsorbate, i.e., top, hcp, fcc, and bridge sites. The potential energy surface profile of H-abstraction from (y = 1–3) on Ru(111) and the Ru–K cluster is shown in Fig. 3. The structures of the initial, transition, and final states of all the elementary reactions on the Ru(111) surface and the Ru–K cluster are depicted in Fig. 4, and their most stable structures are shown in Fig. S3 and S4.† The decomposition of NH3 proceeds through the following steps: NH3 adsorption, H-abstraction from NHy (y = 1–3), and associative desorption of N2 and H2. The Eads values of NH3 on Ru(111) and Ru–K(111) are −0.24 and −0.04 eV, respectively. The NH3 molecule is preferentially adsorbed on the top site of the metal surface and the cluster. The N–H and Ru–H bond lengths on Ru(111) are 1.023 and 2.212 Å, respectively, and the H–N–H bond angles are 108.1° and 108.6° on Ru(111) and the Ru–K cluster, respectively. The bond lengths and angles are close to those of NH3 in the gas phase (1.029 Å and 107.3°, respectively), indicating that the geometrical parameters remain virtually unaltered during the NH3 adsorption on the metal surface.44,45 The
  species is favorably adsorbed on both the bridge and the fcc site (hollow site) of the surface. The Eads is slightly higher for the Ru–K cluster (−3.59 eV) than for the Ru(111) surface (−3.08 eV). The most stable adsorption site is fcc in the case of the adsorption of NH. The Eads of NH is −4.97 on the Ru(111) surface and −5.29 eV on the Ru–K cluster, and the N–H and Ru–K bond lengths are 1.022 and 1.985 Å, respectively. Meanwhile, the adsorption of N* on the Ru–K cluster is almost 0.7 eV higher than on the Ru(111) surface, which means that the interaction of N* with K is stronger than that with Ru. It should be noted that the N* adatom acts as a descriptor for NHy dehydrogenation reactions. The Eads values of NHy (y = 0–3) on both surfaces follow the order: N* > NH* >
  >
>  ; thus, the presence of fewer H atoms in NHy renders the metal atoms more prone to adsorption.11,43,46 Ru(111) and Ru–K clusters prefer fcc sites for H-adsorption, corresponding to Eads of −2.87 and −3.1 eV, respectively. For H2 and N2, the most stable adsorption site is the top site. The H–H and N–N bonds are perpendicular to the surface and the cluster during the adsorption, which agrees with the literature.47,48 The Eads of N2 is −0.7 eV for Ru(111) and −1.72 eV for the Ru–K cluster.
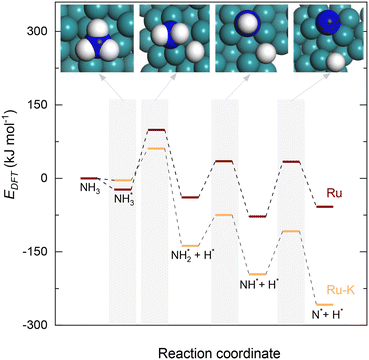 | ||
| Fig. 3 Potential energy surface profile of the dehydrogenation of NHy (y = 1–3) on Ru(111) and the corresponding transition states and Ru–K/CaO(111). The respective transition states of which are depicted in Fig. 4. | ||
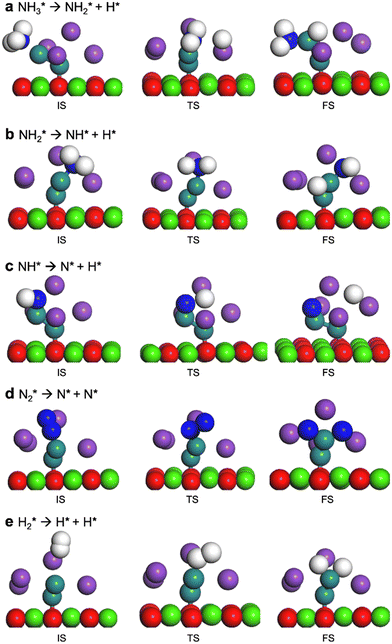 | ||
| Fig. 4 Optimized structures of the initial, transition, and final states on the Ru–K/CaO(111) surface. | ||
The most stable coadsorbed structures of  (y = 0–3) and H* on Ru(111) surfaces, i.e.,
  /H* (bridge/fcc), NH*/H* (fcc/fcc), N*/H* (fcc/fcc), and N*/N* (fcc/fcc), are depicted in Fig. S1.† The Ecoads of
  + H*, NH* + H*, N* + H*, and N* + N* on the Ru–K cluster are −6.95, −8.52, −9.81, and −12.63 eV, respectively. Table 2 shows that these values are higher than those for the Ru(111) surface. The sum of the individual energies is higher than the Ecoads for the Ru(111) surface, indicating a repulsive interaction between individual adsorbates, which agrees with the literature.44,45,48
| Species | Site | Ru(111)a | Ru(111)b | Ru–Kb |
|---|---|---|---|---|
| a US potential. b PBE. | ||||

|
Top | −0.88 | −0.24 | −0.04 |

|
Bridge | −3.05 | −3.08 | −3.59 |
| NH* | fcc | −4.94 | −4.97 | −5.29 |
| N* | fcc | −5.54 | −5.83 | −6.51 |
| H* | fcc | −2.89 | −2.87 | −3.1 |
| N2 | Top | −0.66 | −0.70 | −1.72 |
 + H* + H* |
Bridge + fcc | −6.79 | −5.95 | −6.95 |
| NH* + H* | fcc + fcc | −7.26 | −7.82 | −8.52 |
| N* + H* | fcc + fcc | −7.88 | −8.64 | −9.81 |
| N* + N* | fcc + fcc | −11.94 | −11.52 | −12.63 |
Upon the cleavage of the H* atom from  to form
  and H* via dehydrogenation, the formed
  moves to the bridge site, and the H* atom is adsorbed on the fcc site. This process proceeds through a transition state with an energy barrier of 1.27 eV in the case of the Ru(111) surface and 0.68 eV for the Ru–K cluster, which is lower than that of some of the reported studies.34,49,50 The N–H bond length increases from 1.023 to 1.46 Å at the transition state. The first dehydrogenation reaction is exothermic on the Ru(111) surface and the Ru–K cluster. The second step is the dehydrogenation of
  to generate NH* and H*, for which the energy barrier is 0.77 eV for Ru(111) and 0.66 eV for the Ru–K cluster, and the respective reaction energies are −0.41 and −0.6 eV, which means that the reaction is exothermic. The reported values of the energy barrier for this reaction are 0.73 eV on Cu(100),51 0.59 eV on Ni(111),11 1.63 eV on Ni(100), 1.59 eV on (Cu(111),43 1.54 on Pd(111),43 0.24 eV on Fe(110),11 and 0.21 eV on Co(111).11 NH* and H* are adsorbed on neighboring fcc sites. The formed NH* can further decompose to N* and H*, the H* adatom is adsorbed on the adjacent fcc site, and the N* atom remains on the same site. The energy barrier required to form N* and H* on the Ru(111) surface is 1.17 eV, and the reaction energy is 0.21 eV, which is endothermic.
In contrast, adding K to the catalyst reduces the energy barrier from 1.17 to 0.92 eV, and the reaction energy shows an exothermic value of −0.65 eV (Fig. 1). The recombination of the formed N atoms from the decomposition of NH to form N2 shows an energy barrier of 1.82 eV in the case of the Ru(111) surface and 1.24 eV for the Ru–K cluster. This decrease in the energy barrier can be attributed to the surface structural and electronic effects derived from the presence of neighboring atoms Ru and K, as was previously reported by Sayas et al.8 The associative desorption of H atoms to form H2 proceeds with an energy barrier of 1.22 eV on Ru(111) and 1.88 eV on the Ru–K cluster. The forward reaction is exothermic with reaction energies values of −1.22 and −1.73 eV on Ru(111) and Ru–K, respectively.
Overall, the stepwise dehydrogenation of NH3 preferentially occurs on the Ru–K cluster, which is thermodynamically and kinetically favorable. The Eads values are consistent with the literature regardless of the metal surface.11,34,43–45,49,50 For instance, the energy barrier for the associative desorption of N on the Ru(111) surface and the Ru–K cluster is much lower than the values of 2.51 eV on Ru(001),31 2.56 eV on Mo2N(100),52 3.22 eV on MoN(100),52 2.85 eV on Fe(100),11 1.86 eV on Ni(111),11 and 1.86 eV on Co(111)11 surfaces. The obtained results suggest that the associative desorption of N on the Ru(111) surface and the Ru–K cluster occurs easily compared with that on other metals. In the case of the Ru(111) surface, the RDS is the associative desorption of N*.
3.3 Ru/CaO catalyst
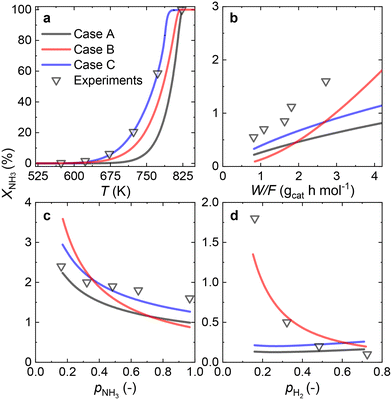
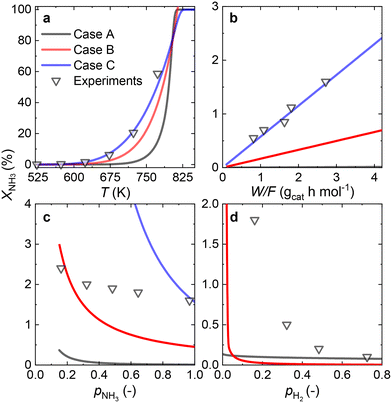
Since most of the experimental data gathered for the Ru/CaO catalyst falls within the low values of NH3 conversion, two approaches can be considered for RDS prediction: differential reactor modeling and integral reactor modeling.Both approaches predict that NH dissociation (Case C) is the most probable RDS for NH3 decomposition on the Ru/CaO catalyst for the experimental data obtained using a laboratory-scale packed bed reactor.
3.4 Ru–K/CaO catalyst
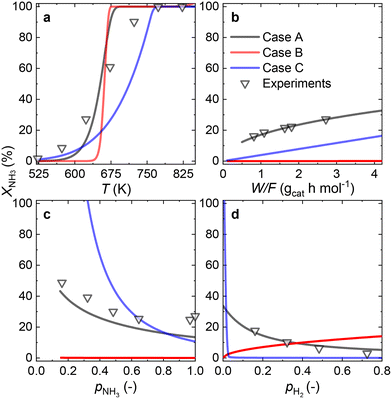
Owing to the high NH3 conversions (>25%) observed for the Ru–K/CaO catalyst for most of the operating conditions, by definition, only the integral reactor model can be implemented. Fig. 7 compares the results of the experimental data fitting for the Ru–K/CaO catalyst using the integral approach. Similar to the K-free Ru catalyst, all the cases considered predict well the S-shaped behavior of the NH3 conversion.Case B could not be the RDS due to a poor overall fitting across the tested experimental variables (R2 = 0.95). Case C matches most experimental data except for the variation in H2 partial pressure (R2 = 0.68). Case A shows the best match for all the variables, giving a near-perfect prediction for NH3 conversion across a wide range of conditions (R2 = 0.99). According to the good fitting results and the values of the optimized activation energies, NH3 dissociation (Case A) can be proposed as the RDS over the Ru–K/CaO catalyst. Table S3† presents the variance of fitted activation energies compared with the DFT-predicted values. The integral approach presented here can successfully predict the RDS for Ru/CaO and Ru–K/CaO catalysts. However, owing to its higher activity than the K-free catalyst, the differential approach is not suitable for predicting the RDS for the Ru–K catalyst.
Fig. 8 summarizes the differences in activation energies between DFT-calculated values (EDFT) and the corresponding recalculated using the fitting methodology (Ecalc). Fig. 8(a) and (b) are values with the proposed rate-determining steps (Cases A–C) for Ru/CaO and Ru–K/CaO catalysts, respectively. Following trends are observed regarding DFT calculations: Case A, for both the catalysts, typically underpredicts the forward and over-predicts the backward reaction activation energies. While both Case B and Case C mostly overpredict both the forward and the backward reaction activation energies. The experimental non-idealities exist on the catalyst and reactor-scale non-homogeneities, while the DFT simulates ammonia decomposition in a model environment and allows idealistic molecule-active phase interactions. Despite these disparities in the two scales of operations, the modeling-fitted activation energies are relatively similar to the DFT calculated ones, underlining the validity and scalability of the approach that is based on coupling DFT and microkinetics. While focusing on the respective proposed RDSs, delta E values of the Ru/CaO catalyst are higher (∼90 kJ mol−1) against those of Ru–K/CaO (∼35 kJ mol−1);8 which could further be related to the reduced activation energies upon K-promotion as initially reported.
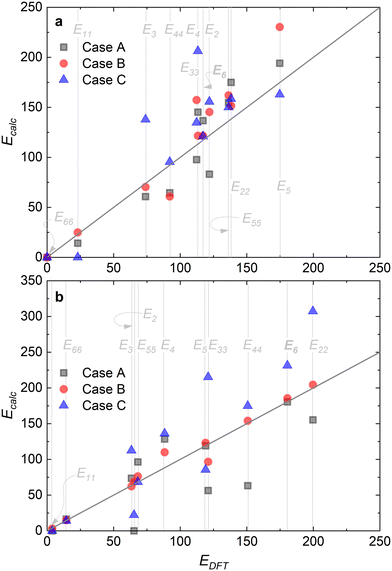 | ||
| Fig. 8 Comparison via parity plots of the DFT-calculated activation energies (EDFT) and those predicted via fitting (Ecalc): (a) Ru/CaO; (b) Ru–K/CaO. | ||
3.5 Coverages of species
With the activation energies obtained for the RDSs for both catalysts in hand, the fractional coverages of each species (θi) can be calculated. The results for both catalysts at steady-state conditions (case C for the Ru/CaO and case A for the Ru–K/CaO catalyst) are represented in Fig. 9. For each of the cases considered, while solving the differential equations of species balance, time is noted for which all the coverages reach a steady value. According to the DFT-calculated activation energies, the system takes ∼0.1 s to achieve stable coverages and 0.2 and 0.3 s, respectively, for K-free (case C) and K-promoted Ru catalysts (case A).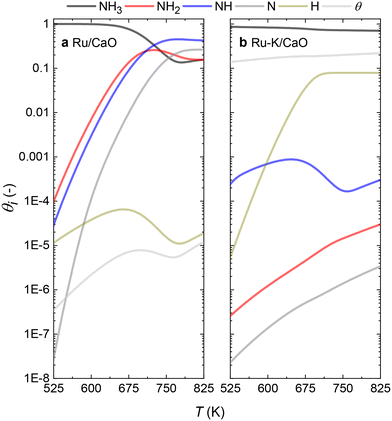 | ||
| Fig. 9 Comparison of the species coverage at the steady state on (a) Ru/CaO; Case C (NH dissociation) and (b) Ru–K/CaO; Case A (NH3 dissociation) as the rate-determining steps, respectively. | ||
The steady state is reached at different time scales for the Ru and Ru–K catalysts, consistent with the experimentally observed decrease in the Ecalc for the latter. For the coverages corresponding to the NH dissociation as RDS for the Ru/CaO catalyst, the catalyst surface is fully occupied by  species at lower temperatures, indicating a lack of catalytic activity. However, the
  species drastically disappear at higher temperatures from the surface and are mainly replaced with NH* species. Under these conditions, N* and
  species are also abundant; the former stems from the partial reaction and the latter from inhibiting the reaction due to the presence of abundant NH* species. From a microkinetic point of view, when NH dissociation is the RDS, the reaction progression toward the formation of N* and H* species and eventually toward the products is inhibited by the occupancy of the catalyst sites by NH* species. The simulated coverages presented in Fig. 9(a) represent well the case for the Ru/CaO catalyst under study in the present work. It is predicted that the H* coverage and free sites are negligible.
Adding K to the catalyst considerably changes the catalyst surface at low and high temperatures. Irrespective of the reaction temperature, the surface is majorly covered by  species, with the rest remaining as free sites, demonstrating the effect of the promotion of the noble metal with K on the reaction mechanism. According to the sequential reaction mechanism at the microkinetic scale leading to product desorption, no
  , NH*, and N* species are present on the catalyst surface; there are only traces of H* species at a higher temperature, which is in accord with previous reports showing that the addition of K increases the number of H-adsorption sites.22 Thus, the coverage analysis provides a unique insight into the role of K as a promoter, which enhances the NH3 decomposition performance by altering the RDS at the microkinetic level.
Fig. 10 collectively compares the potential surfaces for the three RDSs studied for both catalysts. For all the cases, adding K to the catalyst leads to the formation of Ru–K clusters and favors the decomposition reaction thermodynamically. The DFT-predicted transition states depicted in Fig. 4 differ from those in Fig. 10 due to differences in the reaction potentials of the Ecalc obtained using the present approach. However, the exact nature of each transition state is not significant compared with their progression.
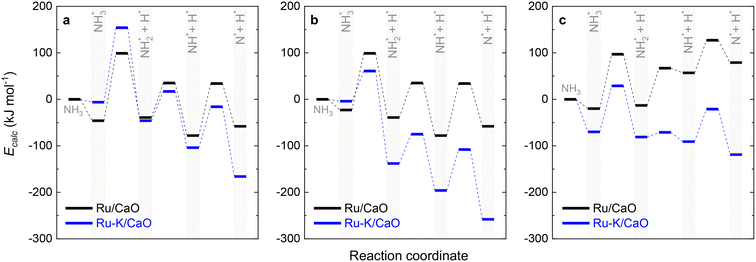 | ||
| Fig. 10 Potential surface diagrams considering the obtained activation energies from the fitted models: (a) Case A (NH3 dissociation); (b) Case B (N2 desorption); and (c) Case C (NH dissociation). | ||
4. Conclusions
An experimentally validated modeling approach comprising DFT calculations, microkinetic modeling, and fitting is presented to investigate the catalytic NH3 conversion to pure H2 over Ru/CaO and Ru–K/CaO catalysts.Catalyst characterization showed a lowered activation barrier for the NH3 sorption process on the Ru–K/CaO catalyst. Theoretical calculations revealed the most stable catalyst–adatom structures formed during NH3 decomposition for both catalysts. Fitting of the experimental data in the first step predicted NH dissociation as the RDS for the Ru/CaO catalyst, whereas NH3 dissociation is the RDS for the Ru–K/CaO catalyst. The predicted RDSs for these catalysts differ from those proposed in the literature, partly due to an overreliance on the Temkin–Pyzhev model and a lack of combined DFT/microkinetic-based reaction analyses. Finally, comparing the species coverages predicted by the microkinetic model sheds light on the role of K promotion, revealing that the addition of K to the catalyst alters its surface and selectively, promoting the N2 desorption and thereby altering the RDS.
Unlike the empirically derived Temkin–Pyzhev model, the approach presented in this work is purely based on ab initio theories and can thus offer a new platform for the design of improved catalysts for NH3 decomposition.
Nomenclature
Abbreviations
| RDS | Rate-determining step |
| DFT | Density functional theory |
| TPD | Temperature-programmed desorption |
| SSR | Residual sum of squares |
Nomenclature
| a | Ammonia reaction order (−) |
| b | Hydrogen reaction order (−) |
| E des | Desorption energy (kJ mol−1) |
| R | Universal gas constant (8.314 kJ mol−1 K−1) |
| T | Temperature (K) |
| T max | Maximum desorption temperature (K) |
| β | Heating rate (K min−1) |
| ν | Pre-exponential factor (1013 s−1 assuming first-order kinetics) |
| E (a1+a2)/Ru(111) | Total energy of adsorbed adsorbates on Ru(111) surface (kJ mol−1) |
| E a1 | Energy of adsorbate1 in the gas phase (kJ mol−1) |
| E a2 | Energy of adsorbate2 in the gas phase (kJ mol−1) |
| E ads | Adsorption energy of species (kJ mol−1) |
| E adsorbate+Ru(111) | Total adsorption energy on the Ru(111) surface (kJ mol−1) |
| E adsorbate | Adsorption energy in the gas phase (kJ mol−1) |
| E calc | Activation energy calculated by fitting (kJ mol−1) |
| E coads | Coadsorption energy of adsorbates (kJ mol−1) |
| E DFT | Activation energy calculated by DFT (kJ mol−1) |
| E FS | Potential energy of the final state (kJ mol−1) |
| E IS | Potential energy of the initial state (kJ mol−1) |
| E TS | Potential energy of the transition state (kJ mol−1) |
| E Ru(111) | Adsorption energy on the bare Ru(111) surface (kJ mol−1) |
| F | Flow rate (mL min−1) |
| F NH3,0 | Ammonia feed flow rate (mL min−1) |
| k i | Forward reaction rate (s−1) |
| k ii | Backward reaction rate (s−1) |
| K i | Equilibrium rate constant (−) |
| P | Pressure (atm) |
| V | Reactor volume (mL) |
| W cat | Catalyst mass (g) |
| W/F | Space velocity (g h−1 molNH3) |
| X NH3 | Ammonia conversion (%) |
| Z | Axial direction (−) |
| θ i | Fractional coverage of each species (−) |
Conflicts of interest
There are no conflicts to declare.Acknowledgements
The authors gratefully acknowledge the financial support provided by Saudi Aramco and the resources and facilities provided by the King Abdullah University of Science and Technology (KAUST). The authors acknowledge the KAUST Supercomputing Laboratory (KSL) for providing high-performance computational resources.References
- S. Mukherjee, S. V. Devaguptapu, A. Sviripa, C. R. F. Lund and G. Wu, Appl. Catal., B, 2018, 226, 162–181 CrossRef CAS.
- N. Itoh, A. Oshima, E. Suga and T. Sato, Catal. Today, 2014, 236, 70–76 CrossRef CAS.
- K. E. Lamb, M. D. Dolan and D. F. Kennedy, Int. J. Hydrogen Energy, 2019, 44, 3580–3593 CrossRef CAS.
- F. Schüth, R. Palkovits, R. Schlögl and D. S. Su, Energy Environ. Sci., 2012, 5, 6278–6289 RSC.
- R. Lan, J. T. S. Irvine and S. Tao, Int. J. Hydrogen Energy, 2012, 37, 1482–1494 CrossRef CAS.
- Z. Zhang, S. Liguori, T. F. Fuerst, J. D. Way and C. A. Wolden, ACS Sustainable Chem. Eng., 2019, 7, 5975–5985 CrossRef CAS.
- J. L. Cerrillo, N. Morlanés, S. R. Kulkarni, N. Realpe, A. Ramírez, S. P. Katikaneni, S. N. Paglieri, K. Lee, A. Harale, B. Solami, A. Jamal, S. Mani Sarathy, P. Castaño and J. Gascon, Chem. Eng. J., 2022, 431, 134310 CrossRef CAS.
- S. Sayas, N. Morlanés, S. P. Katikaneni, A. Harale, B. Solami and J. Gascon, Catal. Sci. Technol., 2020, 10, 5027–5035 RSC.
- N. Morlanés, S. Sayas, G. Shterk, S. P. Katikaneni, A. Harale, B. Solami and J. Gascon, Catal. Sci. Technol., 2021, 11, 3014–3024 RSC.
- M. Pinzón, A. Romero, A. de Lucas Consuegra, A. R. de la Osa and P. Sánchez, J. Ind. Eng. Chem., 2021, 94, 326–335 CrossRef.
- X. Duan, J. Ji, G. Qian, C. Fan, Y. Zhu, X. Zhou, D. Chen and W. Yuan, J. Mol. Catal. A: Chem., 2012, 357, 81–86 CrossRef CAS.
- S. Stolbov and T. S. Rahman, J. Chem. Phys., 2005, 123, 1–6 CrossRef PubMed.
- A. Boisen, S. Dahl, J. K. Nørskov and C. H. Christensen, J. Catal., 2005, 230, 309–312 CrossRef CAS.
- L. Yu and F. Abild-Pedersen, ACS Catal., 2017, 7, 864–871 CrossRef CAS.
- M. D. Esrafili and R. Nurazar, Struct. Chem., 2015, 26, 799–807 CrossRef CAS.
- K. Ogasawara, T. Nakao, K. Kishida, T. N. Ye, Y. Lu, H. Abe, Y. Niwa, M. Sasase, M. Kitano and H. Hosono, ACS Catal., 2021, 11, 11005–11015 CrossRef CAS.
- C. Zhou, K. Wu, H. Huang, C. F. Cao, Y. Luo, C. Q. Chen, L. Lin, C. Au and L. Jiang, ACS Catal., 2021, 11, 10345–10350 CrossRef CAS.
- D. A. Hansgen, D. G. Vlachos and J. G. Chen, Nat. Chem., 2010, 2, 484–489 CrossRef CAS PubMed.
- H. Fang, D. Liu, Y. Luo, Y. Zhou, S. Liang, X. Wang, B. Lin and L. Jiang, ACS Catal., 2022, 12, 3938–3954 CrossRef CAS.
- C. Chen, K. Wu, H. Ren, C. Zhou, Y. Luo, L. Lin, C. Au and L. Jiang, Energy Fuels, 2021, 35, 11693–11706 CrossRef CAS.
- A. K. Hill and L. Torrente-Murciano, Int. J. Hydrogen Energy, 2014, 39, 7646–7654 CrossRef CAS.
- W. Pyrz, R. Vijay, J. Binz, J. Lauterbach and D. J. Buttrey, Top. Catal., 2008, 50, 180–191 CrossRef CAS.
- S. Armenise, E. García-Bordejé, J. L. Valverde, E. Romeo and A. Monzón, Phys. Chem. Chem. Phys., 2013, 15, 12104–12117 RSC.
- K. Lamb, S. S. Hla and M. Dolan, Int. J. Hydrogen Energy, 2019, 44, 3726–3736 CrossRef CAS.
- B. Wang, H. Kong, H. Wang, Y. Wang and X. Hu, Int. J. Hydrogen Energy, 2019, 44, 26874–26887 CrossRef CAS.
- J. C. Ganley, F. S. Thomas, E. G. Seebauer and R. I. Masel, Catal. Lett., 2004, 96, 117–122 CrossRef CAS.
- S. A. Vilekar, I. Fishtik and R. Datta, Chem. Eng. Sci., 2012, 71, 333–344 CrossRef CAS.
- N. Realpe, S. R. Kulkarni, J. L. Cerrillo, N. Morlanés, G. Lezcano, S. P. Katikaneni, S. N. Paglieri, M. Rakib, B. Solami, J. Gascon and P. Castaño, React. Chem. Eng., 2023 10.1039/D2RE00408A , Accepted.
- T. E. Bell and L. Torrente-Murciano, Top. Catal., 2016, 59, 1438–1457 CrossRef CAS.
- S. R. Deshmukh, A. B. Mhadeshwar and D. G. Vlachos, Ind. Eng. Chem. Res., 2004, 43, 2986–2999 CrossRef CAS.
- A. B. Mhadeshwar, J. R. Kitchin, M. A. Barteau and D. G. Vlachos, Catal. Lett., 2004, 96, 13–22 CrossRef CAS.
- V. Prasad, A. M. Karim, A. Arya and D. G. Vlachos, Ind. Eng. Chem. Res., 2009, 48, 5255–5265 CrossRef CAS.
- B. Lin, K. Wei, X. Ma, J. Lin and J. Ni, Catal. Sci. Technol., 2013, 3, 1367–1374 RSC.
- G. Novell-Leruth, A. Valcarcel, J. Pérez-Ramírez and J. M. Ricart, J. Phys. Chem. C, 2007, 111(2), 860–868 CrossRef CAS.
- V. Prasad, A. M. Karim, A. Arya and D. G. Vlachos, Ind. Eng. Chem. Res., 2009, 48, 5255–5265 CrossRef CAS.
- J. P. Perdew, K. Burke and M. Ernzerhof, Phys. Rev. Lett., 1996, 77, 3865–3868 CrossRef CAS PubMed.
- J. P. Perdew, J. A. Chevary, S. H. Vosko, K. A. Jackson, M. R. Pederson, D. J. Singh and C. Fiolhais, Phys. Rev. B: Condens. Matter Mater. Phys., 1993, 48, 4978 CrossRef CAS PubMed.
- S. Grimme, J. Antony, S. Ehrlich and H. Krieg, J. Chem. Phys., 2010, 132, 154104 CrossRef PubMed.
- H. J. Monkhorst and J. D. Pack, Phys. Rev. B: Solid State, 1976, 13, 5188–5192 CrossRef.
- S. Sayas, N. Morlanés, S. P. Katikaneni, A. Harale, B. Solami and J. Gascon, Catal. Sci. Technol., 2020, 10, 5027–5035 RSC.
- L. Gurrala, M. M. Kumar, A. Yerrayya, P. Kandasamy, P. Castaño, T. Raja, G. Pilloni, C. Paek and R. Vinu, Bioresour. Technol., 2022, 344, 126204 CrossRef CAS PubMed.
- N. Morlanés, G. Lezcano, A. Yerrayya, J. Mazumder and P. Castaño, Chem. Eng. J., 2022, 433, 133201 CrossRef.
- Z. Jiang, P. Qin and T. Fang, Chem. Phys., 2014, 445, 59–67 CrossRef CAS.
- W. Huang, W. Lai and D. Xie, Surf. Sci., 2008, 602, 1288–1294 CrossRef CAS.
- Y. Zhang, X. Xiao, Y. Cao, Y. Cai and J. Wang, Int. J. Hydrogen Energy, 2013, 38, 2965–2972 CrossRef CAS.
- X. Gong, Y. Gu, N. Li, H. Zhao, C. Jia and Y. Du, Inorg. Chem., 2016, 55, 3992–3999 CrossRef CAS PubMed.
- J. A. Herron, S. Tonelli and M. Mavrikakis, Surf. Sci., 2012, 606, 1670–1679 CrossRef CAS.
- Z. Jiang, Q. Pan, M. Li, T. Yan and T. Fang, Appl. Surf. Sci., 2014, 292, 494–499 CrossRef CAS.
- C. He, H. Wang, L. Huai and J. Liu, J. Phys. Chem. C, 2012, 116, 24035–24045 CrossRef CAS.
- S. C. Yeo, S. S. Han and H. M. Lee, J. Phys. Chem. C, 2014, 118, 5309–5316 CrossRef CAS.
- F. F. Ma, S. H. Ma, Z. Y. Jiao and X. Q. Dai, Appl. Surf. Sci., 2017, 405, 71–78 CrossRef CAS.
- L. Huo, X. Han, L. Zhang, B. Liu, R. Gao and B. Cao, Appl. Catal., B, 2021, 294, 120254 CrossRef CAS.
Footnotes |
| † Electronic supplementary information (ESI) available. See DOI: https://doi.org/10.1039/d3cy00055a |
| ‡ These authors contributed equally. |
| This journal is © The Royal Society of Chemistry 2023 |


