 Open Access Article
PECD study of a single-conformer molecule: a critical comparison of experiment and theory
D.
Catone
 a,
N.
Zema
a,
T.
Prosperi
a,
M.
Stener
a,
N.
Zema
a,
T.
Prosperi
a,
M.
Stener
 bc,
P.
Decleva
 bc,
P.
Nitti
 b and
S.
Turchini
 *a
*a
aIstituto Struttura della Materia-CNR (ISM-CNR), Via del Fosso del Cavaliere 100, 00133, Roma, Italy. E-mail: stefano.turchini@ism.cnr.it
bDipartimento di Scienze Chimiche, Universith di Trieste, Via L. Giorgieri 1, I-34127 Trieste, Italy
cIstituto Officina dei Materiali-CNR (CNR-IOM), Area Science Park Strada Statale 14 km 163, 5 - 34149 Basovizza, Trieste, Italy
First published on 20th January 2022
Abstract
In this work we address a specific experimental and theoretical question regarding the influence of a conformational population in the modeling of photoelectron circular dichroism (PECD) spectroscopy. In the past two decades, PECD has revealed a rich and complex phenomenology in molecular processes with unprecedented insight, especially in molecular geometry sensitivity. Since the early development of this spectroscopy, theory has pointed out the importance of conformer influence on PECD; in particular, the rotation of methyl groups was surprisingly found to be responsible for strong modulation of the PECD signal. Here, to advance understanding of the effect of rotations, we have chosen to study norcamphor, a single-conformer molecule, as a benchmark for a PECD comparison between experiment and theory at the density functional theory (DFT) and time-dependent density functional theory (TDDFT) levels. The excellent agreement between experimental data and theory for norcamphor sheds light on the influence of rotations and gives a solid explanation for the reasonable qualitative agreement in the PECD of camphor, where three methyl groups are added to the same molecular structure.
Introduction
Most organic molecules present a flexible structure that is amenable to interconvertible bond rotations if the local minima of the potential corresponding to the conformer configurations are populated in accordance with an equilibrium distribution. The presence of conformers has also been reported for supersonic molecular beams due to non-thermodynamic fast cooling that can trap conformers at the minimum of low thermal barriers. Conformers play a role in chemical reactivity1 due to the conformation-dependent electrostatic properties in the long-range interaction potentials. Moreover, with the rise of femtochemistry,2 the possibility of shaping the excited wavepacket to control the intramolecular dynamics opens a new perspective to realize selective reaction pathways that are not accessible to the reaction at the molecular ground state. For this reason, it would be desirable to perform a spectroscopic characterization of the conformational effects in and out of equilibrium states. Nevertheless, if there is, on one hand, a steep rise in exploring new possibilities of enhancing conformational effects, on the other hand the spectroscopic characterization of a mixture of conformers lags behind. In absorption and photoelectron spectroscopy, very often the effects of conformations do not significantly change the spectral features because the cross-sections and ionization energies3 are scarcely affected by the conformer geometry and generally result in broadening within the total experimental resolution, which is difficult to analyze. There are of course notable exceptions, as in the case of proline, where two sets of conformers can be distinguished by means of significantly different ionization energies, which has been thoroughly studied.4–7 Resonant two-photon ionization (R2PI) has generally been more successful at providing a conformational analysis and characterizing the low-energy conformers formed in a supersonic jet expansion.8 Vibrational circular dichroism also displays a selective sensitivity to non-mirror image isomers.9In the past two decades, a new approach to the conformer study of chiral molecules has been explored using photoelectron circular dichroism (PECD), which is an extension of classical UV-IR circular dichroism applied to the VUV-soft X-ray range where photoionization is present. The final state is a photoelectron with a defined kinetic energy and momentum, which allows us to measure the circular dichroism as a two-dimensional dispersion, while circular dichroism in absorption is only measured as a function of the photon energy.
PECD has been measured in almost every sample target compatible with photoelectron spectroscopy, effusive and supersonic molecular beams in the gas phase, and thin films. The asymmetry has the same order of magnitude for valence and core PECD, and it is one order of magnitude larger than the absorption one, because the matrix element is at the electric dipole level.10 Moreover, PECD has been measured using photoelectron photoion spectroscopy,11–14 photoelectron–Auger electron coincindence,15 resonant photoemission,16 multiphotonics photoelectron spectroscopy,17 and femtosecond time-resolved pump–probe experiments.18
Since the beginning it has been clear that PECD is extremely sensitive to conformer geometry19,20 although this result has turned out to be ambivalent: on the one hand, PECD has revealed itself to be a powerful form of spectroscopy that is capable of detecting elusive electronic and structural properties; on the other hand, this sensitivity deeply challenges the theoretical modeling. The dependence of PECD on tiny distortions of geometry is attributed to the partial wave interference of the form sin(ηl − ηl′) in the matrix element,21 where ηl are the generalized phase shifts of the asymptotic wave of photoelectrons for a non-central potential and l and l′ are the angular momenta. For a phase shift of the same order of magnitude the sine can rapidly change sign. It is worth noticing that classical photoemission depends on the cosine of the difference of the phase shifts and near zero is almost constant.
We underline that the rich and complex oscillatory behavior stemming from each state of the molecule represents a serious benchmark for theory. To better focus the aim and results of our work, we summarize the results so far achieved in the study of conformers using PECD. A comparison between valence band spectra and theory in the methyl-oxirane molecule showed excellent agreement between LCAO–B spline theory22 and experiment.23,24 In a subsequent theoretical study the focus was the effect of the conformational geometry on PECD. The most dramatic variation is related to the rotation of the methyl group of methyl-oxirane with variation of the intensity and sign.25 The same behavior has been reported even for core levels, where the picture of local character of the initial state suggests a less intense effect. However, work on the conformation of methyl-oxirane confirms the previous result: performing a Boltzmann average over conformations, the obtained dispersion is reasonably close to that of the equilibrium geometry used for the previous work.
At this point the most urgent question is how reliable is the equilibrium geometry in the presence of rotations? Subsequently, if the accuracy of the calculations in the case of the equilibrium geometry is not satisfactory, how can the effect of the conformers be efficiently included? The cases of some organic molecules studied gave us some hints at interpretation. In the case of alaninol26 we tried to interpret the data with the population at room temperature formed by the two conformers belonging to the most representative population at equilibrium. For some states we successfully improved the agreement considering the presence of the second conformer. A PECD study of the valence band of 3-methyl-cyclopentanone27 revealed a change in the PECD spectra upon heating the molecular gas at a temperature of 370 K. On the basis of a two-conformer population analysis we found a good agreement in the comparison between the theoretical predictions and experimental data for the difference in the PECD spectra obtained at 370 K and room temperature (300 K). The agreement in the difference of the spectra taken at the above-mentioned temperatures is better than that of the terms of the difference. Our interpretation was that in this case the subtraction of the PECD taken at different temperatures lifted the contribution of the rotating groups and the result was closer to the difference of the calculations at equilibrium geometry. Similar conformational effects were observed for alanine11,28 and proline.29
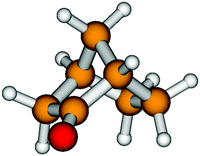
We planned an experimentum crucis choosing (+)-(1S,4R)-norcamphor (Fig. 1), a molecule with a single conformational geometry. Norcamphor (2-norbornanone, bicyclo[2.2.1]heptan-2-one) might be thought of as being the structural parent compound of the large bornane family, whose more versatile chiral compound is the naturally occurring bicyclic ketone (+)-(1R,4R)-camphor, which differs from norcamphor by the presence of two methyl groups bonded at the C7 atom and one methyl group substituting the hydrogen bonded to C1, adjacent to the carbonyl group. The multiple-site reactivity of the bornane skeleton and its rigidity has made these molecules highly useful in different fields for the introduction of chiral groups into pharmacologically active molecules30 and in enantioselective hydrogenation.31 Finally, norcamphor has been confirmed as a suitable chemical for rare functionalisations at carbons of the bornane moiety that provide an efficient approach for the preparation of important norcamphor scaffolds.32
The experimental PECD of camphor has been carefully studied33,34 through comparison using two different state-of-the-art theoretical methods multiple scattering-Xa (MS-Xa)35,36 and LCAO B-spline (B-spline). The outcome of both calculation methods is in accord and describes qualitatively the experimental dispersion for the highest occupied molecular orbital (HOMO). Our aim is to find evidence of whether or not the average of the conformational rotamer configurations distorts PECD calculations at the equilibrium geometry. The idea at the heart of the experiment is to study norcamphor to suppress the effects of the rotamers and to critically compare the outcome of the theory with the experimental results.
Finally, it is worth mentioning that vibrations can also affect PECD via ion displacement.
Actually, a dramatic breakdown of the Franck–Condon (FC) approximation has been found for the valence band of the methyl-oxirane molecule.37 Apart the obvious consideration that vibrations are related to different geometrical configurations, the complex nature of the matrix element, together with the consideration of pseudo-asymmetries, creates an outcome of the sum of the contributions that is extremely sensitive to tiny phase change between them. Indeed, the current landscape, supported by theoretical work,38 points out that weak FC transitions associated with small ion displacements are the transition that is more amenable to break the FC approximation. Consequently, since in unresolved PECD the transitions with large FC factors are more weighted in the overall signal, it seems to be safe to interpret in this way the success of vibrationally unrestricted PECD calculations, although it is not possible to exclude violations as a result of more complex behavior.39 Clearly, a final goal for theoretical simulations will include the accurate treatment of both the conformational flexibility and the remaining vibrational modes.
In PECD data analysis each i-th electronic state of the molecule gives rise to a dispersion as a function of the photoelectron kinetic energy. Phenomenologically, PECD is described via three dynamical parameters in the angle-resolved differential cross-section of the photoelectrons. In the following the equation for elliptically polarized light is reported:
Experimental section
The experiment was carried out at the Circular Polarization beamline (ELETTRA-Trieste (Italy)).40 The circularly polarized light was provided using an electromagnetic elliptical wiggler. We used a normal incidence monochromator in the photon energy range of 15–32 eV for the valence band and a spherical grazing monochromator in the energy range of 295–345 eV for the C 1s core level. In the considered energy range, the circular polarization ratio varied from 60% to 80% for valence band measurements and was about 80% for the C 1s core level. The PECD spectra were measured using a VG, 6-channel, 150 mm hemispherical electron energy analyzer, placed at θz = 54.7°. The total resolution of the photoelectron spectra was about 200 meV.(+)-(1S,2R,4R)-endo-2-Norborneol was purchased from Sigma-Aldrich. Optical rotations were measured using a PerkinElmer Model 241 polarimeter. TLC was performed using Polygram® Sil G/UV254 silica gel pre-coated plastic sheets (eluent: light petroleum–ethyl acetate, 4![[thin space (1/6-em)]](https://www.rsc.org/images/entities/char_2009.gif) :
:![[thin space (1/6-em)]](https://www.rsc.org/images/entities/char_2009.gif) 1). Flash chromatography was run on silica gel 230–400 mesh ASTM (Kieselgel 60, Merck).
1). Flash chromatography was run on silica gel 230–400 mesh ASTM (Kieselgel 60, Merck).
(+)-(1S,4R)-Norcamphor was synthetized through the oxidation of (+)-(1S,2R,4R)-endo-2-norborneol following the procedure indicated in the literature.41 (+)-endo-2-Norborneol (1.0 g, 8.9 mmol) was dissolved in 50 mL of anhydrous dichloromethane at 0 °C under Ar, and 3 Å molecular sieves (9 g) and pyridinium chlorochromate (6.0 g, 27.8 mmol) were added and the suspension was vigorously stirred for 3 h. Diethyl ether (100 mL) was added and, after decantation, the solution was filtered through a glass filter filled with silica gel with 13% calcium sulphate (Fluka). The black residue was washed three times with diethyl ether and the combined filtrates were carefully concentrated via rotary evaporation. The resulting (+)-(1S,4R)-2-norbornanone was purified by flash chromatography (eluent: light petroleum![[thin space (1/6-em)]](https://www.rsc.org/images/entities/char_2009.gif) :
:![[thin space (1/6-em)]](https://www.rsc.org/images/entities/char_2009.gif) diethyl ether, 9
diethyl ether, 9![[thin space (1/6-em)]](https://www.rsc.org/images/entities/char_2009.gif) :
:![[thin space (1/6-em)]](https://www.rsc.org/images/entities/char_2009.gif) 1), 40% total yield with [α]25D = +26.3 (c 1.0, CHCl3) ([α]25D = + 29.1 (c 1.5, CHCl3),42 [α]25D = + 29.8 (c 1.1, CHCl3),43 [α]25D = +27.2 (c 1.8, CHCl3)44); all spectroscopic data are identical to a commercially available sample of racemic 2-norbornanone.
1), 40% total yield with [α]25D = +26.3 (c 1.0, CHCl3) ([α]25D = + 29.1 (c 1.5, CHCl3),42 [α]25D = + 29.8 (c 1.1, CHCl3),43 [α]25D = +27.2 (c 1.8, CHCl3)44); all spectroscopic data are identical to a commercially available sample of racemic 2-norbornanone.
To acquire data in linearly polarized radiation a commercially supplied (purity 98%, Sigma–Aldrich) racemic mixture of norcamphor was used. The norcamphor was introduced into an effusive source exploiting the room temperature vapor tension.
To ease the comparison between norcamphor and camphor we reversed the sign of the dichroism of (1S,4R)-norcamphor to obtain the PECD of the (1R,4S)-norcamphor enantiomer.
The pressure during the measurements was about 5 × 10⁻⁶ mbar. PECD measurements were recorded alternating the helicity of the radiation at a 0.05 Hz frequency. A complete description of the experimental D extraction and analysis and the correction for the ellipticity of the light present at the Circular Polarization beamline are reported elsewhere.26
Computational methods
The calculations of the PECD spectra were performed on the grounds of density functional theory (DFT) and time-dependent density functional theory (TDDFT).22 The LB94 exchange–correlation potential,45 which provides the correct asymptotic behavior of the Coulomb tail for continuum calculations, was chosen. The ground-state density, which defines the Kohn–Sham Hamiltonian, was obtained via an SCF calculation with a DZP basis employing the ADF program.46The B-spline LCAO method was employed to calculate the photoelectron wave function in the continuum.47 This is based on the use of basis functions of the type
| χilm = 1/rBi(r)Ylm(θ,φ) |
Ionization energies were separately computed to confirm assignment of the spectrum using the OVGF approach and the Gaussian program.48
Results and discussion
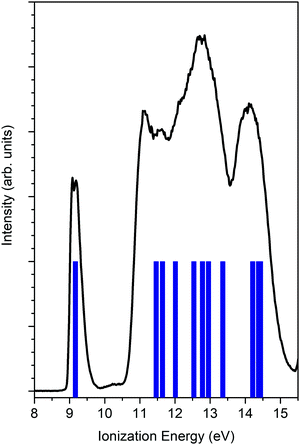
Fig. 2 reports the unpolarized valence band spectrum measured at a photon energy 23.2 eV together with the OVGF ionization energies. The HOMO is well-resolved and is identified from the first peak. The HOMO is mainly based on the O 2p lone pair with a significant contribution from the 2p orbitals of C adjacent atoms. The Mulliken population reports for the HOMO most significant contributions of 55% 2p O, 8% 2p C3 (CH2), and 10% 2p C1(CH).The isolated HOMO peak allows us to neglect any mixing of other molecular orbitals in the experimental data analysis and, consequently, to avoid convoluting theoretical data with a poor reliable assumption about the energy position, intensity and width.
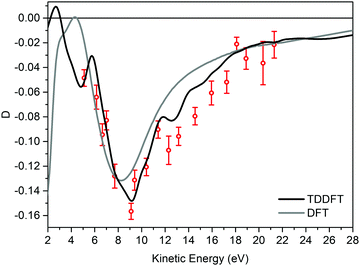
Fig. 3 displays the experimental valence band D dispersion of the HOMO of (−)-(1R,4S)-norcamphor as a function of kinetic energy along with the DFT and TDDFT calculated dispersions. The theoretical D parameters are shifted 1.6 eV towards higher kinetic energy values to align the minima, where this phenomenological shift is justified by the attractive behavior of the LB94 functional. The D parameter is always negative, and the shape of the dispersion is a valley with a marked minimum at 9 eV and the full shape presents excellent quantitative agreement for both DFT and TDDFT. In particular, the TDDFT dispersion is closer to the experimental one and displays a more structured behaviour; the calculated dispersion is also in agreement with the fine structure of the experimental dispersion in the range of 12–14 eV. This result is of paramount importance because it straightforwardly addresses the issue we posed at the beginning, i.e., the absence of rotating groups has a remarkable influence on the comparison between calculation at the equilibrium geometry and the experiment.
To better understand this crucial aspect, we compare our results with those obtained in the case of the HOMO of camphor and those reported in the literature.34Fig. 4 displays a comparison between the HOMO D dispersion of (+)-(1R,4R)-camphor (data digitalized and plotted from ref. 34) and (−)-(1R,4S)-norcamphor in the energy range of 5–20 eV; to make the comparison easier, the camphor data were multiplied by a factor 2 and shifted 2 eV towards lower kinetic energies to align the minima. The HOMO dispersions of the two molecules present the same sign and profile; the same asymmetric shape around the minimum is present with a longer tail towards higher kinetic energies. This result clearly proves from a phenomenological point of view that structural similarities are reflected on the PECD dispersion, and we believe that the same sign and the resemblance of the two minima are an indication of the similar molecular structures.
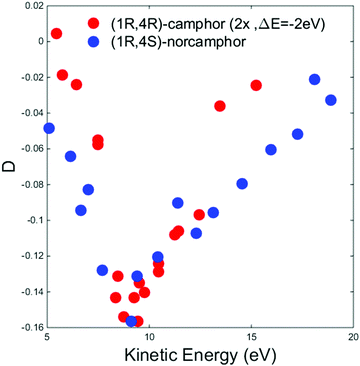 | ||
| Fig. 4 Experimental D dispersions of the HOMO of (+)-(1R,4R)-camphor (red dots) and (−)-(1R,4S)-norcamphor (blue dots). The camphor HOMO dispersion has been multiplied by a factor 2 and shifted 2 eV toward lower kinetic energies to facilitate the visual comparison. Camphor data are digitalized and plotted from ref. 34. Error bars are omitted. The (1S,4R)-norcamphor data have been negated to obtain the (1R,4S)-norcamphor D. | ||
In the camphor HOMO study, both MS-Xa and B-spline theories reproduce in a satisfactory way the shape of the experimental dispersion in the intermediate energy range, in particular the oscillation around the minimum at 12.2 eV. The MS-Xa theory also follows the oscillations closer to the thresholds. Preliminary calculations using the B-spline code show that this behavior is strongly dependent on the choice of the local potential. At the quantitative level, the comparison of the sign and intensity of the theoretical and experimental dispersion fails in some region of the investigated range, in fact the sign of the experimental data is always negative while the theoretical values oscillates between positive and negative values. The different agreement of the theory of norcamphor and camphor, together with the close similarity of a region of the dispersion, directly indicate that the influence of the rotating methyl groups cannot be considered negligible in the theoretical modeling of the experimental data.
To strengthen this consideration we repeat here that a similar conclusion was drawn for the PECD study of the structural isomers alaninol and isopropanolamine,49 where a strong resemblance between alaninol and isopropanolamine was found for the experimental HOMO and HOMO−1 dispersion, in spite of a qualitative agreement with the DFT B-spline calculations. The calculations at the equilibrium geometry do not fully reproduce the experimental data; nevertheless, the experimental dispersion exhibits similar shapes.
Although at the present stage it is not possible to convert the line of reasoning exposed above into a quantitative result, like a data analysis procedure or a prescription in the calculation, we believe it grasps the important behavior of the PECD conformational sensitivity.
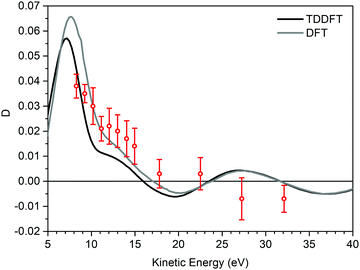
The findings of the C 1s PECD of norcamphor were also studied. Fig. 5 reports the 1s PES core levels acquired at the photon energy of 320 eV. The spectrum is composed of two separate peaks that are assigned to the C 1s signal of the carbonyl group (IE = 293.0 eV) and to the other alkylic C 1s contributions (IE = 290.6 eV). The PECD measurements were performed on the carbonyl-related peak to investigate a single atomic C 1s signal. Fig. 6 shows the comparison between the experimental data and the theoretical DFT and TDDFT calculations. The calculations were shifted 1.2 eV towards higher kinetic energies. The calculations are in good agreement with the descending part of the dispersion and also the shoulder. However, for kinetic energies greater than 20 eV the agreement is hampered by the poor signal-to-noise ratio, and the calculated dispersion is in satisfying agreement close to the experimental error bar.
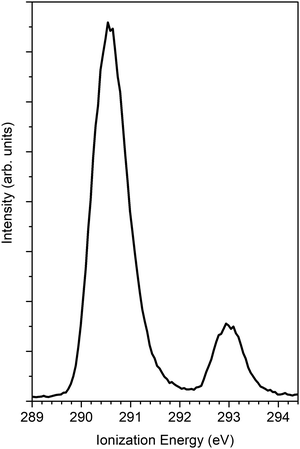 | ||
| Fig. 5 PES C 1s of norcamphor taken at a photon energy 305 eV. The ionization energy of the C atom of the carbonyl group is 293 eV. | ||
In the literature, both MS-Xa and B-spline LCAO also reproduce well the core levels in molecules where the valence band agreement is qualitative or not satisfactory. The prevalent atomic nature of the C 1s core level provides a sharply defined initial state, since for the valence band the theory assignment is more dependent on the chosen theoretical method. This simplification is certainly helpful in the accuracy of the theoretical calculation. Indeed, the conformational geometry effects on the PECD have a different origin in valence band and in the core level states. Despite the local character of the core level excitation, the sensitivity is neither fully local nor fully extended, as in the case of the valence band, and the balance between the local excitation and the whole molecular potential probed by the photoelectrons gives to the core level PECD a sufficient sensitivity to the molecule geometry. As reported above, in methyl oxirane C 1s calculations, the rotations of the methyl group exert their influence also for C atoms that are not directly connected with methyl groups.25
Moreover, it is important to note that the pure p-wave continuum generated by core 1s ionization limits the number of accessible angular momentum channels of the photoelectron continuum wavefunction, and PECD directly probes the rescattering generated by the neighboring atoms.
It is worth noticing that for camphor the experimental C 1s PECD dispersion of the carbonyl group is well reproduced using MS-Xa theory.50 To qualitatively understand the different agreement of the calculations for the valence band and C 1s core of camphor, it could be likely that the methyl groups are far enough to have a tiny influence on the photoelectron wavefunction in the proximity of the C absorbing atom and the effect of the rotations could be considered negligible, although it is not possible to rule out that the Boltzmann average of the configurations approximates the equilibrium calculation. As reported in Fig. 4 for the HOMO dispersion, Fig. 7 shows the experimental D dispersion for the C 1s of the carbonyl group for (+)-(1R,4R)-camphor and (−)-(1R,4S)-norcamphor. The camphor data are extracted and plotted from ref. 50, where the reported asymmetries were divided by cos(54.7°) to obtain the D parameter. As previously reported for the HOMO, there are also similar features in the C 1s dispersion, where the descending part and the negative region of the minimum have the same shape, although the minimum is not clearly outlined for norcamphor. The zero crossing of norcamphor stays at higher electron kinetic energies with respect to camphor.
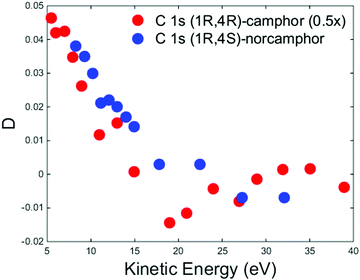 | ||
| Fig. 7 Experimental D dispersions of C 1s of (+)-(1R,4R)-camphor (red dots) and (−)-(1R,4S)-norcamphor (blue dots). The camphor C 1s dispersion has been multiplied by a factor 0.5 to facilitate the visual comparison. Camphor data are extracted and plotted from ref. 50, where the reported asymmetries were divided by cos(54.7°) to obtain the D parameter. Error bars are omitted. The (1S,4R)-norcamphor data have been negated to obtain the (1R,4S)-norcamphor D. | ||
From the comparison of experiment and theory in norcamphor and camphor, we outline the general conclusions that help us to understand some open issues on PECD. State-of-the-art DFT and TDDFT quantum theory at the equilibrium geometry can correctly describe the PECD of molecules in the absence of rotating groups. Rotamers can exert a strong influence on PECD and the average on the configurations can resolve a theoretical dispersion that is different from the dispersion calculated at the equilibrium geometry. Another important result is that the comparison of the experimental HOMO dispersions for camphor and norcamphor shows that there are similarities, due to the identical skeleton structure. When equilibrium geometry calculations are employed in molecules where conformers and/or rotamers are present the outcome can differ from the experimental dispersion although in a not predictable way. However, it is also evident from previous studies that equilibrium geometry calculations always describe the essential features, especially in determining the maxima and minima of the D dispersion as a function of the kinetic energy, and can be posed as a solid foundation of PECD spectroscopy. Due to the possible slight energy misalignment between the experimental and calculated PECD profiles, it is important that the experimental data cover a substantial energy region, i.e., at least several eV, beyond the threshold region.
Conclusions
In conclusion, our work confirmed in a straightforward way the relationship between the PECD dispersion and tiny conformational effects such as the rotations of functional groups. State-of-the-art methods of calculation, such as the B-spline approximation, are capable of fully reproducing the PECD dispersions of the HOMO for a mono-conformer molecule.In this context, future efforts will be devoted to incorporating a treatment to take into account the distribution of the conformational geometries, providing an efficient choice of the ensemble of configurations to avoid the unsustainable burden of brute-force calculations.
A fair trade off between the calculation accuracy and the number of configurations is desirable to avoid to wasting calculation time that can be caused by attempting in a not-needed accuracy or oversampling the configurations. A subsequent question that cannot be ducked is the influence of the density functional on the PECD calculations; in this and previous studies performed by the authors, the density functional LB94 was the preferred choice due to the correct tail for continuum calculations, but it could be of paramount importance to explore the correlation with other functionals. PECD intertwines the structure and electronic properties, which is a gift and a curse because it is not easy to isolate and recognize which approximation is not corresponding to the actual description of the molecular system. From this perspective, the effort of the past two decades has given a solid foundation, although loose ends still remain if the power of PECD is to be fully harnessed.
Given the importance of theoretical simulations for extracting maximum information from experimental data, the development of predictive computational tools is mandatory. The typical size of chiral molecules, and possible conformational averaging, makes higher-level treatments hardly affordable, and spurs the optimization of local and possibly non-local single-particle potentials, especially for the lower kinetic energy region where important PECD signatures are found. To this end, a set of accurate experimental data on rigid systems, to avoid ambiguities in conformational distribution, is highly desirable to serve as a benchmark for theoretical development.
Although circularly polarized core-level spectroscopy is traditionally rooted in X-ray magnetic circular dichroism, the increasing interest in PECD fosters the demand for chemical physics investigations of chiral molecules.
Exploiting core-level PECD, profiting from the reduced number of angular momentum channels and the local nature of the excitation could be of practical importance to access both the electronic and structural properties of chiral molecules in the gas phase.
Conflicts of interest
There are no conflicts to declare.References
- C. A. Taatjes, O. Welz, A. J. Eskola, J. D. Savee, A. M. Scheer, D. E. Shallcross, B. Rotavera, E. P. F. Lee, J. M. Dyke, D. K. W. Mok, D. L. Osborn and C. J. Percival, Direct Measurements of Conformer-Dependent Reactivity of the Criegee Intermediate CH3CHOO, Science, 2013, 340, 177–180 CrossRef CAS PubMed.
- Femtochemistry ed. F. C. De Schryver, S. De Feyter and G. Schweitzer, Wiley-VCH Verlag GmbH, 2001.
- M. Stener, G. Fronzoni, D. Di Tommaso and P. Decleva, Density functional study on the circular dichroism of photoelectron angular distribution from chiral derivatives of oxirane, J. Chem. Phys., 2004, 120, 3284–3296 CrossRef CAS PubMed.
- S. X. Tian and J. Yang, Effects of Intramolecular Hydrogen Bonding on the Ionization Energies of Proline, Angew. Chem., Int. Ed., 2006, 45, 2069–2072 CrossRef CAS PubMed.
- O. Plekan, V. Feyer, R. Richter, M. Coreno, M. de Simone, K. C. Prince and V. Carravetta, Photoemission and the shape of amino acids, Chem. Phys. Lett., 2007, 442, 429–433 CrossRef CAS.
- O. Plekan, V. Feyer, R. Richter, M. Coreno, M. De Simone, K. C. Prince and V. Carravetta, Investigation of the Amino Acids Glycine, Proline, and Methionine by Photoemission Spectroscopy, J. Phys. Chem. A, 2007, 111, 10998–11005 CrossRef CAS PubMed.
- S. Mata, V. Vaquero, C. Cabezas, I. Peña, C. Pérez, J. C. López and J. L. Alonso, Observation of two new conformers of neutral proline, Phys. Chem. Chem. Phys., 2009, 11, 4141–4144 RSC.
- T. R. Rizzo, Y. D. Park, L. A. Peteanu and D. H. Levy, The electronic spectrum of the amino acid tryptophan in the gas phase, J. Chem. Phys., 1986, 84, 2534 CrossRef CAS.
- A. Lattanzi, A. Scettri, R. Zanasi, F. J. Devlin and P. J. Stephens, Absolute configuration assignment of norcamphor-derived furyl hydroperoxide using density functional theory calculations of optical rotation and vibrational circular dichroism, J. Org. Chem., 2010, 75, 2179–2188 CrossRef CAS PubMed.
- B. Ritchie, Theory of the angular distribution of photoelectrons ejected from optically active molecules and molecular negative ions, Phys. Rev. A: At., Mol., Opt. Phys., 1976, 13, 1411–1415 CrossRef.
- M. Tia, B. Cunha De Miranda, S. Daly, F. Gaie-Levrel, G. A. Garcia, L. Nahon and I. Powis, VUV photodynamics and chiral asymmetry in the photoionization of gas phase alanine enantiomers, J. Phys. Chem. A, 2014, 118, 2765–2779 CrossRef CAS PubMed.
- M. M. R. Fanood, N. B. Ram, C. S. Lehmann, I. Powis and M. H. M. Janssen, Enantiomer-specific analysis of multi-component mixtures by correlated electron imaging–ion mass spectrometry, Nat. Commun., 2015, 6, 7511 CrossRef CAS PubMed.
- C. S. Lehmann and K. M. Weitzel, Coincident measurement of photo-ion circular dichroism and photo-electron circular dichroism, Phys. Chem. Chem. Phys., 2020, 22, 13707–13712 RSC.
- K. Fehre, N. M. Novikovskiy, S. Grundmann, G. Kastirke, S. Eckart, F. Trinter, J. Rist, A. Hartung, D. Trabert, C. Janke, G. Nalin, M. Pitzer, S. Zeller, F. Wiegandt, M. Weller, M. Kircher, M. Hofmann, L. P. H. Schmidt, A. Knie, A. Hans, L. Ben Ltaief, A. Ehresmann, R. Berger, H. Fukuzawa, K. Ueda, H. Schmidt-Böcking, J. B. Williams, T. Jahnke, R. Dörner, M. S. Schöffler and P. V. Demekhin, Fourfold Differential Photoelectron Circular Dichroism, Phys. Rev. Lett., 2021, 127, 103201 CrossRef CAS PubMed.
- G. Alberti, S. Turchini, G. Contini, N. Zema, T. Prosperi, S. Stranges, V. Feyer, P. Bolognesi and L. Avaldi, Dichroism in core-excited and core-ionized methyloxirane, Phys. Scr., 2008, 78, 058120 CrossRef.
- D. Catone, M. Stener, P. Decleva, G. Contini, N. Zema, T. Prosperi, V. Feyer, K. C. Prince and S. Turchini, Resonant Circular Dichroism of Chiral Metal-Organic Complex, Phys. Rev. Lett., 2012, 108, 83001 CrossRef CAS PubMed.
- C. Lux, M. Wollenhaupt, T. Bolze, Q. Liang, J. Köhler, C. Sarpe and T. Baumert, Circular dichroism in the photoelectron angular distributions of camphor and fenchone from multiphoton ionization with femtosecond laser pulses, Angew. Chem., Int. Ed., 2012, 51, 5001–5005 CrossRef CAS PubMed.
- A. Ferré, C. Handschin, M. Dumergue, F. Burgy, A. Comby, D. Descamps, B. Fabre, G. A. Garcia, R. Géneaux, L. Merceron, E. Mével, L. Nahon, S. Petit, B. Pons, D. Staedter, S. Weber, T. Ruchon, V. Blanchet and Y. Mairesse, A table-top ultrashort light source in the extreme ultraviolet for circular dichroism experiments, Nat. Photonics, 2015, 9, 93–98 CrossRef.
- I. Powis, in Comprehensive Chiroptical Spectroscopy, John Wiley and Sons, 2012, vol. 1, pp. 407–431 Search PubMed.
- S. Turchini, Conformational effects in photoelectron circular dichroism, J. Phys.: Condens. Matter, 2017, 29, 503001 CrossRef CAS PubMed.
- I. Powis, Photoelectron circular dichroism in chiral molecules, Adv. Chem. Phys., 2008, 138, 267–329 CrossRef CAS.
- M. Stener, G. Fronzoni and P. Decleva, Time-dependent density-functional theory for molecular photoionization with noniterative algorithm and multicenter B-spline basis set: CS2 and C6H6 case studies, J. Chem. Phys., 2005, 122, 234301 CrossRef CAS PubMed.
- S. Turchini, N. Zema, G. Contini, G. Alberti, M. Alagia, S. Stranges, G. Fronzoni, M. Stener, P. Decleva and T. Prosperi, Circular dichroism in photoelectron spectroscopy of free chiral molecules: Experiment and theory on methyl-oxirane, Phys. Rev. A: At., Mol., Opt. Phys., 2004, 70, 014502 CrossRef.
- S. Stranges, S. Turchini, M. Alagia, G. Alberti, G. Contini, P. Decleva, G. Fronzoni, M. Stener, N. Zema and T. Prosperi, Valence photoionization dynamics in circular dichroism of chiral free molecules: The methyl-oxirane, J. Chem. Phys., 2005, 122, 244303 CrossRef CAS PubMed.
- D. Di Tommaso, M. Stener, G. Fronzoni and P. Decleva, Conformational effects on circular dichroism in the photoelectron angular distribution, ChemPhysChem, 2006, 7, 924–934 CrossRef CAS PubMed.
- S. Turchini, D. Catone, G. Contini, N. Zema, S. Irrera, M. Stener, D. Di Tommaso, P. Decleva and T. Prosperi, Conformational effects in photoelectron circular dichroism of alaninol, ChemPhysChem, 2009, 10, 1839–1846 CrossRef CAS PubMed.
- S. Turchini, D. Catone, N. Zema, G. Contini, T. Prosperi, P. Decleva, M. Stener, F. Rondino, S. Piccirillo, K. C. Prince and M. Speranza, Conformational sensitivity in photoelectron circular dichroism of 3-methylcyclopentanone, ChemPhysChem, 2013, 14, 1723–1732 CrossRef CAS PubMed.
- M. Tia, B. Cunha De Miranda, S. Daly, F. Gaie-Levrel, G. A. Garcia, I. Powis and L. Nahon, Chiral asymmetry in the photoionization of gas-phase amino-acid alanine at lyman-α radiation wavelength, J. Phys. Chem. Lett., 2013, 4, 2698–2704 CrossRef CAS.
- R. Hadidi, D. K. Božanić, H. Ganjitabar, G. A. Garcia, I. Powis and L. Nahon, Conformer-dependent vacuum ultraviolet photodynamics and chiral asymmetries in pure enantiomers of gas phase proline, Commun. Chem., 2021, 4, 72 CrossRef CAS.
- Á. M. Montaña, F. J. Bernal, J. Lorenzo, C. Farnós, C. Batalla, M. J. Prieto, V. Moreno, F. X. Avilés, J. M. Mesas and M. T. Alegre, Synthesis, characterization and antiproliferative studies of the enantiomers of cis-[(1,2-camphordiamine)dichloro]platinum(II) complexes, Bioorg. Med. Chem., 2008, 16, 1721–1737 CrossRef PubMed.
- D. Chen, Y. Wang and J. Klankermayer, Enantioselective Hydrogenation with Chiral Frustrated Lewis Pairs, Angew. Chem., 2010, 122, 9665–9668 CrossRef.
- R. Mose, M. E. Jensen, G. Preegel and K. A. Jørgensen, Direct Access to Multifunctionalized Norcamphor Scaffolds by Asymmetric Organocatalytic Diels-Alder Reactions, Angew. Chem., 2015, 127, 13834–13838 CrossRef.
- M. Stener, D. Di Tommaso, G. Fronzoni, P. Decleva and I. Powis, Theoretical study on the circular dichroism in core and valence photoelectron angular distributions of camphor enantiomers, J. Chem. Phys., 2006, 124, 024326 CrossRef CAS PubMed.
- L. Nahon, L. Nag, G. A. Garcia, I. Myrgorodska, U. Meierhenrich, S. Beaulieu, V. Wanie, V. Blanchet, R. Géneaux and I. Powis, Determination of accurate electron chiral asymmetries in fenchone and camphor in the VUV range: sensitivity to isomerism and enantiomeric purity, Phys. Chem. Chem. Phys., 2016, 18, 12696–12706 RSC.
- I. Powis, Photoelectron circular dichroism of the randomly oriented chiral molecules glyceraldehyde and lactic acid, J. Chem. Phys., 2000, 112, 301 CrossRef CAS.
- I. Powis, Photoelectron Spectroscopy and Circular Dichroism in Chiral Biomolecules: l -Alanine, J. Phys. Chem. A, 2000, 104, 878–882 CrossRef CAS.
- G. A. Garcia, L. Nahon, S. Daly and I. Powis, Vibrationally induced inversion of photoelectron forward-backward asymmetry in chiral molecule photoionization by circularly polarized light, Nat. Commun., 2013, 4, 2132 CrossRef PubMed.
- I. Powis, The influence of vibrational parity in chiral photoionization dynamics, J. Chem. Phys., 2014, 140, 111103 CrossRef PubMed.
- H. Ganjitabar, G. A. Garcia, L. Nahon and I. Powis, Decoupling vibration and electron energy dependencies in the photoelectron circular dichroism of a terpene, 3-carene, J. Chem. Phys., 2020, 153, 034302 CrossRef CAS PubMed.
- D. Desiderio, S. Difonzo, B. Dlviacco, W. Jark, J. Krempasky, R. Krempaska, F. Lama, M. Luce, H. C. Mertins, M. Placentini, T. Prosperi, S. Rinaldi, G. Soullie, F. Schäfers, F. Schmolle, L. Stichauer, S. Turchini, R. P. Walker and N. Zema, The elettra circular polarization beamline and electromagnetic elliptical wiggler insertion device, Synchrotron Radiat. News, 1999, 12, 34–38 CrossRef.
- J. Herscovici, M. J. Egron and K. Antonakis, New oxidative systems for alcohols: molecular sieves with chromium(VI) reagents, J. Chem. Soc., Perkin Trans. 1, 1982, 1967–1973 RSC.
- A. J. Irwin and J. B. Jones, Stereoselective Horse Liver Alcohol Dehydrogenase Catalyzed Oxidoreductions of Some Bicyclic [2.2.1] and [3.2.1] Ketones and Alcohols, J. Am. Chem. Soc., 1976, 98, 8476–8482 CrossRef CAS PubMed.
- M. Kawamura and K. Ogasawara, Enantio- and stereocontrolled syntheses of (−)-semburin, (+)-N-benzoylmeroquinene aldehyde, (−)-antirhine, and (+)-isocorynantheol from common (+)-norcamphor, Tetrahedron Lett., 1995, 36, 3369–3372 CrossRef CAS.
- E. Plettner, A. Mohle, M. T. Mwangi, J. Griscti, B. O. Patrick, R. Nair, R. J. Batchelor and F. Einstein, 2-Chlorobicyclo[2.2.1]hept-5-ene-2-carboxamide and 2-chlorobicyclo[2.2.1]heptane-2-carboxamide as precursors of bicyclo[2.2.1]hept-5-en-2-one and bicyclo[2.2.1]heptan-2-one: resolution, absolute configuration and hydrogen-bonding properties, Tetrahedron: Asymmetry, 2005, 16, 2754–2763 CrossRef CAS.
- R. Van Leeuwen and E. J. Baerends, Exchange-correlation potential with correct asymptotic behavior, Phys. Rev. A: At., Mol., Opt. Phys., 1994, 49, 2421–2431 CrossRef CAS PubMed.
- G. te Velde, F. M. Bickelhaupt, E. J. Baerends, C. Fonseca Guerra, S. J. A. van Gisbergen, J. G. Snijders and T. Ziegler, Chemistry with ADF, J. Comput. Chem., 2001, 22, 931–967 CrossRef CAS.
- M. Stener, D. Toffoli, G. Fronzoni and P. Decleva, Recent advances in molecular photoionization by density functional theory based approaches, Theor. Chem. Acc., 2007, 117, 943–956 Search PubMed.
- M. J. Frisch, G. W. Trucks, H. B. Schlegel, G. E. Scuseria, M. A. Robb, J. R. Cheeseman, G. Scalmani, V. Barone, G. A. Petersson, H. Nakatsuji, X. Li, M. Caricato, A. V. Marenich, J. Bloino, B. G. Janesko, R. Gomperts, B. Mennucci, H. P. Hratchian, J. V. Ortiz, A. F. Izmaylov, J. L. Sonnenberg, D. Williams-Young, F. Ding, F. Lipparini, F. Egidi, J. Goings, B. Peng, A. Petrone, T. Henderson, D. Ranasinghe, V. G. Zakrzewski, J. Gao, N. Rega, G. Zheng, W. Liang, M. Hada, M. Ehara, K. Toyota, R. Fukuda, J. Hasegawa, M. Ishida, T. Nakajima, Y. Honda, O. Kitao, H. Nakai, T. Vreven, K. Throssell, J. A. Montgomery, Jr., J. E. Peralta, F. Ogliaro, M. J. Bearpark, J. J. Heyd, E. N. Brothers, K. N. Kudin, V. N. Staroverov, T. A. Keith, R. Kobayashi, J. Normand, K. Raghavachari, A. P. Rendell, J. C. Burant, S. S. Iyengar, J. Tomasi, M. Cossi, J. M. Millam, M. Klene, C. Adamo, R. Cammi, J. W. Ochterski, R. L. Martin, K. Morokuma, O. Farkas, J. B. Foresman and D. J. Fox, Gaussian 16, Revision C.01, Gaussian, Inc., Wallingford CT, 2016 Search PubMed.
- D. Catone, S. Turchini, G. Contini, T. Prosperi, M. Stener, P. Decleva and N. Zema, Photoelectron circular dichroism of isopropanolamine, Chem. Phys., 2017, 482, 294–302 CrossRef CAS.
- U. Hergenhahn, E. E. Rennie, O. Kugeler, S. Marburger, T. Lischke, I. Powis and G. Garcia, Photoelectron circular dichroism in core level ionization of randomly oriented pure enantiomers of the chiral molecule camphor, J. Chem. Phys., 2004, 120, 4553–4556 CrossRef CAS PubMed.
| This journal is © the Owner Societies 2022 |

